Influence of obesity gene in quantitative traits of swine
Graciele Segantini do Nascimento Borges and Luiz Ricardo Goulart
Laboratório de Genética Molecular, Instituto de Genética e Bioquímica, Universidade Federal de
Uberlândia, Uberlândia, MG, Brasil.
Abstract
Genotype data of 477 animals of several swine races (Landrace - LD,Large White - LW,Pietrain - PI,LWXLDXPI, Piau,Monteiro,and unknown race) were obtained to determine the allele frequency of the obesity gene. Genotype data of 174 crossbred swine (LWXLDXPI) were also obtained,in order to assess its correlation with carcass evaluation data (lean meat percentage,backfat thickness at P2,loin eye area,adjacent fat area,total fat and meat). Finally,genotype data of 96 pure swine (Landrace,Large White and Pietrain) were collected,to establish its relation with meat quality (drip loss,meat color,texture analysis and intramuscular fat) and carcass evaluation data (lean meat percentage; ham,loin,shoulder and belly weights; and backfat thickness at P2). This work also aimed associating EPDs (expected progeny differences) for litter size,daily weight gain and backfat thickness with genotype data of 49 Large White males and 54 Landrace females. Genotyping was done on animal blood by PCR-RFLP,based on Stratilet al. (1997). Statistical analysis was done by using SAS software for variance analysis between genotypes and data for each cited class. For purebred animals,a mixed model was used,with sire within race as random effect. The allelic frequencies of alleles T and C were,respectively: 0.8142; 0.1857 (Landrace); 0.9125; 0.0875 (Large White); 0.9433; 0.0566 (Pietrain); 0.8333; 0.1666 (LWXLDXPI); 0.2500; 0.7500 (Piau); 0.8750; 0.1250 (Monteiro),and 0.8870; 0.1130 (unknown race). Since the highest allele C frequency occurred in Piau,we suggest that this allele could be associated with fat accumulation. In the Landrace race,a study was done separating the frequencies of 2 generations (great-grandfather and grandfather),and the differences confirmed by a Chi-square test,a higher frequency of allele C having been found in the grandparental generation. This suggests that this allele could be eliminated by selection from the great-grandparental generation,when the male grandparent is replaced by the great-grandparental generation. The obesity gene did not influence any of the carcass evaluation data from crossbred animals. In pure swine,where the only genotypes were TT and TC,it greatly influenced shoulder weight and meat texture,with the highest average in heterozygotes (shoulder: 4.07vs. 3.93; texture: 2.62 vs. 1.82), suggesting better carcass quality and worse meat quality than in homozygotes. The obesity gene did not influence any trait in the expected progeny difference (EPD) study.
Key words: obese gene, leptin gene, quantitative traits.
Received: March 3, 2002; accepted: March 25, 2002.
Introduction
Obesity, a chronic imbalance between energy intake and expenditure, is a multifactorial pathology involving complex interactions of genetic and environmental factors (Cusinet al.,1995). As yet, it lacks specific therapy.
Although obesityper seis not a major concern in ani-mal agriculture, to alter body composition by combining nutrients which favor lean protein accretion, thus improv-ing production efficiency and satisfyimprov-ing both consumer and industrial demands, is a major goal of animal scientists (Houseknechtet al., 1998).
In earlier studies on obesity in animals, it was be-lieved that genetically obese individuals would present de-fects in theob gene (mutation), in leptin receptors or in signaling pathways triggered by receptors (Barinaga, 1996).
In livestock animals, the goal is still to identify the complete sequence of one of all genes carrying identified mutations responsible for the disease; the obese gene has recently been cloned for mice, human, and swine (Bidwell
et al.,1997).
Theobgene codes for a protein named leptin that is produced by adipocytes (fat-storage cells) and circulates in the blood (Zhanget al., 1994). Its physiological function is still obscure, but it is thought that this hormone signals sati-ety, maintaining stability of body fat mass. In practice, loss
www.sbg.org.br
nous administration of the hormone (Pelleymonteret al., 1995). But in swine the function of the obese gene and its expression in physiology/growth is currently unknown. However, experiments confirmed the hypothesis that por-cine leptin expression varies with propensity for adipose tissue deposition (Ramsayet al., 1998).
In the hog industry, carcass weight, percentage of lean meat, cut yields and meat quality determine the price. In Brazil, hog producers are currently paid according to weight and lean meat percentage based on backfat thick-ness (Upnmoor, 1997).
Visscher and Haley (1998) state that molecular mark-ers hold great potential for swine improvement programs, stressing marker use when the normal selection is not effec-tive,e.g., for traits restricted to sex or carcass.
The aim of this work was to find some relation be-tween the swine obese gene polymorphism and quantitative traits.
Materials and Methods
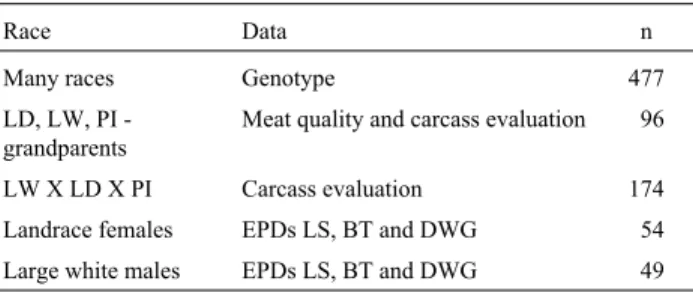
The objective of this work was to determine the allele frequency of the obesity gene in several swine races (Land-race, Large White, Pietrain, LWXLDXPI, Piau, Monteiro and an unknown race), using a total of 477 animals. It fur-ther proposed to associate the obesity gene genotype with carcass evaluation data (lean meat percentage, backfat thickness at P2, loin eye area, adjacent fat area, total fat and meat) in 174 crossbred swine (LWXLDXPI), with both meat quality (drip loss, meat color, texture analysis and in-tramuscular fat) and carcass evaluation data (lean meat per-centage; ham, loin, shoulder and belly weights; and backfat thickness at P2) in 96 pure swine (Landrace, Large White and Pietrain). It intended to associate EPDs (expected prog-eny differences) for litter size (LS), daily weight gain (DWG) and backfat thickness (BT) in 49 Large White males and 54 Landrace females (Table I).
Backfat thickness was evaluated because it is related to the quality of swine meat: the greater the lean meat yield, the higher the carcass value. Meat quality and carcass eval-uation data were used because the obese gene may be
Halothane gene, allowing exclusion of undesirable traits in animal crossbreeding.
Litter size data was evaluated because leptin is a sig-nal for the reproductive system, and daily weight gain was measured because of the correlation between feed intake and obesity.
Genotyping for theobgene
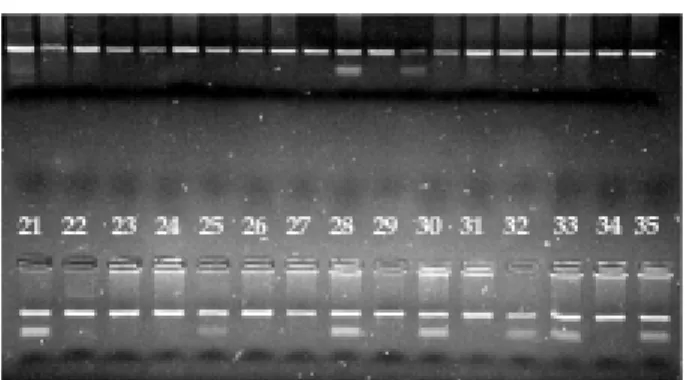
Genotyping was done on animal blood by PCR-RFLP, based on Stratilet al.(1997), using a pair of primers which amplified a 152-base-pair sequence in the swine gene. Following amplification of the genomic DNA, PCR products were digested with HinfI and electropho-resed in 3.5% agarose gel; the DNA bands were visualized by ethidium bromide staining of the gel. Two alleles were detected: allele T fragment 152bp (uncut), and allele C -fragments 68 and 84 bp.
Crossbred animals (PIXLDXLW) (Antunes, 1997)
A hundred and seventy-four swine, including cas-trated males and females, were slaughtered, and their car-casses dissected into meat, bone, fat, skin and offal, weighed separately. In this experiment, data were collected for only lean meat percentage; backfat thickness at P2; loin eye and adjacent fat area; and total fat and meat data, since, according to Felícioet al.(1986), these traits are highly cor-related with leanness.
Purebred animals (Franco, 1999)
Ninety-six animal carcasses including the Pietrain, Landrace and Large White races, with 16 uncastrated males and 16 females of each race, were analyzed. Data used to test the effect of the obesity genotype were: dissected car-casses; lean meat percentage; ham, loin, shoulder and belly weights; and backfat thickness at P2.
Meat quality data were obtained by analyzing func-tional properties,e.g., drip loss, meat color, texture and in-tramuscular fat.
Expected progeny differences x obese genotyping
Fifty-four Landrace females and forty-nine Large White males were genotyped together with EPDs data to compare obesity genotyping for litter size, daily weight gain and backfat thickness.
Statistical analysis
Statistical analysis was done by using SAS software, release 6.12(1996), on variance between genotypes and the data for each cited class.
For crossbred animals, the following model was used: Table I- Race, data and individuals (n) used in this experiment.
Race Data n
Many races Genotype 477
LD, LW, PI -grandparents
Meat quality and carcass evaluation 96
LW X LD X PI Carcass evaluation 174
Landrace females EPDs LS, BT and DWG 54
Yij=µ+ Gi+ Sj+β(Xij- X..) + eij
Yij: traits observed (lean meat percentage [LMP],
backfat thickness [BT], loin eye area, total fat and meat) in ithgenotype and jthsex.
µ: sum of least square means.
Gi: genotype with i value 0, 1 or 2: 0 = CC, 1 = TC, 2=
TT.
Sj: sex, with j value 1 or 2: 1 = male and 2= female.
eij: random error with normal distribution, and
inde-pendently distributed with zero mean andσ2variance. Carcass weight was used ascovariance.
For pure animals , the following mixed model was used:
Yij =µ+ Pi(Rk)+ Gi+ Sj+Rk+β(Xijk- X...) + eijk
Yij: traits observed (lean meat percentage [LMP];
backfat thickness [BT]; ham, loin, shoulder and belly weights; water retention ability [WRA]; texture; L, A and B colors; intramuscular fat) in ithgenotype and jthsex.
µ: sum of least square means.
Pi(Rk): sire within race as random effect.
Gi: genotype with i value 1 or 2: 1 = TT and 2 = TC.
Sj: sex with j value 1 or 2: 1 = male and 2= female.
Rk: race with K value 1, 2or 3: 1 = Pietrain, 2= Large
White and 3 = Landrace.
eij: random error with normal distribution, and
inde-pendently distributed with zero mean andσ2variance. Carcass weight was used ascovariance.
In Landrace females and Large White males, EPD es-timates (DWG, BT and LS) were used, obtained by a com-plete animal model under BLUP.
Yi =µ+ Gi+ ei
Yijk: observation of traits (EPD DWG, EPD BT or
EPD LS) in ithgenotype.
µ: sum of square means.
Gi: genotype with i value 1 or 2: 1 = TT and 2 = TC.
ei: random error with normal distribution, and
inde-pendently distributed with zero mean andσ2variance.
Results and Discussion
DNA bands observed were according to Stratilet al.
(1997).
The genotyping observed in Figure 1 demonstrates the two most common genotypes: TT (only one 152bp band) and TC (3 bands; 152, 68 and 84 bp, respectively).
Allele frequencies
The respective frequencies of alleles T and C in dif-ferent races were: 0.8142and 0.1857 (Landrace); 0.9125 and 0.0875 (Large White); 0.9433 and 0.0566 (Pietrain); 0.8333 and 0.1666 (LWXLDXPI); 0.2500 and 0.7500
(Piau); 0.8750 and 0.1250 (Monteiro); 0.8870 and 0.1130 (unknown race). The highest frequency of allele C was found in Piau, a Brazilian race with a strong tendency to ac-cumulate fat (Cavalcanti, 1984), suggesting that this allele could be associated with fat accumulation.
Frequencies found by Stratilet al.(1997) were simi-lar to those found in this work for Landrace, Large White and Pietrain.
The Landrace sample included animals of different generations; therefore, we separated the frequencies of the two generations (great-grandparent and male grandparent), to determine if this difference was due to selection. Chi-square data showed a significantly higher frequency for allele C in the grandparent generation, suggesting that this allele had been eliminated from the great- grandparent generation through selection.
Crossbred animals
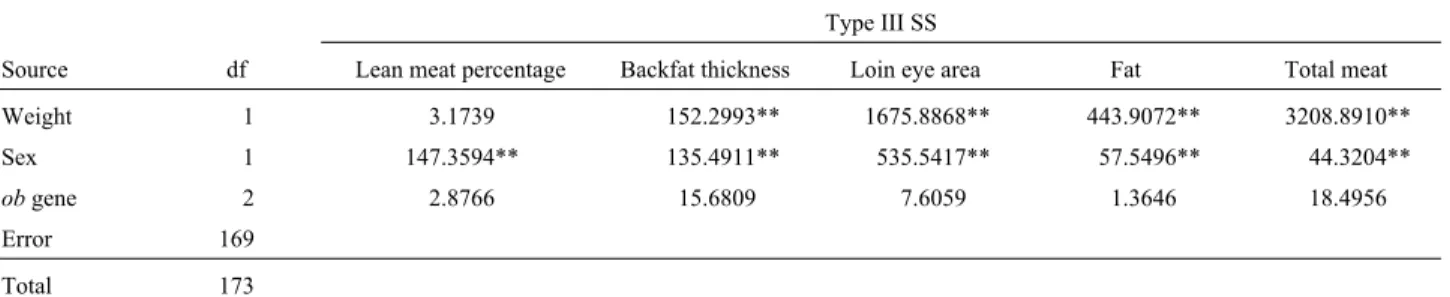
The values for type III sum of squares and least square means obtained in the variance analysis for carcass evaluation traits are presented in Tables II, III and IV, re-spectively.
Sex was statistically significant for all traits, but car-cass weight did not influence the lean meat percentage, findings similar to the results obtained by Antunes (1997). The obesity gene did not influence any crossbred car-cass evaluation data.
Females showed results suggesting better carcass quality than castrate males, since the loin eye area was sig-nificantly bigger and the backfat thickness and fat signifi-cantly lower (p < 0,01) than in males. Meat amount and percentage in females were also significantly higher, as shown by Antunes (1997), Elliset al., (1996) and Elizondo
et al., (1976).
Purebred animals
The values for type III sum of squares obtained in the variance analysis for carcass evaluation and meat quality traits are presented in Tables V and VI.
In the carcass evaluation traits, the obesity gene had a significant effect on shoulder weight and meat quality (tex-ture). For other traits, there was no significant effect of the gene, similarly to the results obtained by Hardje et al.
(1998) for the backfat thickness trait. Using the same pair of primers in Pietrain, Landrace and Large White, these au-thors did not find any significant difference in backfat.
Weight had a significant influence on every carcass evaluation trait, except lean meat percentage (LMP). Re-garding meat quality traits, it influenced only the water re-tention ability measured by drip loss.
Race had a significant effect on all carcass evaluation traits, as well as on meat quality traits, such as: drip loss, B color (yellowness) and intramuscular fat.
Sex also significantly influenced all carcass evalua-tion traits, except lean meat percentage and belly weight. As for meat quality traits, it influenced drip loss, L color (lightness) and B color.
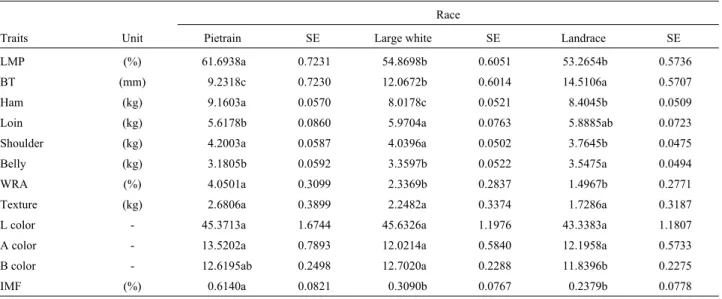
Least square means of statistically significant traits for genotype, race and sex effects are presented in Tables VII, VIII and IX, respectively.
Considering genotype effects, for both shoulder weight and meat texture higher values were found in the
Weight 1 3.1739 152.2993** 1675.8868** 443.9072** 3208.8910**
Sex 1 147.3594** 135.4911** 535.5417** 57.5496** 44.3204**
obgene 22.8766 15.6809 7.6059 1.3646 18.4956
Error 169
Total 173
**Statistically significant at 1% Carcass weight was used ascovariance.
Table III- Least square means of traits by sex effect and the probability of significance for F test in crossbred animals.
Sex
Trait Unit F M P > F
Lean meat percentage (%) 61.4841 59.5835 0.0001
Backfat thickness (mm) 14.1973 16.0198 0.0002
Loin eye area (cm2) 46.1453 42.5220 0.0001
Fat (kg) 10.2172 11.4049 0.0001
Total meat (kg) 41.7193 40.6770 0.0015
Table IV- Least square means of traits by genotype effect in crossbred an-imals.
obGenotype
Trait Unit TT TC CC
Lean meat percentage (%) 60.8445 60.6948 60.0621
Backfat thickness (mm) 14.388214.5347 16.4027
Loin eye area (cm2) 44.317243.9014 44.7822
Fat (kg) 10.6048 10.6253 11.2030
Total meat (kg) 41.7253 41.0420 40.8271
Table V- Variance analysis of carcass evaluation traits (LMP - lean meat percentage; BT - backfat thickness at P2; ham, loin, shoulder and belly weights), and meat quality traits (WRA - water retention ability; texture; L, A and B colors) by weight, sex and obesity genotype effects in purebred ani-mals.
Type III SS
Source df LMP BT Ham Loin Shoulder Belly WRA Texture L color A color B color
Weight 1 0.00 12.37** 659.47** 259.65** 217.96** 235.84** 10.99** 1.29 0.05 0.00 0.08
Race 2 42.59** 15.58** 127.40** 5.36* 16.80** 10.59** 17.94** 1.71 1.05 1.29 4.19*
Sex 1 0.67 13.38** 18.71** 12.67** 27.67** 0.02 13.14** 3.90 13.86** 1.93 10.44**
obgene 1 0.83 0.36 0.01 0.17 6.67* 2.66 0.04 4.80* 1.31 1.53 0.04
Error 63a
Total 68b
a= For race effect means 17. b
heterozygote (TC) than in the homozygote (TT); however, no race or sex effects were found for these traits. Higher shoulder weight was accompanied by a lower belly weight, indicating better carcass quality. On the other hand, a higher texture value may indicate worse meat quality for the genotype with allele C, since greater texture means tougher meat with less consumer value. These results are similar to those described by Upnmoor (1997) and Sellier (1995), emphasizing a significant negative correlation be-tween meat quantity and quality,i.e., the higher the per-centage of meat, the worse its quality. This conclusion is supported by Woodet al.(1986), who found less juice in leaner animals.
The Pietrain race presented the highest lean meat per-centage, ham and shoulder weight (similar to Large White), drip loss, and intramuscular fat. The Large White race pre-sented the greatest loin weight (similar to Landrace) and B color (similar to Pietrain); and the Landrace breed had the greatest backfat thickness and belly weight. These results
are in accordance with Franco’s (1999) regarding lean meat percentage and ham and shoulder weight in Pietrain.
Since all meats underwent the same treatment, and yet the Large White and Pietrain races presented greater B color values, which means yellowness or oxidated myo-globin, this may suggest that they have a lower bench life than the Landrace meat.
The Pietrain race presented a higher intramuscular fat value than the other races, meaning greater juiciness and better taste, as previously noted by Upnmoor (1997).
The Landrace breed presented a thicker carcass backfat layer, and a tendency to bigger belly weight, ac-companied by a lesser carcass quality.
Table VI- Variance analysis of meat quality trait: intramuscular fat (IMF) by weight, race, sex and obesity genotype effects, in purebred animals.
Type III SS
Source df IMF
Weight 1 0.05
Race 1 5.62*
Sex 1 0.54
obgene 20.78
Error 36a
Total 41b
a= For race effect means 13. b
= For race effect means 18.
Table VII- Least square means of the traits, standard error values and sig-nificance probability of each trait by genotype effect, in purebred animals.
obGenotype
Traits Unit TT Standard error
TC Standard error
P > F
LMP (%) 56.8895 0.3711 56.3297 0.5759 0.3647
BT (mm) 12.1169 0.3697 11.7562 0.5694 0.5517
Ham (kg) 8.5251 0.0316 8.5300 0.0580 0.9438
Loin (kg) 5.8074 0.0459 5.8437 0.0777 0.6802
Shoulder (kg) 3.9330 0.0305 4.0699 0.0488 0.0121
Belly (kg) 3.4107 0.0315 3.3145 0.0527 0.1080
WRA (%) 2.5928 0.1722 2.6630 0.3156 0.8508
Texture (kg) 1.8201 0.2044 2.6182 0.3319 0.0322
L color - 45.2864 0.7940 44.2750 1.0170 0.2572
A color - 12.2806 0.3802 12.8777 0.5161 0.2207
B color - 12.3567 0.1386 12.4174 0.2589 0.8417
IMF (%) 0.4279 0.0517 0.3460 0.0745 0.3815
Table VIII- Least square means (of traits) and standard error (SE) values by race effect in purebred animals (equal letters at the horizontal mean absence of significant effect).
Race
Traits Unit Pietrain SE Large white SE Landrace SE
LMP (%) 61.6938a 0.7231 54.8698b 0.6051 53.2654b 0.5736
BT (mm) 9.2318c 0.7230 12.0672b 0.6014 14.5106a 0.5707
Ham (kg) 9.1603a 0.0570 8.0178c 0.0521 8.4045b 0.0509
Loin (kg) 5.6178b 0.0860 5.9704a 0.0763 5.8885ab 0.0723
Shoulder (kg) 4.2003a 0.0587 4.0396a 0.0502 3.7645b 0.0475
Belly (kg) 3.1805b 0.05923.3597b 0.05223.5475a 0.0494
WRA (%) 4.0501a 0.3099 2.3369b 0.2837 1.4967b 0.2771
Texture (kg) 2.6806a 0.3899 2.2482a 0.3374 1.7286a 0.3187
L color - 45.3713a 1.6744 45.6326a 1.1976 43.3383a 1.1807
A color - 13.5202a 0.7893 12.0214a 0.5840 12.1958a 0.5733
B color - 12.6195ab 0.2498 12.7020a 0.2288 11.8396b 0.2275
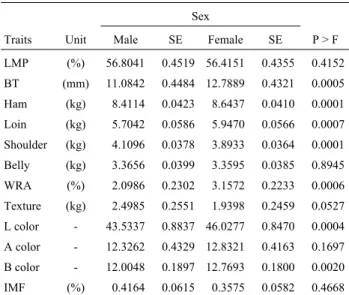
The uncastrated male had the highest shoulder weight, and the female the biggest backfat thickness, ham and loin weight, as shown by Franco (1999) and Antunes (1997) (the latter only for ham and loin weight). Regarding meat quality, females presented greatest drip loss and L and B color values, meaning a worse meat quality as compared to the uncastrated male, and resulting in pale, yellow meat, similar to PSE meat rejected by consumers (Soares et al.,1998). As for carcass evaluation traits, the females pre-sented the highest ham and loin values, which are, of course, desirable from the industrial point of view.
Expected progeny differences x obese genotyping
The statistical parameters of the comparison between genotype and EPD data and the variance analysis of fifty-four Landrace females and forty-nine Large White males, along with the EPDs, are presented in Tables X and XI, respectively.
The obesity genotype did not influence any traits. These results confirm those obtained by Hardje et al.
(1998) on the correlation between the obesity genotype with daily gain, backfat, feed efficiency and meat pH, where the authors found no significant differences in nei-ther of the Landrace, Large White and Pietrain races.
The means of the EPD traits across genotypes for Landrace females and Large White males are presented in Table XII.
We concluded that allele C may be associated with fat accumulation, due to its highest frequency in the Piau race. The obesity gene did not influence any of the carcass evalu-ation traits of the crossbred animals, but in purebred ani-mals it influenced shoulder weight and meat texture, whereas the TC genotype was associated with highest meat
productivity and worst meat quality. In Large White males and Landrace females, the obesity gene did not influence any EPD trait (daily weight gain, backfat thickness, and lit-ter size).
Acknowledgments
This study was supported by grants from CNPq. We thank Granja Rezende for providing blood samples and ani-mal data.
References
Antunes RC (1997) O efeito do genótipo HAL sobre o rendimento de carne em partes da carcaça de suínos cruzados. Tese de Mestrado. Pós-Graduação em Genética e Bioquímica. Uni-versidade Federal de Uberlândia.
Barinaga M (1996) Researchers nail down leptin receptor. Sci-ence 271:913-1996.
Bidwell CA, Ji S, Frank GR, Cornelius SG and Willis GM (1997) Cloning and expression of the porcine obese gene. Animal Biotechnology 8:191-206.
Cavalcanti SS (1984) Produção de suínos. Instituto Campineiro de Ensino Agrícola (ICEA) Gráfica e Editora Ltda, Campinas.
Traits Unit Male SE Female SE P > F
LMP (%) 56.8041 0.4519 56.4151 0.4355 0.4152
BT (mm) 11.0842 0.4484 12.7889 0.4321 0.0005
Ham (kg) 8.4114 0.0423 8.6437 0.0410 0.0001
Loin (kg) 5.70420.0586 5.9470 0.0566 0.0007
Shoulder (kg) 4.1096 0.0378 3.8933 0.0364 0.0001
Belly (kg) 3.3656 0.0399 3.3595 0.0385 0.8945
WRA (%) 2.0986 0.2302 3.1572 0.2233 0.0006
Texture (kg) 2.4985 0.2551 1.9398 0.2459 0.0527
L color - 43.5337 0.8837 46.0277 0.8470 0.0004
A color - 12.3262 0.4329 12.8321 0.4163 0.1697
B color - 12.0048 0.1897 12.7693 0.1800 0.0020
IMF (%) 0.4164 0.0615 0.3575 0.05820.4668
Source GD EPD DWG EPD BT EPD LS
obgene 1 90.7088 0.0404 0.0276
Error 52
Total 53
Table XI- Variance analysis of EPD (expected progeny differences) traits for daily weight gain (DWG), backfat thickness (BT) and litter size (LS) by obesity genotype effect in Large White males.
Type III SS
Source GD EPD DWG EPD BT EPD LS
obgene 1 385.1326 0.0441 0.01692
Error 47
Total 48
Table XII- Least square means of EPD daily weight gain (DWG), backfat thickness (BT) and litter size (LS) for obesity genotype effect in Landrace females and Large White males.
LD female LW male
Traits TT TC TT TC
EPD DWG 23.0140 25.6517 37.9692 30.3840
EPD BT -0.1143 -0.1700 -0.2124 -0.2936
Cusin I, Sainsbury A, Doyle P, Rohner-Jeanrenaud F and Jeanrenaud B (1995) Theobgene and insulin. A relationship leading to clues to the understanding of obesity. Diabetes 44:1467-1470.
Elizondo G, Addis PB, Rempel WE, Madero C, Martin F, Ander-son DB and Marple DN (1976) Stress response and muscle properties in Pietrain (P), Minnesota no. 1 (M) and PXM Pigs. Journal of Animal Science 43:1004-1014.
Ellis M, Webb A, Avery PJ and Browmn I (1996) The influence of terminal sire genotype, sex, slaughter weight, feeding regime and slaughter-house on growth performance, and carcass and meat quality in pigs, and on the organoleptic properties of fresh pork. Animal Science 62:521-530.
Felicio PED (1986) ABC do PSE/DFD. Alimentos e Tecnologia.
Franco MM (1999) Estudo da relação do polimorfismo dos genes Hal e GH com características de carcaça e qualidade da carne em 3 raças de suínos. Tese de Mestrado. Pós-Gra-duação em Genética e Bioquímica. Universidade Federal de Uberlândia.
Friedman JM (1997) The alphabet of weight control. Nature 385:119-120.
Hardje T, Kopke K, Wimmers K and Leuthold G (1998) Associa-tion between polymorphism of the leptin gene (LEP) and performance traits in a porcine resource family and in com-mercial outbred populations. Animal Genetics 29:60-74.
Houseknecht KL, Baile CA, Matteri RL and Spurlock ME (1998) The Biology of Leptin: A Review. Journal of Animal Sci-ence 76:1405-1420.
Pelleymounter MA, Cullen MJ, Baker MB, Hetch R, Winters D, Boone T and Collins, F (1995) Effects of the obese gene product on body weight regulation in ob/ob mice. Science 269:540-543.
Ramsay TG, Yan X and Morrison C (1998) The obesity gene in swine: sequence and expression of porcine leptin. Journal of Animal Science 76:484-490.
SAS User’s Guide (1996) Statistical Analysis Systems.
Sellier P (1995) Genetics of pork quality. Resumos: 1-35. I Confe-rência Internacional sobre Ciência e Tecnologia de Produ-ção e IndustrializaProdu-ção de Suínos. Campinas, Brasil. Soares Al, Ida EI, Olivo R and Shimokomaki M (1998) Benefícios
da utilização da vitamina E na dieta dos animais para o controle da cor e rancidez das carnes. Revista Nacional da Carne 259:18-22.
Stratil A, Peelman LJ, Vanpoucke M and Cepica S (1997) A HinfI PCR-RFLP at the porcine leptin (LEP) gene. Animal Genet-ics 28:370-383.
Upnmoor, I (1997) Marmorização da carne suína. Suinocultura Industrial 127:30-32.
Visscher PM and Haley CS (1998) Strategies for marker-assisted selection in pig breeding programmes. Proc. 6th World Congr. Genet. Appl. Livestock Prod. 23:503-510.
Wood JD, Jones RCD, Francombe MA and Whelehan OP (1986) The effects of fat thickness and sex on pig meat quality with special reference to the problems associated with overlean-ness. Animal Production 43:535-544.