Printed version ISSN 0001-3765 / Online version ISSN 1678-2690 http://dx.doi.org/10.1590/0001-3765201820150567
www.scielo.br/aabc | www.fb.com/aabcjournal
Changes in adipose cells of
Longissimus dorsi
muscle in
Iberian pigs raised under extensive conditions
DOLORES AYUSO1
, ANA GONZÁLEZ2
, FRANCISCO PEÑA2
and MERCEDES IZQUIERDO1
1Departament of Animal Production, Centro de Investigaciones Científicas y Tecnológicas de Extremadura/CICYTEX, Ctra. A-V, Km 372, 06187 Guadajira, Badajoz, Spain 2Department of Animal Production, University of Córdoba, Campus Rabanales,
Ctra. Madrid, Km 496, 14071 Córdoba, Andalusia, Spain
Manuscript received on July 27, 2015; accepted for publication on March 1, 2016
ABSTRACT
Twenty-four Iberian castrated male pigs were used to characterize and evaluate the effect of the duration of “Montanera” in the adipocytes size and its relation with the backfat thickness and intramuscular fat. The
animals were fed under extensive conditions during 30, 60 and 90 days in the “Dehesa” before slaughtered. Carcass weight, percentage of intramuscular fat, thickness of backfat and its three layers and adipocytes
size of the intramuscular fat were obtained. The group which expended 90 days on fattening obtained the highest adipocytes, with an area higher by a 50% than those that only expended 30 days. The differences in diameter and perimeter adipocyte were not as marked as area. A significant positive correlation between the diameter, area and perimeter of adipocyte with the backfat thickness were found. The fat cells in Iberian pig hypertrophy during the “montanera stage”, being this increase significant from month to month in this period of fattening. Also, this adipocyte increase is correlated with the animal weight. The
correlation between adipocyte size and inner layer of backfat shows that the inner layer obtained in live pig
by ultrasound techniques could be a good marker of fat infiltration in pigs fattening in “montanera” system.
Key words: extensive, adipocyte, backfat thickness, intramuscular fat.
Correspondence to: Dolores Ayuso Carrizosa E-mail: [email protected]
INTRODUCTION
Traditionally, the Iberian pig is raised under
extensive system being fed with natural resources,
acorns and grass, during the final fattening phase, called “Montanera”. This stage occurs from
October to March and there is a high weight gain and fat accumulation at intramuscular and dorsal
level. This type of feeding, along with genetic
factors and processing conditions of the products
is responsible for the high quality of meat and meat products of the Iberian pig.
The traditional food system in the management
seems to be influencing the quality of Iberian
pig products (Ventanas et al. 2005). Besides the
agro-silvo-pastoral system in which the Iberian pig breeding has a positive image for consumers to be associated with increased animal welfare, environmental impact reduction and protection of
to be one of the main objectives in improving pig production. Factors such as the size of the adipocyte (Etherton 1980, Hausman et al. 1983, Mersmann 1986) have been studied because it could explain
the differences between lean and fatty pigs.
The development of adipose depots occur in three phases; the first one is characterized by
a hyperplasia between 1 and 2 months old; the second one, between 2 and 5 months old, is based in both hyperplasia and hypertrophy; and in the last phase hypertrophy (Anderson et al. 1972, Henry 1977, Hood and Allen 1977).
Currently sufficient studies are made of the influence of type of feeding on carcass characteristics of Iberian pig, but there are few
studies that examine as influences the duration of
the Montanera in adipose tissue. Furthermore, while foreign breeds, mainly with a low-fat (Azain 2004, Domeneghini et al. 2006, Barnes et al. 2012) and high-fat (Hauser et al. 1997, Alfonso et al. 2005, Zhao et al. 2009, Nakajima et al. 2011) accumulation
in their tissues, have been sufficiently studied as the
fat of food is relationship with the adipocytes size of pigs. However, this fact has not been studied in
Iberian pig. The difference in adipocyte size among
breeds lean and fat, being higher in latter, is due to
the genetic control of fat cells and affected by the
backfat thickness (Nakajima et al. 2011), or a slow
differentiation or lipid filling of adipose tissue cell
in obese pigs, or to a later commitment to adipose
differentiation (Hauser et al. 1997).
The feeding with food enriched in fat produces
changes in performance as reducer intake,
improved gain and feed efficiency and increases carcass fat (Azain 2004). This increase in carcass
fat is correlated positively with the increase of
adipocyte size (Steffen et al. 1978).
Therefore, the aim of this work is to characterize and evaluate the effect of the duration
of “Montanera” in the adipocytes size in the Iberian pig and its relation with the backfat thickness and intramuscular fat.
MATERIALS AND METHODS
DATA COLLECTION
Twenty-four Iberian castrated male pigs of the Valdesequera line (“Valdesequera”, Badajoz,
Extremadura, Spain) progeny of four boars and twenty sows (two to three full siblings per litter) were used. Animals were randomly distributed into
three groups of eight pigs each. The animals were
fed under extensive conditions with acorn and grass during 30 (M30), 60 (M60), and 90 (M90) days in the
“Dehesa” before slaughtered. The animals were
slaughtered with 463 ± 3 days of age, 484 ± 2 days of age and 504 ± 2 days of age for M30, M60 and M90
groups, respectively. The initial body weight (BW)
was 128.88 ± 5.46 kg, 129.25 ± 4.83 kg and 128.38 ± 5.63 kg, for M30, M60 and M90, respectively. Pigs were slaughtered at the pre-planned age (at 30, 60
and 90 days of fattening) and the final BW was
157.56 ± 6.40 kg for M30, 190.38 ± 5.01 kg for M60 and 225.63 ± 16.12 kg for M90.
CARCASS TRAITS
The carcass measurements as carcass weight,
percentage of intramuscular fat and backfat thickness and its three layers were taken at the
slaughterhouse. The traits of backfat were taken at two levels, tenth and fifteenth rib. For this purpose
from each carcass a half portion of loin containing four chops (spanning from the 11th to the 14th ribs)
was extracted, chilled and used to measure the total backfat thickness and its layers at the two
already mentioned rib locations. The intramuscular fat content was quantified according the method
described by Folch et al. (1957).
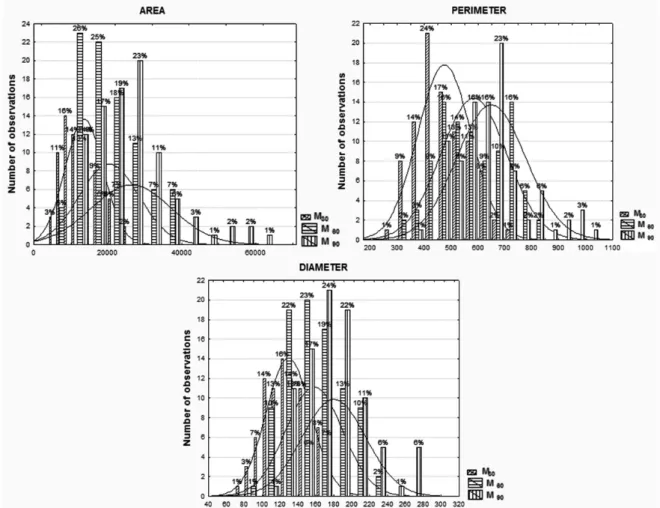
ADIPOCYTE TRAITS
Adipocytes size (area, diameter and perimeter) of the intramuscular fat of Longissimus dorsi muscle
in addition to observe also the intramuscular fat content was consistent with increase of adipocytes
size (Table I). The M90 group obtained the highest adipocytes, with an area higher by a 50% than M30 group (26252.38 vs. 13693.49 μm2). In the case of adipocyte diameter and perimeter the
differences were not as marked as area, because
it only increased by 26% between acorn-fed for three months and for a month (179.37 vs. 129.65
μm and 647.57 vs. 476.13 μm, respectively). Our
results were higher than those obtained by Etherton and Allen (1979), Herpin et al. (1993), Smith et al. (1996), Hauser et al. (1997), Nünberg et al. (1998), Mourot (2001), Alfonso et al. (2005), Damon et al.
(2006), Gardan et al. (2008), Zhao et al. (2009), Jiang et al. (2014), Szabó et al. (2010), Barnes et
al. (2012), both in lean and obese breeds. Also, Nürnberget et al. (1998) affirmed that the rapid adipose tissue growth in pigs with 100-180 days of age is followed by a phase where adipocyte growth is minimal (180-220 days of age). In our case the pigs had more age (around one year) and there are no studies about growth of adipocyte in Iberian pigs, but if taken account studies in obese breeds as
Meishan, shows that the growth in first months is
more rapid than other months (Hauser et al. 1997). In relation to the results obtained in commercial
pig breeds, differences could be due to the weight of sacrifice (higher in our case) (Mourot 2001),
as well as the genetics of the breed (Herpin et al.
1993, Hauser et al. 1997, Wood et al. 2004, Alfonso
et al. 2005, Poulos and Hausman 2005).
The 45% of the adipocytes had an area situated in the range of 9000 to 15000 μm2 in M
30 group, of
15000 to 27000 μm2
in M60 group and of 21000 to
33000 μm2 in M
90 group. In the case of perimeter
in the range of 400 to 500 μm are the 41% of the
adipocytes measured in the M30 group, of 600 to
800 μm in M60 group, and of 600 to 700 μm in M90
group. In the last case, the diameter, the 55% of
adipocytes range from 100 to 140 μm in M30 group,
from 100 to 160 μm in M60 group and from 160 selected and placed in liquid nitrogen. After that,
the samples were embedded in OCT medium and stored at -80 °C until further cutting. The sections of
20 micron thick, collected on slides with intervals between each cut 300 microns were performed
using a Leica CM1900 cryostat. The sections were fixed in a solution of 2.5% glutaraldehyde in PBS
for 10 min, washed with PBS and then applied Oil
Red O staining described by Lillie and Ashburn
(1943). Using a digital camera coupled to a microscope Nikon Eclipse 90i photomicrographs were taken subsequently and analyzed by image
analysis program (NIS-Elements RA). In each
photograph the area, diameter and circumference of 1-12 adipocytes for each animal were obtained.
STATISTICAL ANALYSIS
The effect of the duration of fattening system called
“Montanera” on the productive results, carcass traits and adipocytes size were studied by means
of an analysis of covariance, using GLM procedure of Statistica 8.0 for windows. HSD Tukey´s test
was applied to compare the mean values. Mean
values with standard deviation are reported. The
correlations between carcass and adipocyte traits
were investigated by Pearson´s correlation analysis.
Frequencies for adipocyte traits were obtained and represented graphically.
RESULTS AND DISCUSSION
Fat cells from adipose tissue of white pigs are closely studied by several groups of authors (Cagnazzo et
al. 2006, Wimmers et al. 2007, Zheng and Mei
2009) that concluded that adipocyte size increases with live weight of animals. Other authors argue that the variation of the content of intramuscular and subcutaneous fat is closely related to changes
in the size of adipocytes (Gondret and Lebret
to 220 μm in M90 group (Fig. 1). The increase in
adipocyte diameter is caused by the deposition of
fat (Nürnberg and Wegner 1990).
Consistent with previous studies (Gondret and Lebret 2002, Alfonso et al. 2005, Velotto et al. 2012), a significant positive correlation between
the diameter, area and perimeter of adipocyte
with the backfat thickness were found (Table II), specifically with the inner layer taken at the 15th
rib
(0.42, 0.40 and 0.36, respectively). This correlation
could be due to, and according with Fortin (1986),
Geri et al. (1986), Barone et al. (2000) and Velotto
et al. (2012), the adipocytes from inner layer are larger than the outer layer. Also, this inner layer of backfat (IBF15) has the most increase in size over “montanera” period of fattening, especially in
the last section of fattening (Table I). In previous
studies Ayuso et al. (2013) obtained a positive correlation between the inner layer thickness of backfat and intramuscular fat both in the carcass
and in vivo by ultrasound methods (0.47 and 0.40,
respectively). The greater adipocyte size is the
major contributing factor in the greater increase on backfat tissue in obese pigs (Nakajima et al. 2011).
There were significant differences in the amount
of intramuscular fat during the fattening phase on
“montanera” system. These differences appear to be
due to an adipocyte hypertrophy and the increased size of these cells are positively correlated with the weight gain, intramuscular fat and the inner layer thickness of backfat at the 15th rib level. The animals that spent 90 days on this system had higher
deposits of intramuscular fat. The flavor, juiciness
and tenderness of meat is variable and depends on fat content of meat (Fernandez et al. 1999, Brewer
et al. 2001, Wood et al. 2004, Lonergan et al. 2007), due to this a specific development of intramuscular
fat deposits is necessary (Hauser et al. 1997).
Therefore, the animals that spend 90 days in
fattening must present those carcasses with better organoleptic features. Zhao et al. (2009) suggested that fat pig breeds posses higher capacity to deposit TABLE I
Effects of duration of fattening period (D) on carcass1.
and adipocyte traits.
Duration of fattening2.
P values
M30 M60 M90
Mean Std. Mean Std. Mean Std.
Body weight at start, kg 128.9b
5.5 129.2b
4.8 128.4b
5.6 0.95
Body weight at slaughter, kg 157.6a
6.4 190.4b
5.0 225.6c
16.1 0.00
Carcass weight, kg 119.6b
4.6 163.0c
6.5 193.1d
13.3 0.00
IFAT, g/100g 2.74a
1.25 4.72b
1.41 6.22b
2.45 ≤ 0.01
BF10, mm 7.26a
0.75 9.90b
0.43 10.94b
1.98 ≤ 0.01
OBF10, mm 1.57a
0.23 2.00b
0.25 1.87b
0.34 ≤ 0.01
MBF10, mm 4.20a
0.57 5.55b
0.24 6.14b
0.93 ≤ 0.01
IBF10, mm 1.48a
0.26 2.35b
0.24 2.92b
0.95 ≤ 0.01
BF15, mm 5.60a
1.04 7.63b
0.84 9.56c
1.14 ≤ 0.01
OBF15, mm 1.25a
0.29 1.59b
0.27 1.62b
0.20 ≤ 0.05
MBF15, mm 2.51a
0.61 3.62b
0.45 3.92b
0.63 ≤ 0.01
IBF15, mm 1.84a
0.42 2.42a
0.63 4.01b
0.77 ≤ 0.01
Area, μm2
13693.49a
3085.12 20273.92ab
5558.03 26252.38b
8429.56 ≤ 0.01
Perimeter, μm 476.1a
57.3 582.8ab
95.4 647.6b
95.8 ≤ 0.01
Diameter, μm 129.6a
15.0 157.6ab
22.7 179.4b
26.9 ≤ 0.01
1.IFAT: Intramuscular fat; BF10: Backfat thickness at tenth rib level; OBF10: Backfat thickness of outer layer at tenth rib level; MBF10: Backfat thickness of middle layer at tenth rib level; IBF10: Backfat thickness of inner layer at tenth rib level; BF15: Backfat thickness at fiftieth rib level; OBF15: Backfat thickness of outer layer at fiftieth rib level; MBF15: Backfat thickness of middle layer at fiftieth rib level; IBF15: Backfat thickness of inner layer at fiftieth rib level.
2.
TABLE II Relationship between carcass traits1.
and adipocyte traits.
IFAT BF10 OBF10 MBF10 IBF10 BF15 OBF15 MBF15 IBF15
Area, μm 0.07 0.12 -0.01 0.21* 0.03 0.29* 0.08 0.05 0.40*
Perimeter, μm 0.14* 0.12 -0.00 0.21* 0.03 0.31* 0.10 0.10 0.36*
Diameter, μm 0.11 0.17* -0.00 0.25* 0.08 0.33* 0.11 0.09 0.42*
1.IFAT: Intramuscular fat; BF10: Backfat thickness at tenth rib level; OBF10: Backfat thickness of outer layer at tenth rib level; MBF10: Backfat thickness of middle layer at tenth rib level; IBF10: Backfat thickness of inner layer at tenth rib level; BF15: Backfat thickness at fiftieth rib level; OBF15: Backfat thickness of outer layer at fiftieth rib level; MBF15: Backfat thickness of middle layer at fiftieth rib level; IBF15: Backfat thickness of inner layer at fiftieth rib level. * P ≤ 0.05.
Figure 1 - Frequencies of adipocyte size traits from Iberian pigs. M30 = Thirty days on fattening; M60 = Sixty days on fattening; M90 = Ninety days on fattening.
triacylglycerol in muscle deposit than lean pigs
because intramuscular fat content is higher in first
breeds (5.58 vs. 3.90%). Also, higher intramuscular pigs appear to be because this kind of this breed has a high capacity of lypogenesis and fatty acid transport, lower potential of fat mobilization and
fatty acid oxidation (Zhao et al. 2009). The increase
in fat in pigs is associated with the increase of
intramuscular fat adipose tissue. This increase is
attributable to the larger increase in intramuscular adipocyte size (Barnes et al. 2012).
CONCLUSIONS
The fat cells in Iberian pig hypertrophy during the “montanera stage”, being this increase significant
Also, this adipocyte increase is correlated with the animal weight. Prolong the final fattening in “montanera stage” up to 90 days in Iberian
pigs makes the marbling, and therefore the final
quality of the meat is significantly higher than those animals with 60 or 30 days on “montanera”
fattening and backfat is thicker. The correlation
between adipocyte size and inner layer of backfat at 15th ribs shows that the inner layer obtained in live pig by ultrasound techniques could be a
good marker of fat infiltration in pigs fattening in
“montanera” system.
REFERENCES
ALFONSO L, MOUROT J, INSAUSTI K, MENDIZABAL JA AND ARANA A. 2005. Comparative description of growth, fat deposition, carcass and meat quality characteristics of Basque and Large White pigs. Anim Res 54: 33-42.
A N D E R S O N D B , K A U F F M A N R G A N D KASTERSCHMIDT LL. 1972. Lipogenic enzyme activities and cellularity of porcine adipose tissue from various anatomical locations. J Lipid Res 13: 593-599. AYUSO D, GONZÁLEZ A, HERNÁNDEZ F, CORRAL
JM AND IZQUIERDO M. 2013. Prediction of carcass composition, hams and forelegs weights and yields of Iberian pigs by using ultrasound measurements in live animals. J Anim Sci 91: 1884-1892.
AZAIN MJ. 2004. Role of fatty acids in adipocyte growth and development. J Anim Sci 82: 916-924.
BARNES KM, WINSLOW NR, SHELTON AG, HLUSKO KC AND AZAIN MJ. 2012. Effect of dietary conjugated linoleic acid on marbling and intramuscular adipocytes in pork. J Anim Sci 90: 1142-1149.
BARONE CMA, ESPOSITO I, OCCIDENTE M, ABBATIELLO M, CAPPUCCIO A AND MATASSINO D. 2000. Some aspects of meat production in pig autochthonous genetic types. III. Morphometric characteristics of fibre types and adipocytes. In: Almeida JA and Tirapicos Nunes J (Eds), Tradition and innovation in Mediterranean pig production. Zaragoza: CIHEAM Options Méditerranéennes: Série A. Séminaires Méditerranéens 41: 233-236.
BREWER MS, ZHU LG AND MCKEITH FK. 2001. Marbling effects on quality characteristics of pork loin chops: Consumer purchase intent, visual and sensory characteristics. Meat Sci 59: 153-163.
CAGNAZZO M, TE PAS MF, PRIEM J, DE WIT AA, POOL MH, DAVOLI R AND RUSSO V. 2006. Comparison
of prenatal muscle tissue expression profiles of two pig breeds differing in muscle characteristics. J Anim Sci 84: 1-10.
DAMON M, LOUVEAU I, LEFAUCHEUR L, LEBRET B, VINCENT A, LEROY P, SANCHEZ MP, HERPIN P AND GONDRET F. 2006. Number of intramuscular adipocytes and fatty acid binding protein-4 content are significant indicators of intramuscular fat level in crossbred large white × Duroc pigs. J Anim Sci 84: 1083-1092.
DOMENEGHINI C, DI GIANCAMILLO A AND CORINO C. 2006. Conjugated linoleic acids (CLAs) and white adipose tissue: how both in vitro and in vivo studies tell the story of a relationship. Histol Histopathol 21: 663-672. ETHERTON TD. 1980. Subcutaneous adipose tissue cellularity of swine with different propensities for adipose tissue growth. Growth 44: 182-191.
ETHERTON TD AND ALLEN CE. 1979. Metabolic Responsiveness of Different Size Adipocytes to Fasting and Refeeding in the Pig. J Nutr 110: 1169-1175.
FERNANDEZ X, MONIN G, TALMANT A, MOUROT J AND LEBRET B. 1999. Influence of intramuscular fat content on the quality of pig meat-1, Composition of the lipid fraction and sensory characteristics of m. longissimus lumborum. Meat Sci 53: 59-65.
FOLCH J, LEES M AND SLOANE STANLEY GH. 1957. A simple method for the isolation and purification of total lipides from animal tissues. J Biolog Chem 226: 497-509. FORTIN A. 1986. Development of backfat and individual fat
layers in the pig and its relationship with carcass lean. Meat Sci 18: 255-270.
GARDAN D, GONDRET F, VAN DEN MAAGDENBERG K, BUYSC N, DE SMETB S AND LOUVEAU I. 2008. Lipid metabolism and cellular features of skeletal muscle and subcutaneous adipose tissue in pigs differing in IGF-II genotype. Domest Anim Endocrinol 34: 45-53.
GERI G, ZAPPA A AND FRANCI O. 1986. Influenza dello sviluppo corporeo e della localizzazione sulla cellularità del tessuto adiposo nei suini. Zoot Nutr Anim 12: 9-24. GONDRET F AND LEBRET B. 2002. Feeding intensity
and dietary protein level affect adipocyte cellularity and lipogenic capacity of muscle homogenates in growing pigs, without modification of the expression of sterol regulatory element binding protein. J Anim Sci 80: 3184-3193. HAUSER N, MOUROT J, DE CLERCQ L, GENART C AND
REMACLE C. 1997. The cellularity of developing adipose tissues in Pietrain and Meishan pigs. Reprod Nutr Dev 37: 617-625.
HAUSMAN GJ, CAMPION DR AND THOMAS GB. 1983. Adipose tissue cellularity and histochemistry in fetal swine as affected by genetic selection for high or low backfat. J Lipid Res 24: 223-228.
la sèlection de I’alimentation et du mode d’e1evage. Ann Biol Anim Biochem Biophys 17: 923-952.
HERPIN P, LE DIVIDICH J AND AMARAL N. 1993. Effect of selection for lean tissue growth on body composition and physiological state of the pig at birth. J Anim Sci 71: 2645-2653.
HOOD RL AND ALLEN CE. 1977. Cellularity of porcine adipose tissue: effects of growth and adiposity. J Lipid Res 18: 275-284.
JIANG AA, LI MZ, LIU HF, BAI L, XIAO J AND LI XW. 2014. Higher expression of acyl-CoA dehydrogenase genes in adipose tissues of obese compared to lean pig breeds. Genet Mol Res 13: 1684-1689.
LILLIE RD AND ASHBURN LL. 1943. Supersaturated solutions of fat stains in dilute isopropanol for demonstration of acute fatty degeneration not shown by Herxheimer’s technique. Arch Pathol 36: 432-440. LONERGAN SM, STALDER KJ, HUFF-LONERGAN E,
KNIGHT TJ, GOODWIN RN, PRUSA KJ AND BEITZ DC. 2007. Influence of lipid content on pork sensory quality within pH classification. J Anim Sci 85: 1074-1079.
MERSMANN HJ. 1986. Postnatal expression of adipose tissue metabolic activity associated with a porcine genetic obesity. J Anim Sci 63: 741-746.
MOUROT J. 2001. Mise en place des tissus adipeux souscutanés et intramusculaires et facteurs de variation quantitatifs et qualitatifs chez le porc. INRA Prod Anim 14: 355-363.
NAKAJIMA I, OE M, OJIMA K, MUROYA S, SHIBATA M AND CHIKUNI K. 2011. Cellularity of developing subcutaneous adipose tissue in Landrace and Meishan pigs: Adipocyte size differences between two breeds. Anim Sci J 82: 144-149.
NÜRNBERG K AND WEGNER J. 1990. Fatty acid composition and adipocyte diameter of backfat in boars during growth. Arch Tierz 34: 51-56.
NÜRNBERG K, WEGNER J AND ENDER K. 1998. Factors influencing fat composition in muscle and adipose tissue of farm animals. Liv Prod Sci 56: 145-156.
POULOS S AND HAUSMAN G. 2005. Intramuscular adipocytes-potential to prevent lipotoxicity in skeletal muscle. Adipocytes 1: 79-94.
REY AI, DAZA A, CARRASCO C AND LÓPEZ-BOTE CJ. 2006. Feeding Iberian pigs with acorns and grass in either free-range or confinement affects the carcass characteristics and fatty acids and tocopherols accumulation in Longissimus dorsi muscle and backfat. Meat Sci 73: 66-74.
SMITH DR, KNABE DA AND SMITH SB. 1996. Depression of lipogenesis in swine adipose tissue by specific dietary fatty acids. J Anim Sci 74: 975-983.
STEFFEN DG, CHAI EY, BROWN LL AND MERSMANN HJ. 1978. Effects of diet on swine glyceride lipid metabolism. J Nutr 108: 911-918.
SZABÓ A, VISKI A, EGYHÁZI Z, HÁZAS Z, HORN P AND ROMVÁRI R. 2010. Comparison of Mangalica and Hungarian Large White pigs at identical bodyweight: 1. Backfat histology. Arch Tierz 53: 141-146.
VELOTTO S, VITALE C AND CRASTO A. 2012. Muscle fibre types, fat deposition and fatty acid profile of Casertana versus Large White pig. Anim Sci Pap Rep 30: 35-44.
VENTANAS S, VENTANAS J, RUIZ J AND ESTÉVEZ M. 2005. Iberian pigs for the development of high-quality cured products. In: Recent Developments in Agricultural and Food Chemistry, Singpost, Trivandrum, India, p. 27-53.
WIMMERS K ET AL. 2007. Associations of functional candidate genes derived from gene-expression profiles of prenatal porcine muscle tissue with meat quality and muscle deposition. Anim Genet 38: 474-484.
WOOD JD, NUTE GR, RICHARDSON RI, WHITTINGTON FM, SOUTHWOOD O, PLASTOW G, MANSBRIDGE R, DA COSTA N AND CHANG KC. 2004. Effects of breed diet and muscle on fat deposition and eating quality in pigs. Meat Sci 67: 651-667.
ZHAO SM, REN LJ, CHEN L, ZHANG X, CHENG ML, LI WZ, ZHANG YY AND GAO SZ. 2009. Differential expression of lipid metabolism related genes in porcine muscle tissue leading to different intramuscular fat deposition. Lipids 44: 1029-1037.