Elizabeth C. Mattos* Institute of Aeronautics and Space São José dos Campos - Brazil [email protected]
Milton Faria Diniz Institute of Aeronautics and Space São José dos Campos - Brazil [email protected]
Nanci M. Nakamura Institute of Aeronautics and Space São José dos Campos - Brazil [email protected]
Rita de Cássia L. Dutra Institute of Aeronautics and Space São José dos Campos - Brazil
* author for correspondence
Determination of polymer content
in energetic materials by FT-IR
Abstract: A new methodology was developed to characterize and to quantify the polymer content in PBX (HMX/Viton) by Fourier Transform Infrared Spectroscopy (FT-IR), using the Termogravimetric analysis (TG)
as reference techniques for the quantitative method. The quantiication
methodology, proposed by us, using the Fourier transform
infrared-attenuated total relectance (FT-IR/ATR) showed excellent results, being
faster than the usual methodologies and can eliminate the generation of chemical residues.
Keywords: Explosives, HMX, FT-IR, TG, ATR, Viton quantiication.
INTRODUCTION
The development of space programs, deep oil well drillings, etc., has projected a need for “heat resistant” or “thermally stable explosives”. The main objective for using such explosives or explosive formulations is to support systems or applications, which must be reliable and secure at high temperatures (Agrawal, 2005).
An appropriate military explosive needs to be secure and of easy manipulation. It can be stored over long periods
of time in different climates and dificult to detonation, at least under speciic circumstances (Mathieu, 2004). The
development of plastic bonded explosives (PBX) is a way to get more energy in less volume (Hayden, 2005).
PBX is an acronym for “Plastic Bonded Explosive”. A term applied for a variety of explosive mixtures, which is characterized by high mechanic resistance, good explosive properties excellent chemical stability, low sensitivity to the shock and manipulation and low sensitivity to thermal initiation (Federoff, 1966). A lot of the PBX’s have been developed since the middle of the last century, in general, resulting in
an engineering material for speciic or large scale
applications (Hayden, 2005; Kim, 1999). These explosive mixtures have a large content of secondary explosives such as cyclotrimethylene trinitramine (RDX), cyclotetramethylene tetranitramine (HMX), hexanitrostilbene (HNS) or pentaerythritol-tetranitrate (PETN) in a composition with a polymeric matrix such as polyester, polyurethane, nylon, polystyrene,
some rubbers, nitrocellulose and luor polymers. The
compatibility and the miscibility with other explosives, polymers, and additives must be evaluated before pressing, molding, extruding, etc., for manipulation safety and for storing the products (Mathieu, 2005; Hayden, 2005).
As the weapons can be placed in aggressive thermal and mechanical environments, it is important to characterize the properties of the PBX in order to know its physico-chemical behavior (Thompson, 2005; Kasprzyk, 1999).
A method to obtain an explosive load is by pressing the explosive covered by hydraulical press, which represents the most important process for high-performance explosive loading manufacture (Wanninger, 1996). As the explosive is obtained in crystal form, it is necessary to recover them with polymers, performed by a covering process.
Different methods employing several techniques have been developed to determine HMX contents (Mattos-a,
2004). High performance liquid chromatography (HPLC)
is used to investigate explosives to a large extent (Mattos,
2004). Although the HPLC method presents good results,
there are several steps related to the sample preparation or measurements that are quite time consuming. It is possible to apply the Thermogravimetric Analysis for the quantitative determination of different energetic compounds in explosive compositions, as reported by Silva et al. (2008). FT-IR techniques can be applied for the characterization of the polymeric composition in PBX (Mattos, 2008). In a previous publication (Mattos, 2008 and Mattos, 2009), a sample of HMX covered with Viton in different concentrations was analyzed by ATR
technique to obtain good quality spectra. In that speciic
case, the sample was kept in perfect physical contact
with the crystal surface (Mattos-b, 2004). Several steps
are eliminated and although the data of ATR methods
represent the average of ive analyses, the time spent in the analysis is less than the time spent in the HPLC method, as
demonstrated in another publication (Mattos, 2009).
The covering process and the characterization of energy materials in the crystal form or after getting covered by different polymers are important research studies performed in the Institute of Aeronautics and Space (IAE)
laboratories (Mattos-b, 2004; Mattos, 2002; Mattos, 2003).
Thus, the aim of this work is to show a new quantitative method for the determination of the HMX/Viton ratio based on FT-IR/ATR, using the TG data like reference.
The advantages of the methods here presented are the few steps involved and the fact they do not require complex sample preparation.
EXPERIMENTAL
Materials
Fluoroelastomers are generically referred to as FKM polymers
(nomenclature per ASTM D1418). Viton is a trademark of a luoroelastomers series manufactured by DuPont, which is
available in several formulations (copolymer, terpolymer) and forms (slab, stick, pellet) (Mattos, 2008; Hohmann, 2000). Fluoroelastomers are used in the covering of energetic materials. Viton shows excellent chemical stability, being a widely used polymer for energetic materials coating of propellants. The relationship between Viton and the oxidant
compounds has signiicant inluence in the oxidation time, as
cited in the literature (Hohmann, 2000).
HMX is also known as 1,3,5,7-tetranitro-1,3,5,7-
tetraza cyclo-octane, cycloteramethylene tetranitramine
(C4H8N8O8) or octogen. It is an important ingredient in
modern solid propellants due to its desirable properties,
such as absence of smoke, high speciic impulse and
thermal stability (Tang, 1999). It is used in certain
propellants and explosives (Kohno, 1994). Propellants
based on HMX can be found in armament applications and in solid rocket propulsion systems (Tang, 1999).
The speciic gravity of the crystals is 1.90 g/cm3 and
the melting point is around 280°C. HMX exists in 4
polymorphic forms (aHMX, bHMX, dHMX, gHMX). The
most common modiication, stable at room temperature, is
bHMX (United States-TM 9, 1979).
The HMX has been used in metal conformation, energy transference and in the composition of melting and pressing
plastic bonded explosives (Calzia, 1969; Urbanski, 1984).
The plastic covering of explosive grains for “slurry” in water is characterized by the migration of the explosive, where the transfer of the explosive occurs from one liquid phase to another, in a liquid system with two immiscible
phases (James, 1965; Benziger, 1973; Kneisl, 2003).
In the covering of HMX crystals by polymers, the explosive is dispersed in water (inorganic liquid phase) and the polymer dissolved in an organic solvent (organic liquid phase), the organic phase is usually called “lacquer”, which is a plastic dissolved in a low boiling point organic
solvent (James, 1965; Benziger, 1973; Kneisl, 2003).
The covering process starts with the dispersion of the energetic material in water (system with moderate agitation and heating). The hot lacquer is added to the system, due to the low solubility of the lacquer in the system, the agglutination of the plastic plates occurs in the explosive
crystals (James, 1965; Benziger, 1973; Kneisl, 2003).
The organic solvent is removed by means of the distillation process and then the formation of “pellets” occurs, due the agglutination between the polymer and the explosive
crystals (James, 1965; Benziger, 1973; Kneisl, 2003). It
is important to mention that the inorganic liquid phase (water) is very important for the security process, during the warming step of the system with explosive not yet covered and in the distillation step. It enables good temperature homogenization, preventing the system’s overheating
(Kim, 1999; James, 1965; Benziger, 1973; Kneisl, 2003).
Measuring methods
Thermogravimetric analyses were carried out in a TG/ SDTA Mettler model (Model TGA/SDTA851e), which
was calibrated in a heat ratio of 10 ºC/min, with aluminum and indium, under nitrogen gas low (40 mL/mim). About
2.0 mg of the sample was used and the heating range was
between 50 and 700ºC.
The FT-IR spectra were recorded using a Spectrum One
PerkinElmer. The conditions were: resolution 4 cm-1; gain 1;
range 4000 to 700 cm-1, 40 scans, germanium crystal as
reference material and incidence angle of 45°. The samples were analyzed by ATR germanium techniques. The sample was placed on both sides of the crystal to obtain a better spectrum.
RESULTS AND DISCUSSION
PBX samples with Viton and HMX was prepared (HMX/ Viton systems) with the following Viton content: 2, 5,
8, 10, 13 and 15%, in order to develop a quantitative
Table 1: HMX contents in the HMX/Viton samples obtained by TG
Code
Theoretical HMX/
Viton content
(%)
HMX contents
by TG (%)
Viton contents
by TG (%)
Standard deviation
(%)
01/06 98/2 97.87 2.13 0.68
01/95 95/5 95.24 4.76 0.25
05/06 92/8 93.67 6.33 0.93
04/06 90/10 91.10 8.90 1.06
06/06 87/13 89.88 10.12 0.79
02/06 85/15 89.98 10.02 1.06 Figure 1: TG and DTG curves of HMX sample in atmosphere
of N2
Figure 3: TG Curves of the system HMX/Viton sample in
atmosphere of N2 TG Analysis of HMX
HMX (class 3) was used to attain the polymeric coverings,
obtained in the SNPE (Société Nationale des Poudres et Explosifs), which shows the following thermal behavior in Fig. 1.
The Figure 3 clearly shows that the decomposition
stages of the PBX constituent are quite different and do
not inluence the decomposition process. The contents
It can be observed that the HMX undergoes a sudden thermal decomposition and maximum mass loss occurs at
around 285°C in relation to the DTG.
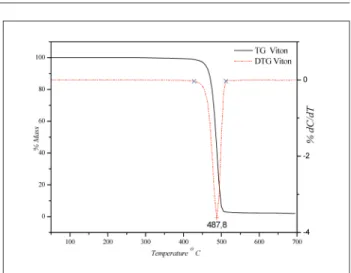
TG Analysis of VITON
To analyze the thermal behavior of Viton B, TG analyses were conducted. The thermal curve in Fig. 2 illustrates the thermal behavior of this polymer.
Observing Fig. 2 in comparison with Fig. 1, it is evident that the Viton decomposition takes place at a very high
temperature of the HMX, allowing for the quantiication
of both materials, when these are in the PBX. The Viton mass loss in relation to the DTG can be observed at the
temperature of 487.8 °C.
PBX characterization of PBX (HMX/Viton) by TG analyses
The samples cited in Table 1 for PBX (HMX/Viton) were analyzed by TG and Table 1 shows the results obtained. However the covering process with higher contents was
not so eficient, according to Table 1, for samples 06/06
and 02/06.
Figure 3 shows the thermal decomposition curves of PBX
(HMX/Viton).
of the constituents can then be determined by means of TG, when associating the nominal content with the percentage decomposition of each stage of mass loss observed.
FT-IR/ATR of HMX sample
The main absorptions observed in the HMX spectrum
FT-IR (Fig. 4), associates a probable attribution (Smith, 1979; Litch, 1970; Hummel, 1981; Bedard, 1962) are at 3035 cm-1 (n CH
2), 1564 cm -1 (n
a NO2), 1462, 1432,
1396 and 1347 (ds CH2), 1279 and 1202 cm -1 (n
s NO2
+ n N-N), 1145, 1087 and 964 cm-1 (n N-N + n ring),
946 cm-1 (ring stretching), 830 and 761 cm-1 (d and g
NO2). The observed bands are characteristic of b HMX,
according to the literature (Smith, 1979; Campbell,
2000; Achuthan, 1990).
ATR analysis of the HMX/Viton
The combination of the infrared spectroscopy with the
relection theories produced advances in the surface
analysis. The FT-IR/ATR technique combines the power of IR spectroscopy with the optics of the attenuated total
relection. The concept of internal relection spectroscopy
originates from the fact that radiation propagating in an optically dense medium of refractive index undergoes total
internal relection at an interface of an adjacent medium
of lower optical density. This wave is termed evanescent (Nogueira, 2000; Kwan 1998; PerkinElmer 2005).
This evanescent wave penetrates only a few microns (0,5µ - 5µ) beyond the crystal surface and into the sample.
Consequently, there must be good contact between the
sample and the surface of the crystal. In the infrared spectrum regions, where the sample absorbs the energy, the evanescent wave will be attenuated or altered. The attenuated energy from each evanescent wave is passed back to the IR beam, which presents the opposite end of the crystal and is passed to the detector in the IR spectrometer. The system then generates an infrared spectrum (PerkinElmer, 2005).
By ATR technique with germanium crystal, using sample in both sides of the crystal, characteristic spectra were obtained for the Viton and the PBX, as can be observed in the sets of spectra in Fig. 6.
The samples of the HMX/Viton system were analyzed using different FT-IR techniques. However, it was observed that using the FT-IR/ATR technique with Germanium crystal at
45º showed spectra with better resolution (Mattos, 2009).
As observed in the spectra of Figure 6, the spectrum of
the HMX/Viton (85/15%) sample presents characteristic
bands of Viton in 1169 cm-1 and 890 cm-1. In this way, the
best analytical band for the Viton is chosen.
All the covering samples (HMX/Viton) were analyzed
by ATR with Germanium crystal at 45°. Therefore, with
Figure 4: FT-IR/ATR spectrum in crystal germanium of HMX
FT-IR/ATR of Viton sample
The presence of C-F groups is detected in Mid-Infrared (MIR) (Mattos, 2008; Urbanski, 1977) on the basis of the intense absorptions in 1397 – 1074 cm-1 (nC-F) (Mattos,
2008; Smith, 1979). The characteristic bands of linking C-F2 are found in 1273, 1191, 1134 and 1111 cm
-1 (nC-F 2)
and 890 and 820 cm-1 (nC-F
3) (Mattos, 2008; Silverstein, 1981), of average intensity.
The ATR/FT-IR technique can be conducted with two different crystals (germanium and KRS-5). The ATR technique with germanium crystal (sample in both sides
of the crystal - 45°) shows good results, where it is
possible to see the changes in the characteristic bands of the polymer (nC-F, nC-F2 and nC-F3) as a function of
the polymer contents in the sample and good deinition
in the base line.
Figure 5 illustrates the characteristic spectrum for the Viton B sample.
observed that while the Viton concentration increases in the mixture, there is a widening in this region, indicating the presence of polymer in the energetic material composition
of HMX/Viton. The band at 945 cm-1 characteristic for the
HMX is also evidenced in this set of spectra. And while the Viton content increases, it is observed the reduction in the intensity of HMX band due the presence of the polymer.
Other characteristic Viton bands were chosen at 890 cm-1
and 1170 cm-1. For the HMX, the bands in 945 cm-1 and
1145 cm-1 can be observed. Since there are Viton bands
that increase the intensity with the polymer concentration
in the system, it was possible to initiate the quantiication of
these samples for FT-IR.
TG was used as reference for IR methodology in this system, (Table 1). Next, analytical IR bands for determining the Viton percentage in the HMX/Viton system were analyzed. The base line chosen for the bands
at 945 and 890 cm-1 was: 986 at 853 cm-1, and for the
bands of 1145 and 1170 cm-1: 1476 at 984 cm-1.
The absorbance values represent the median (μ) of ive analysis. According to Hórak (1978), it is recommended
to work with median numbers when working with a low number of experimental values. It may happen that the values of parameters μˆ and ˆσ thus determined are subject to larger
errors. These errors are dificult to determine due to a
non-uniform distribution of random errors in the set. Therefore, a difference assessment is made. The standard deviation, ˆσμ of
the median absorbance is calculated as follows[Hórak, 1978]:
equation
ˆ σμ =
ˆ σ
n (1)
where ˆσ is the assessed standard deviation of the basic set and is a quantitative measure of the precision for each
individual measurement; n is the number of experiments.
ˆ
σ =K
R⋅R (2)
where KR is the coeficient for the calculation of the average standard deviation from the variation range
(for ive experiments, KR = 0.430) (Hórak, 1978); and
R is the difference between the largest and the smallest element (Xn – X1). ˆσμ is an evaluation of the precision of this median, that is, an evaluation of the result obtained
from the treatment of a inite set of measurements, which
are repeated under completely identical conditions. The relative error for each sample was determined as follows:
relative error
( )
% = σˆμ μ ⎛
⎝
⎜ ⎞
⎠
⎟ ×100 (3)
Figure 6: FT-IR/ATR spectra using germanium crystal:
Viton B and Cob. 02/06-85/15%
Figure 7: FT-IR/ATR spectra for HMX/Viton using germanium crystal with sample in both sides of the crystal at 45o
this technique better results were obtained for indicating the analytical band and quantitative determination, as
represented in Fig. 7.
According to the set of absorption spectra FT-IR/ATR in
Fig. 7, characteristic bands for the HMX and Viton can
be observed. The band at approximately 1200 cm-1 is the
Analyzing Table 2, it is observed that the values of the bands
at 890 and 1170 cm-1 must obey a linear relation. With the
data from the termogravimetric analyses (reference method) and relative to the FT-IR analysis for Viton characteristic bands at 890 cm -1 and1170 cm -1, it is possible to have
the following linear relations for the content determination of Viton in agreement with the HMX/Viton, using relative bands method.
Viton content by TG/FT-IR using relative band
It is known that the relative bands method (relative absorbance) can be used for thickness correction of the specimens (Gedeon, 1985). Thus, for quantitative FT-IR analysis in HMX/Viton samples, the absorbance values at
945 cm-1 (HMX) were related to those corresponding to the
absorption at 890 cm-1 (Viton), in an attempt to evaluate
whether there would be an improvement in the precision of the methodology developed. With regards to the points of the base line at 986 cm-1, the 853 cm-1 was established
for the calculations of absorbance values for the vibration
absorption of the ring 945 cm-1 and C-F band at 890 cm-1.
To apply the Lambert-Beer law in this analysis, the relative
absorbance data of A945/A890 was placed as a function of explosive/plastic composition (percentage in weight), as
presented in Table 3.
Figure 8 shows the relative graph of the medium values of A945/A890 as a function of the relation of HMX/Viton
concentration (%m/m); a good linear relation is obtained (R=0.993). From the analytical curve obtained by FT-IR/ TG analysis (Table 3), the following relation is proposed;
y = -3.95 + 0.7x (4)
where y is the median value of the relative absorbance (A945/A890) as a function of the relative concentration of HMX/Viton.
Table 2: Median absorbance values for analytical bands of the HMX/Viton system
HMX/ Viton (%)
Median A945 HMX
Median A1145 HMX
Median A890 Viton
Median A1170 Viton
98/2 0.060 0.032 0.002 0.008
95/5 0.041 0.032 0.005 0.017
92/8 0.027 0.042 0.006 0.035
90/10 0.034 0.040 0.007 0.032
87/13 0.030 0.049 0.010 0.044
85/15 0.031 0.064 0.014 0.059
Table 3: FT-IR data (relative band A945/A890) PBX samples of (HMX/Viton)-reference: data TG
HMX/Viton Content by
TG
Relative Band A
945/A890 (median)
Standard deviation
( ˆσ)
Relative error (%)
45.95 28.50 6.50 22.81
20.01 9.60 1.11 11.56
14.72 4.28 0.15 3.50
10.24 4.62 0.16 3.46
8.88 3.00 0.12 4.00
8.98 2.21 0.07 3.17
Figure 8: Medians values of the relative absorbance A945 / A890 as a function of HMX/Viton content obtained by TG.
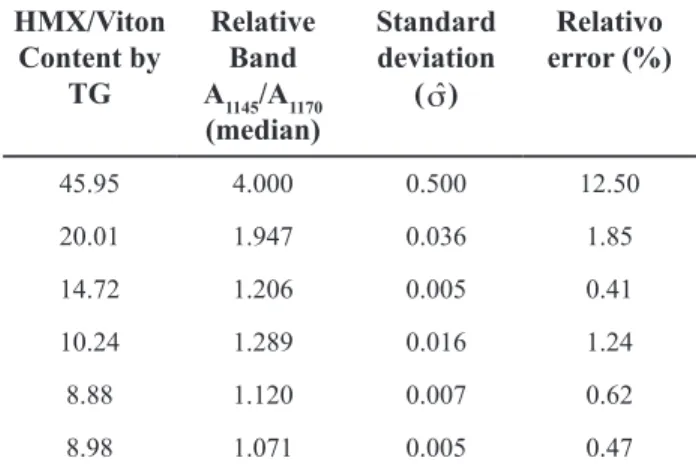
Table 4: FT-IR data (relative band A1145/A1170) of the PBX samples (HMX/Viton)-reference: data TG
HMX/Viton Content by
TG
Relative Band A1145/A1170
(median)
Standard deviation
( ˆσ)
Relativo error (%)
45.95 4.000 0.500 12.50
20.01 1.947 0.036 1.85
14.72 1.206 0.005 0.41
10.24 1.289 0.016 1.24
8.88 1.120 0.007 0.62
8.98 1.071 0.005 0.47
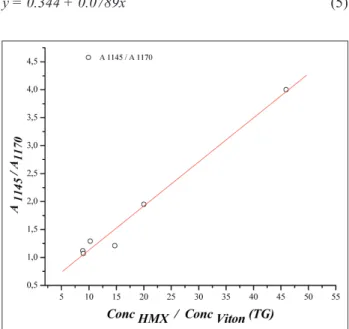
where y is the median value of the relative absorbance (A1145/A1170) as a function of the relative concentration of HMX/Viton.
With the analytical curves obtained (IR/TG) for the different IR bands used (relative band) the concentrations of Viton were calculated. The values of the linear correlation
coeficients (R) were evaluated and are presented in Table 5.
Figure 9: Medians values of the relative absorbance A1145 / A1170 as a function of HMX/Viton content obtained by TG.
Table 5: Viton contents by TG and FT-IR technique (relative
bands at 1145/ 1170 cm-1 and 945/ 890 cm-1)
Viton content By TG analysis
(%)
Viton content IR relative band
1145/1170 cm-1 TG reference
(%)
Viton content IR relative band
945/890 cm-1 TG reference
(%)
2.13 2.11 2.10
4.76 4.68 4.90
6.33 8.36 7.82
8.90 7.71 7.53
10.12 9.24 9.13
10.02 9.82 10.18
Linear
Correlation R = 0.991 R = 0.993
The data in Table 5 showed that the use of the relative band was the best adjusted for Viton content determination by FT-IR for PBX (HMX/Viton), presenting excellent
results, that is, better coeficients of linear correlation in
relation to the obtained values of Table 5. The best relative band was of 945/890 cm-1 using the TG technique as a
reference technique, with a linear correlation of 0.993, and furthermore it’s possible to better visualize the bands in the spectra in Fig.7.
CONCLUSIONS
ATR technique with germanium crystal where the sample
is placed in both sides of the crystal (45°) showed a better and more detailed spectra where it is possible to see the changes in the characteristic bands of polymer as a function of the content in the explosive mixture and a
more deined base line;
All the covering samples of the HMX/Viton system obtained in laboratory were analyzed by ATR technique
with Germanium crystal (45°), therefore they show better results for indicating the analytical band and quantitative determination;
The increase in intensity of the Viton bands with the increase in the polymer content in the system, enabled to
initiate the quantiication of these samples by FT-IR;
The use of a relative band showed to be adjusted for determining the Viton content by FT-IR for PBX (HMX/ Viton), presenting excellent results. The best relative band
was 945/890 cm-1, using the TG technique as a reference
technique;
The use of the new FT-IR methodology for polymer
quantiication in PBX showed to be faster without
generating chemical residues.
REFERENCES
Achuthan, C. P.; Jose, C. L., 1990, “Studies on Octahydro-1,3,5,7-Tetranitro-1,3,5,7-Tetrazocine (HMX)
Polymorphism”, Propellants, Explosives, Pyrotechnics,
Vol.15, pp. 271-275.
Agrawal, J. P., 2004, “Some New High Energy Materials
and Their Formulations for Specialized Applications”,
Propellants, Explosives, Pyrotechnics, Vol.30, Nº. 5, pp. 316.
Bedard, M. et al., 1962, “The Crystalline Form of 1,3,5,7-Tetranitro-1,3,5,7-Tetrazacyclooctane (HMX)”, Canadian Journal of Chemistry, Vol. 46, pp. 2278 – 2279.
Figure 9 shows the relative graph for the medium values of A1145 / A1170 as a function of the relation of HMX/Viton
concentration (%m/m); a good linear relation is obtained
(R=0.991). From the analytical curve obtained by FT-IR/
TG analysis (Table 4), the following relation is proposed;
Benziger, T. M., 1973, “High-Energy Plastic-Bonded Explosive”. U.S. Patent 3,778,319, 11 Dec., UNITED STATES ATOMIC ENERGY COMMISSION.
Calzia, J., 1969, “Les Substances Explosives et Leurs Nuisances”, Dunod, Paris, 344 p.
Campbell, M.S., Garcia, D., Idar D., 2000, “Effects of
Temperature and Pressure on the Glass Transitions of Plastic Bonded Explosives”, Thermochimica Acta, Vol.
357-358, pp.89-95.
Federoff, B.F., Shefield, O.E., 1966, “Encyclopedia of
Explosives and Related Itens”, Dover, Picantinny Arsenal, Vol. 8.
Mathieu, J., Stucki, H., 2004, “Military High Explosives”, Chimia, Vol. 58, Nº. 6, pp.383-389.
Gedeon, B. J., Ngyuen, R. H., 1985, “Computerization of ASTM D 3677 – Rubber Identiication by Infrared Spectrophotometry”, Meeting of Rubber Division, AC.S, Cleveland, pp. 1-12.
Hayden, D. J., 2005, “An Analytic Tool to Investigate the Effect of Binder on the Sensitivity of HMX-Based Plastic Bonded Explosives in the Skid Test”, Thesis, Master of Science Department of Mechanical Engineering, Institute
of Mining and Technology, Socorro, New Mexico, 42p.
Hohmann, C., Tipton Jr, B., 2000, “Viton’s Impact on
NASA Standard Initiador Propellants Properties”, NASA,
Houston (Tech. Report, NASA/TP 210187).
Hórak, M., Vitek, A., 1978, “Interpretation and Processing of Vibrational Spectra”, John Wiley & Sons, New York, 414 p.
Hummel, D. O., 1966, “Infrared Spectra of Polymers: In
Medium and Long Wavelengths Regions”, John Wiley & Sons, New York, 207p.
James, E., 1965, “The Development of Plastic-Bonded
Explosives”, Lawrence Radiation Lab., Univ. of California, Livermore. (Technical Report UCRL-12439).
Kasprzyk, D. J. et al., 1999, “Characterization of a Slurry
Process Used to Make a Plastic-Bonded Explosive”,
Propellants, Explosives, Pyrotechnics, Nº. 24, pp.333-338.
Kim, H.S., Park, B.S., 1999, “Characteristics of the
Insensitive Pressed Plastic Bonded Explosive DXD-59”,
Propellants, Explosives, Pyrotechnics, Nº. 24, pp.
217-220.
Kneisl, P., 2003, “Slurry Coating Method for Agglomeration of Molding Powders Requiring Immiscible Lacquer Solvents”, U.S. Patent 6,630,040 B2, 31 Jan. 2002.
Kohno, Y. et al, 1994, “ A Relationship Between the Impact
Sensivity and the Electronic Structures for the Unique N-N
Bond in the HMX Polymorphs”, Combustion and Flame, Vol. 96, pp.343-350.
Kwan, K. S., 1998, “The Role of Penetrant Structure in the Transport and Mechanical Properties of a Thermoset Adhesive”, Ph.D. Thesis, Faculty of the Virginia Polytechnic Institute, Blacksburg, 285f.
Litch, H. H., 1970, “HMX (Octogen) and Its Polymorphic Forms”, Symposium on Chemistry Problems with the Stability of Explosives”, Tyringe, pp.168 - 179.
Mattos, E. C. et al., 2004, “Determination of the HMX and RDX Content in Synthesized Energetic Material by HPLC, FT-MIR, and FT-NIR Spectroscopies”, Química Nova, Vol. 27, Nº. 4, pp. 540-544.(a)
Mattos, E.C. et al., 2004, “Avaliação do Uso de Técnicas FT-IR para Caracterização de Cobertura Polimérica de Material Energético”, Polímeros: Ciência e Tecnologia, Vol. 14, Nº. 2, pp. 63-68. (b)
Mattos, E. C. et al., 2008, “Characterization of Polymer-Coated RDX and HMX Particles”, Propellants, Explosives, Pyrotechnics., Vol. 33, pp. 44 – 50.
Mattos, E. C. et al., 2009, “Determination of Polymer Content in PBX Composition by FT-IR”, Proceedings of 40th International Annual Conference of ICT, Karlshure.
Mattos, E. C. et al., 2002, “Aplicação de Metodologias FTIR de Transmissão e Fotoacústica à Caracterização de Materiais Altamente Energéticos” - Parte II, Química Nova, Vol. 25, pp. 722-728.
Mattos, E. C. et al., 2003, “Caracterização por FTIR de Coberturas Poliméricas de Materiais Energéticos”, Anais da Associação Brasileira de Química, Vol. 51, Nº. 4, pp. 132-135.
Nogueira, D. A. R., Rosa, P. T. V., Santana, C. C., 2000, “Adsorção de Proteínas na Superfície de Polímeros: Quantiicação com FTIR/ATR”, I Brasilian Congress in Phase Equilibrium and Fluid Chemical Process Design, Águas de São Pedro, S.P., Brazil.
Silva G., Mattos, E.C., Dutra, R.C.L., Diniz, M.F., Iha, K., 2008, “Determinação Quantitativa de TNT e HNS por TG e FT-IR”, Química Nova, Vol. 31, Nº. 6, pp. 1431-1436.
Silverstein, R. M., Bassler, G. C., Morril, T. C., 1981, “Spectrometric Identiication of Organic Compounds”, 5 ed., John Wiley & Sons, New York.
Smith, A. L., 1979, “Applied Infrared Spectroscopy”, John Wiley & Sons, New York, pp. 286.
Tang, C. J. et al., 1999, “A Study the Gas-phase Chemical Strutcture During CO2 Laser Assisted Combustion of HMX”, Combustion and Flame, Vol. 117, pp. 170-188.
Thompson, D. G., Olinger, B., DeLuca, R., 2005,
“The Effect of Pressing Parameters on the Mechanical Properties of Plastic Bonded Explosives”, Propellants,
Explosives, Pyrotechnics, Vol.30, Nº. 6, pp. 391-396.
United States, 1979, “Departament of the Army. Military explosives”, Washington, DC, (TM 9-1300-214 C2).
Urbanski, T., 1984, “Chemistry and Tecnology of Explosives, Pergamon Press, Great Britain, Vol. 4, p. 391.
Urbanski, J. et al, 1977, “Handbook of Analysis of
Synthetic Polymers and Plastics”, John Wiley & Sons,
New York, 494 p.
Wanninger, P. et al., 1996, “Pressable Explosives Granular