INTRODUCTION
Since 1962 it has been shown that the electrical resistivity of metal oxide clusters is sensitive to the presence of chemical species on their surface [1]. This property is known as the chemical-resistive effect and ensures numerous applications for SnO2 and other metal oxides. SnO2 is an
amphoteric oxide with semiconductive characteristics, negative conductivity (n-type) and high thermal stability. Applications for this material include the construction of electronic noses, optoelectronic devices, solar cells, liquid crystal displays, catalysts and gas sensors [2]. Several studies have been published on SnO2-based sensors used to
detect and monitor different airborne gases and pollutants [3, 4]. The most noteworthy of these use SnO2 nanoparticles and
zeolites as selective material for certain sensor molecules [5]. The sensitivity of oxide semiconductors increases as particle size declines due to the increased adsorption capacity of the nanosystem [6]. The addition of dopants
such as platinum and palladium (Pt and Pd), highly eficient catalysts of oxidation, improves the surface reactions of gas sensors, thereby increasing their sensitivity [7].
A number of methods have been employed to synthesize different SnO2 nanostructures, including sol-gel [8],
polymeric precursors [9], hydrothermal [10], chemical precipitation [11], gas phase condensation [12], carbothermal reaction [13], solid state [4]and Sn(s) oxidation [14].
This study aims to synthesize SnO2 nanoparticles at
different calcination temperatures via oxidation of solid tin and characterize them using various analytical techniques.
MATERIALS AND METHODS
SnO2 was synthesized through the reaction of solid Sn
with HNO3 [14]. This method involves immersing solid tin
in an aqueous solution of HNO3 (400 mL, 34 vol.%) and
maintaining the mixture at relux under magnetic stirring for 24 h at room temperature. The resulting precipitate was
(Caracterização de nanopartículas de dióxido de estanho
sintetizadas por oxidação)
R. C. Abruzzi1*, B. A. Dedavid2, M. J. R. Pires3 Av. Ipiranga 6681, Porto Alegre, RS, Brazil 90619-600
1Graduate Degree in Engineering and Materials Technology, 2Faculty of Engineering,
3Faculty of ChemistryPontiical Catholic University of Rio Grande do Sul - PUCRS, Brazil
[email protected], [email protected], [email protected] *corresponding author
Abstract
Tin dioxide (SnO2) is a promising material with great potential for applications such as gas sensors and catalysts. Nanostructures
of this oxide exhibit greater activation eficiency given their larger effective surface. The present study presents results of the synthesis and characterization of tin dioxide under different conditions via oxidation of solid tin with nitric oxide. SnO2 powder
was characterized primarily by X-ray diffraction and scanning electron microscopy, as well as complementary techniques such as energy-dispersive X-ray spectroscopy, dynamic light scattering and Fourier transform infrared spectroscopy. The results indicated that the established synthesis conditions were suitable for obtaining rutile tin dioxide nanoparticles with a tetragonal crystal structure.
Keywords: calcination, oxidation, nanoparticles and tin dioxide. Resumo
O óxido de estanho (SnO2) é um material promissor com grande potencialidade para aplicações como sensores de gás e catalisadores. Nanoestruturas deste óxido apresentam maior eiciência de ativação devido a sua maior superfície efetiva. O presente trabalho apresenta resultados da síntese e caracterização do óxido de estanho em diferentes condições, via oxidação do estanho sólido com ácido nítrico. Resultados obtidos com a caracterização do pó de SnO2 principalmente por difração de raios X
e microscopia eletrônica de varredura, além de técnicas auxiliares como a espectroscopia por dispersão de energia, espalhamento de luz dinâmico e espectroscopia de infravermelho, indicaram que as condições estabelecidas para a síntese foram adequadas para a obtenção de grânulos nanométricos de óxido de estanho com estrutura cristalina tetragonal do tipo rutilo.
separated by centrifugation, washed with deionized water and dried at 80 °C for 24 h and 120 °C for 15 h, becoming a white powder. The solid was calcined at temperatures ranging from 400 to 700 °C for 10 h with a heating rate of 1 ºC.min-1 and then ground with a mortar and pestle. A
second synthesis reaction was carried out following the same basic procedure, with a reaction temperature of 45 °C and calcination at 600 °C to assess the inluence of heating on the reaction and SnO2 characteristics.
Commercial SnO2 nanoparticles (SkySpring
Nanomaterials, Inc., 50-70 nm) were analyzed using the same techniques and conditions as the synthesized SnO2 in
this study. The FTIR spectra of the samples were recorded with a Perkin Elmer Spectrum 100 FTIR spectrometer, with a transmittance range 4000-400 cm-1. Thin tablets were
made by diluting 1 mg of the SnO2 powder in 100 mg of
potassium bromide (KBr)[15], followed by drying in an oven for 2 h at 105 ºC. The size distribution of SnO2 was
established based on Brownian motion using the dynamic light scattering technique (DLS) and a Malvern ZEN3600 Zetasizer. For this analysis, 1 mg of SnO2 particles was
dissolved in 10 mL of ethanol or water, the solution was vortexed, ultrasonoied (25 kHz) for 15 min and stirred for 2 min using an ultronique ultrasonic probe (model disruptor). XRD diffractograms were obtained from the SnO2 powder
using a Bruker D8 Advance diffractometer with a copper tube. The diffractograms were interpreted with DIFFRAC. EVA V3.1 software and the COD2013 (Cristallography Open Data – 2013) database. Crystal size was calculated based on the XRD results using the Scherrer equation [16]. Microstructural analysis of the SnO2 powder was performed
on an XL 30 Philips scanning electron microscope and high-resolution scanning electron microscopy (FEG-SEM) was carried out using an Inspect 50 FEI microscope. To prepare the sample for SEM the SnO2 powder was dispersed in
isopropyl alcohol, drop coated onto an Al2O3 substrate and
dried in an oven at 80 °C for 30 min. FEG-SEM analyses were performed directly on the SnO2 powder.
RESULTS AND DISCUSSION
Fourier transform infrared spectroscopy - FTIR
Figs. 1 a and b show the FTIR spectra of the commercial and synthetic SnO2. FTIR analysis allows the vibrations of
atoms or groups of atoms to be observed. The characteristic FTIR for standard SnO2 generally shows stretching bands
with vibrations at 663 and 565 cm-1 [17]. The wider band at
around 3400 cm -1 and the peak at 1630 cm-1 are attributed
to the stretching and bending vibrations, respectively, of the hydroxyl group of water molecules. These two bands, which resulted from adsorbed water on the surface of SnO2
[18], were observed at approximately 3426 cm-1 and 1625 cm-1 respectively. The peak at 521 cm-1 is consistent with
Sn-OH stretching vibrations, while the peak at around 660-600 cm-1 corresponds to the Sn-O-Sn stretching vibrations
characteristic of SnO2 [18]. These bands were observed
at approximately 525 and 620 cm-1 respectively, and
characterize the formation of SnO2. Similar behavior was
noted for all the samples analyzed, including the commercial sample, all of which exhibited the characteristic peaks of SnO2 bonds.
Dynamic Light Scattering - DLS
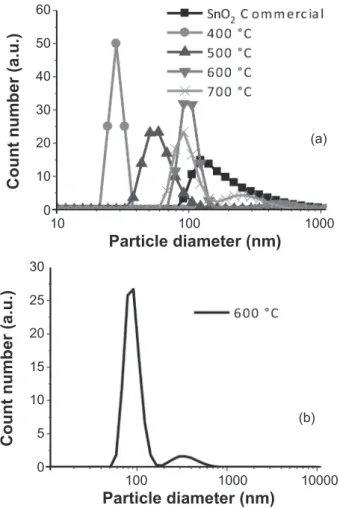
Figs. 2a and 2b show the particle size distribution (number-weighted) of commercial and synthetic SnO2.
Table I shows the weighted average size of commercial and synthetic SnO2 particles. The smallest particles were
obtained in the sample synthesized at room temperature and calcined at 400 °C. As the calcination temperature rose, nanoparticle size increased, except for the material calcined at 700 °C, which displayed smaller particle sizes than the material calcined at 600 °C. This result falls within the standard deviation (Fig. 4). With the exception of the material calcined at 600 ºC, all the samples showed average
Figure 1: FTIR spectra of the SnO2 samples, for a) synthesis with
different calcinations temperatures, b) (1) SnO2calcined at 600 ºC
in synthesis at 45 ºC and (2) commercial SnO2.
[Figura 1: Espectros de FTIR das amostras de SnO2 onde, a) síntese com diferentes temperaturas de calcinação, b) (1) SnO2 calcinado a 600 ºC em síntese com aquecimento de 45 ºC e (2) SnO2 comercial.]
38 4000
Wavenumber (cm-1)
T
ransmission (%)
2000
3000 1000
3500 2500 1500 400
42 46 50 54 58 62
67 (a)
38 4000
Wavenumber (cm-1)
T
ransmission (%)
2000
3000 1000
3500 2500 1500 400
42 46 50 54 58 62
20
2q (degree)
Intensity
40 70
30 50 60
(b)
weighted size less than 100 nm. No signiicant differences were observed between heat-assisted and room temperature synthesis for calcination at 600 °C. Larger particle sizes with this technique when compared with other analytical methods, indicating a high degree of clustering were reported [19]. This is due to the interactions between particles, such as Van der Waals, capillary and electrostatic forces [20].
X-ray diffraction - XRD
Figs. 3a and 3b show the DRX diffractograms of commercial and synthetic SnO2. The direction of crystallite
growth is along planes (110), (101), (200), (211) and (220) at different angles (2θ) than those reported [21]. The intensities of the peaks indicate preferred orientation in the direction of the plane (110), observed at approximately (2θ) 26.5º. All the diffraction peaks are consistent with the phases of pure SnO2 and its crystal structure (tetragonal
rutile-type). This result conirms the observations made in FTIR analysis, with the presence of two peaks characteristic
Figure 3: X-ray diffraction patterns of the SnO2 samples showing
the respective Miller indices, for: a) samples calcined at 400 °C (1), 500 °C (2), 600 °C (3) and 700 °C (4) and b) commercial SnO2 (1)
and SnO2 calcined at 600 ºC with heated in synthesis (2).
[Figura 3: Difratogramas de raios X de amostras de SnO2 com os
respectivos índices de Miller indicados, em: a) amostras calcinadas a 400 °C (1), 500 °C (2), 600 °C (3) e 700 °C (4) e b) SnO2 comercial (1) e SnO2 calcinado a 600 ºC com aquecimento na síntese (2).]
20
2q (degree)
Intensity
40 70
30 50 60
*Synthesis reaction with heating at 45 ºC. **Value for 75.3% of particles.
***Value for 91.2% of particles.
Table I - Average weighted particle size, crystal size, chemical composition and band intensity for different SnO2
calcination and synthesis temperatures.
[Tabela I - Diâmetro médio ponderado das partículas, tamanho de cristalito, composição química e intensidade de bandas para diferentes temperaturas de calcinação e
temperatura de síntese do SnO2.]
Calcination Temperature
DLS XRD EDS FTIR
Particle Crystallite Composition Intensity Sn O υ620,68
(ºC) (nm) (nm) (%,m) (%,m) (cm-1)
Commercial 226 ± 154 59 70 30 Strong
400 28 ± 3 7 74 26 Strong
500 63 ± 27 11 70 30 Strong
600 101 ± 15 17 72 28 Strong
700 **97 ± 21 28 72 28 Strong
*600 ***90 ± 18 18 66 34 Strong
Figure 2: Number-weighted particle size distribution, obtained by DLS - a) commercial SnO2 and calcined at different temperatures,
b) SnO2 calcined at 600 ºC in synthesis at 45 ºC.
[Figura 2: Distribuição de tamanhos das partículas ponderadas em número, obtidas por DLS - a) SnO2 comercial e calcinado em diferentes temperaturas, b) SnO2 calcinado a 600 ºC em síntese com aquecimento de 45 ºC.]
20 40
10
Particle diameter (nm)
Count number (a.u.)
100 1000
10
0 30
(a)
30
10 20
Particle diameter (nm)
Count number (a.u.)
100 1000 10000
25
5
0 15
of synthetic material. No peaks related to impurities formed during synthesis and belonging to other phases were observed in any of the samples. A rise in calcination temperature [6] causes an increase in the average size of SnO2 particles,
where wide diffraction lines correspond to small particle sizes and intense narrow diffraction lines indicate a high degree of crystallinity [16]. Table I shows that crystal size increases with a rise in calcination temperature, with the largest crystal size observed at 700 °C in XRD. The two samples calcined at 600 °C had similar crystal sizes and signal intensity in the same band, indicating a similar degree of crystallinity.
An increase in the calcination temperature of SnO2
leads to longer and narrower peaks, related to the increase in particle size and high degree of crystallinity of the material [22]. It was observed that the material is not fully crystalline, since the degree of crystallinity varied with each calcination temperature. It was reported that the increased SnO2 calcination temperature obtained by different methods
coincided with a rise in both particle size and degree of cystallinity, as well as a reduction in the energy gap [23].
Figure 4: Distribution of particle and crystal size and the relationship between them as a function of calcination temperature and for commercial SnO2. The test indicated by *600 was performed with
synthesis at 45 ºC.
[Figura 4: Distribuição do tamanho de partículas, tamanho de cristalito e a relação entre eles em função da temperatura de calcinação e para o SnO2 comercial. O teste indicado por *600 foi feito com aquecimento de 45 ºC na síntese.]
240 8.0 Ratio Size (nm) 7.0 6.0 5.0 700 600* 600 500 400 Commercial 4.0 3.0 120 210 90 180 60 150 30
Synthesis temperature (ºC) 0
Figure 5: SEM images with a magniication of 10000x and EDS of SnO2 samples. At a) and g) 400 ºC, b) and h) 500ºC, c) and i) 600 ºC, d)
and j) 700 ºC, e) and k) 600 ºC with synthesis at 45 ºC and f) and l) commercial SnO2.
[Figura 5: Imagens de MEV com aumento de 10000x e EDS em amostras de SnO2. Em a) e g) 400 ºC, b) e h) 500ºC, c) e i) 600 ºC, d) e j) 700 ºC, e) e k) 600 ºC com aquecimento de 45 ºC na síntese e f) e l) SnO2 comercial.]
0 0 0
cps/eV cps/eV cps/eV
cps/eV cps/eV cps/eV
10 10 10
10 10 10
5 5 5
5 5 5
0 0 0
0 0 0
2 4 2 4 2 4
1 3 5 1 3 5 1 3 5
5
keV keV keV
Wt% 27,76 72,24 100 Wt% 27,65 72,35 100 Wt% 33,82 66,18 100 Wt% 30,08 69,92 100 Wt% 25,68 74,32 100 Wt% 29,76 70,24 100 Element O Sn Total Element O Sn Total Element O Sn Total Element O Sn Total Element O Sn Total Element O Sn Total
0 1 2 3 4keV5 0 1 2 3 4keV5 0 1 2 3 4keV
Clusters of SnO2 particles were observed using transmission electron spectroscopy (TEM), with particle sizes similar to the crystal size obtained by XRD, demonstrating an increase in these values with a rise in calcination temperature [21]. SnO2 particle size was analyzed by N2 adsorption using the isotherm technique of Brunauer, Emmet and Teller (BET) and compared it to crystal size obtained by XRD, determining that the particles are composed of 2 to 4 crystallites [20]. A comparison of the DLS and XRD techniques (Fig. 4) shows that SnO2 particles contain approximately 3 to 6 crystallites.
Scanning Electron Microscopy and Energy-Dispersive X-Ray Spectroscopy (SEM and EDS)
Figs. 5a to 5f show the results of structural analysis for commercial and synthetic SnO2. For synthetic SnO2, structures were less homogenous and not well dispersed, forming more isolated and clustered structures at the magniication used. This result explains the larger particles size obtained by DLS, which takes particle dispersion into account. Calcined samples are characterized by clusters with microstructures of different sizes and irregular shapes, which may be the result of grinding [14]. Figs. 5g to 5l show the results of EDS for the standard and synthetic SnO2 samples. The weight percent of Sn and O present in
the samples can be determined stoichiometrically, where the respective percentages should be 78.8 and 21.2%. The Sn and O percentages measured in the samples were around these amounts (Table I), conirming the chemical composition of SnO2.
Fig. 6 shows FEG-SEM images of commercial and synthetic SnO2 nanoparticles. The samples are composed of similar spherical-shaped particles with size distribution varying in accordance with calcination temperature. The high resolution images indicate that these clusters are made up of smaller and less uniform particles. The synthetic samples exhibited smaller particles than those of the commercial samples (50-70 nm). Similar results were reported, that is, particles of different shapes and sizes; however, when the authors observed high-resolution images (FEG-SEM), they found that all the samples were similar in shape, with the only difference being in the size and number of clusters [4].
CONCLUSIONS
The characterization techniques employed demonstrated the successful synthesis of rutile (tetragonal) SnO2 nanoparticles, with no impurities observed. Initial microscopic analyses indicated the presence of particle clusters, with subsequent high-resolution imaging
Figure 6: FEG-SEM images of SnO2 nanoparticles calcined at different temperatures. At a) 400 ºC, b) 500 ºC, c) 600 ºC, d) 700 ºC,
e) 600 ºC with synthesis at 45 ºC and f) commercial SnO2.
[Figura 6: Imagens de FEG-MEV de nanopartículas de SnO2 calcinados em diferentes temperaturas. Em a) 400 ºC, b) 500 ºC, c) 600 ºC,
d) 700 ºC, e) 600 ºC com aquecimento de 45 ºC na síntese e f) SnO2 comercial.]
techniques (FEG-SEM) showing nanometric particles with uniform size distribution. DLS and XRD analyses showed that different calcination temperatures resulted in variations in crystallinity, crystal size and particle size. Heating during the process did not inluence synthesis or the size of SnO2 particles and crystals, indicating that
synthesis can be performed at room temperature. Of the techniques used, XRD proved to be the most eficient in identifying the formation of the desired structure and FEG-SEM was vital to the morphological characterization of particles at different calcination temperatures. Thus, these methods best characterized the synthesis and calcination of SnO2 at different temperatures. FTIR, DLS and SEM
complemented the information obtained in identifying the structure, particle size and morphology of the material.
ACKNOWLEDGEMENTS
The authors thank CNPq/CAPES (Proc. 552415/2011-1) for inancing this study and LabCEMM, NANOPUC and CEPAC for the analyses. R. Abruzzi is grateful to PUCRS and FAPERGS/CAPES for the doctoral scholarship.
REFERENCES
[1] G. F. Fine, L. M. Cavanagh, A. Afonja, Binions R, Sensors 10, 6 (2010) 5469-5502.
[2] A. P. Maciel, E. Longo, E. R. Leite, Quim. Nova 26,
6 (2003) 855-862.
[3] B. Licznerski, Bull. Polish Acad. Sci. 52, 1 (2004) 37-42.
[4] M. Choudhary, N. K. Singh, R. Dwived, V. N. Mishra, J. Mater. Sci. - Mater. Electr. 24, 2 (2013) 752-757. [5] M. Vilaseca, J. Coronas, A. Cirera, A. Cornet, J. R. Morant, J. Santamaria, Sensors and Actuators B-Chemical 133, 2 (2008) 435-441.
[6] N. Yamazoe, G. Sakai, K. Shimanoe, Catalysis Surveys from Asia 7, 1 (2003) 63-75.
[7] M. Choudhary, V. N. Mishra, R. Dwivedi, Int. Conf. Commun. Electr. Syst. Des. (ICCESD), India (2013).
[8] J. R. Zhang, L. Gao, J. Solid State Chem. 177, 4-5
(2004) 1425-1430.
[9] M. I. B. Bernardi, C. A. C. Feitosa, C. A. Paskocimas, E. Longo, C. O. Paiva-Santos, Ceram. Int. 35, 1 (2009) 463-466.
[10] Q. He, W. Zeng, Y. Wang, B. Miao, H. Long, Z. Miao, Z. Zhang, Y. Wang, Mater. Lett. 113, 15 (2013) 42-45. [11] A. N. Naje, A. S. Norry, A. M. Suhail, Int. J. Innov. Res. Sci., Eng. Technol. 2, 5 (2013) 7068-7072.
[12] J. M. Herrmann, J. Disdier, A. Fernandez, V. M. Jimenez, J. C. Sanchez-Lopez, Nanostructured Mater. 8,
6 (1997) 675-686.
[13] M. O. Orlandi, R. Aguiar, R. M. D. Bomio, E. R. Leite, E. Longo, Cerâmica 50, 313 (2004) 58-61.
[14] N. Sergent, P. Gelin, L. Perier-Camby, H. Praliaud, G. Thomas, Sens. Act. B - Chemical 84, 2-3 (2002) 176-188.
[15] D. A. Skoog, F. J. Holler, S. R. Crouch, Aplicação da Espectroscopia no Infravermelho, in: “Princípios de
Análise Instrumental”, 6ª Ed., Bookman, S. Paulo, Brazil (2009) 469-491.
[16] B. D. Cullity, Diffraction I: The directions of Diffracted Beams, in: “Elements of X–Ray Diffraction”,
Addison-Wesley Publ. Co., USA (1956) 78-103.
[17] K. Jain, Rashmi, S. T. Lakshmikumar, Journal Surface Science Technology 21, 3-4 (2005) 129-138. [18] S. Tazikeh, A. Akbari, A. Talebi, E. Taleb, Materials Science-Poland 32, 1 (2014) 98-101.
[19] M. Radecka, A. Kusior, A. Lacz, A. Zajac-Trenczek, B. Sypien-Lyson, K. Zakrzewska, Journal of Thermal Analysis and Calorimetry 108, 3 (2012) 1079-1084. [20] A. Gaber, M. A. Rahim-Abdel, A. Y. Latief-Abdel, M. N. Abdel-Salam, Int. J.f Electrochem. Sci. 9, 1 (2014) 81-95.
[21] K. Wongsaprom, R-A. Bornphotsawatkun, E. Swatsitang, Appl. Phys. A - Mater. Sci. Proc. 114, 2 (2014) 373-379.
[22] M. Aziz, S. S. Abbas, W. R. W. Baharom, Mater. Lett. 91 (2013) 31-34.
[23] A. E. Shalan, I. Osama, M. M. Rashad, I. A. Ibrahim, J. Mater. Sci.: Mater. Electr. 25, 1 (2014) 303-310.