*e-mail: [email protected]
A Kinetic and Equilibrium Study of Zinc Removal by Brazilian Bentonite Clay
Ana Lucia Pereira de Araujoa*, Marcelino Luiz Gimenesb,
Maria Angelica Simões Dornellas de Barrosb, Meuris Gurgel Carlos da Silvaa
aSchool of Chemical Engineering, University of Campinas – UNICAMP, CEP 13083-970, Campinas, SP, Brazil
bDepartament of Chemical Engineering, State University of Maringá – UEM, CEP 87020-900, Maringá, PR, Brazil
Received: May 16, 2012; Revised: August 19, 2012
This paper aimed to study the removal of zinc using bentonite clay from the Northeastern Brazil, as an adsorbent. A study of the clay subjected to thermal and chemical treatment was performed in order to evaluate the optimization of the adsorption capacity of this material. For the evaluation of the kinetic equilibrium of the process, experimental tests were carried out in a finite bath system. The maximum amount of metal adsorbed was 0.151 mEq of metal per gram of calcined clay and 0.257 mEq of metal per gram of sodium saturated clay. The kinetic models of pseudo-first order, pseudo-second order and intraparticle diffusion were fitted to experimental data, and the pseudo-second order model provided the best result. The Langmuir and Freundlich models were used for the adsorption equilibrium analysis, and the Langmuir model provided the best fit for sorption isotherms. The physicochemical characterization of clay involved X-ray diffraction, scanning electron microscopy, chemical analysis by energy-dispersive X-ray spectroscopy, helium pyconometry and thermogravimetric analysis. The modified clay has potential use for removing Zn2+ ions replacing more expensive adsorbents, since
good adsorption properties will be also associated with great availability and low cost.
Keywords: X-ray diffraction, adsorption, zinc, Bofe clay
1. Introduction
Conventionally, the removal of heavy metals is by chemical precipitation, although this process is relatively simple and economical, generates a large volume of sludge and, depending on the metal and the chemical characteristics of the effluent after the final filtration, the effluent may still present residual metal values above the acceptable environmental conditions, requiring the application of a complementary process to the final polishing of the effluent.
The adsorption proved to be an alternative to tertiary treatment for the removal of heavy metals from aqueous solutions, because it is not only very efficient, but also economic, since it can use low-cost adsorbents. Alternative adsorbents such as natural clay have been assessed due to its high availability and cost-effectiveness for the removal of heavy metals. The use of clay as an adsorbent for removing heavy metals is due to its ion exchange capacity (CEC) in the range of 60 to 170 mEq/100 g, selectivity, renewability and affordability compared with other natural and synthetic adsorbents. Due to their advantages, clay potentials as a heavy metal removal agent have been investigated by1-4,
however, further studies are needed to assist in understanding the mechanisms and parameters involved in the process.
Arias and Sen5 studied the removal of Zn2+ ions in
kaolin. The results show that Langmuir and Freundlich
equations both are applicable to describe the adsorption of zinc (Zn2+) on kaolin within this small initial metal ion
concentration range. Kubilay et al.6 studied the removal of
copper (II), Zn (II) and Co (II) using a natural bentonite Clay was found that the efficient removal of these metals even at very low concentrations. The Langmuir isotherm model was fitted to the adsorption data and the order of affinity of metal ions with clay was Zn2+ > Cu2+ > Co2+.
Veli and Alyuz7 studied the removal of Zn2+ ions in natural
bentonite clay. The removal of Zn2+ ions was 3.6 mg.g–1 for the
initial concentration of 20 mg.L–1. Abollino et al.8 studied the
removal of Zn2+ ions in montmorillonite. The total capacity of
Zn2+ in montmorillonite was 3.61 mg.g–1. Tito et al.9 studied
the zinc adsorption process by bentonite clay. The maximum retention capacity, 3.24 mg.g–1, was obtained in pH 4 using
particle size of bentonite clay <0.5 mm.
order to achieve a better understanding of the mechanism of adsorption on modified materials.
According to Santos10, clays containing adsorbed water
in the voids between the particles and the surface of the particles in the form of hydroxyl groups. This clay minerals ability to adsorb water is a problem in the adsorption of heavy metals in porous bed, due the clay expansion. The water can be eliminated by heating clay at temperatures above 300 °C. In the case of montmorillonite water is intercalated between the layers that define the crystal structure and causes swelling or expansion of basal plane (001) to cause an increase in distance interplanar basal and can be eliminated at temperatures between 500 °C and 550 °C.
The clay thermal treatment is needed, since after this process it undergoes dehydroxylation and modification in their structure, so as not expand in water, making it more favorable to the adsorption in porous bed.
Preliminary study with clay sodium aiming their potential use in removing heavy metal. Clays have a high cation excharge capacity, that is, cations within the crystalline lamellae can be exchanged for other cations present in aqueous solution, without thereby modifying their crystal structure. This exchange is possible chemically modify clays directly altering their physicochemical properties, improving their ability to adsorption and ion exchange by increasing its potential applications in new technologies.
This study employed a modified Bofe bentonite clays for the kinetic study of zinc in finite bath system. The influence of adsorbate concentration and temperature were investigated. Kinetic models were tested in order to identify the adsorption process mechanisms. The Langmuir and Freundlich models were applied for the analysis of the adsorption equilibrium. Thermodynamic parameters were evaluated as a function of the temperature. Several characterization techniques were employed in order to identify the changes in clay that may influence its applicability in adsorption process.
2. Material and Methods
2.1.
Adsorbent
The Bofe bentonite clay from Boa Vista, Paraíba State, Brazil, was used as adsorbent. Initially, the material was crushed and classified to obtain an average particle diameter of 0.074 mm. The cation exchange capacity of natural clay was 93.3 ± 7 mEq/100 g, determined by exchange with ammonium cations5. The natural clay was oven calcined at
500 °C for 24 hours. Sodium saturated clay was prepared by dispersing 10% of clay weight in water and adding 10 mL of NaCl (2.5 M), stirring (500 rpm) and heating (45 °C) for 4 hours. The mixture was vacuum-filtered and washed with deionized water to remove excess sodium, until negative test with 1% silver nitrate solution. The pellets were oven dried at 100 ± 5 °C for 24 hours.
The point of zero charge of the adsorbents, pHzpc, was determined by potentiometric titration, following the model described by Guarino et al.11. This model shows that charges
on the surface of the solid result from an acid-base reaction (Surface Complexation Model). The experimental procedure
consisted of titrating two suspensions containing 10 g of clay each, in 100 mL of CH3COONH4 (0.1 M) as supporting electrolyte (after waiting 10 minutes for stabilization), one containing CH3COOH (0.3 M) and another containing NH4OH (0.25 M). This titration was performed in a wide range of acid and base concentrations. The surface charge, Q in units of mol/g, was obtained by applying Equation 1. The pHzpc value of the solid was obtained by constructing a graph of the total surface charge of the solid as a function of pH. This value corresponds to the pH whereby the curve crosses the x-axis (Q = 0).
[ ] [ ]
a b
S
C C OH H
Q
C
− +
− + −
= (1)
Where Ca and Cb corrected acid and base concentrations (M), respectively; Cs concentration of suspended solid (g.L–1)
2.2.
Characterizing the adsorbent
Natural, calcined and sodium saturated clays were submitted to X-ray diffraction (XRD) in Phillips equipment, X’Pert model, Kα cooper radiation (λ = 1.5418 Å), observing the diffraction angle of 2θ, step size of 0.02 degrees ranging between 4° and 30°. In order to evaluate the adsorbent morphology, a scanning electron microscopy (SEM) with LEO equipment, LEO 440i, with 500 X power was performed. Energy dispersive X-ray techniques (EDX) were used to identify the total chemical composition of the clay. The real density was determined by Micrometrics Accupyc 1330 helium gas pycnometer and the analyses were performed at 28 °C and 0.0010 psig/min equilibrium rate. The thermogravimetric analysis allowed establishing the relationship between physical and chemical properties and temperature. This analysis was carried out ranging from room temperature to 1000 °C in nitrogen atmosphere and using equipment Shimadzu, model TGA-50.
2.3.
Metal solution
The aqueous solution was prepared from analytical grade hexahydrated zinc nitrate, Zn(NO3)2. 6H2O. The metal concentration remaining in aqueous solutions submitted to zinc adsorption tests was determined by the Perkin–Elmer ANALYST-100 Atomic Absorption Spectrophotometer.
2.4.
Batch adsorption
The tests were performed using 1.0 g of adsorbent and 100 mL of metal solution at initial concentration of 3.0 mEq.L–1 and pH value of 4.5, which was defined
according to metal speciation. The solution pH was adjusted by using HNO3 (0.1 M) or NH4OH (0.1 M) and measured with a pH meter (OAKTON).
The vials were kept at room temperature (25 °C) under constant stirring at 150 rpm in a Shaker with control of temperature and agitation. At predetermined time intervals aliquots were withdrawn and the metal concentration was determined by atomic absorption spectrophotometer. The adsorption capacity of metal ion at each time step was calculated using the Equation 2:
(
0)
eq eq
s
V
q C C
m
Where qeq adsorption capacity of metal ion (mEq.g–1);
C0 initial concentration of metal ion in solution (mEq.L–1);
Ceq final concentration of metal ion after the equilibrium is reached (mEq.L–1); V volume of solution (L); m
s mass of
adsorbent (g).
The percentage of removal (%Rem) was calculated by Equation 3:
0
0 % Re m C Ceq 100
C
−
= ×
(3)
The experimental data were fitted to kinetic models of pseudo-first order, pseudo-second order and intraparticle diffusion model. The fit was performed using the software Origin 6.0.
a) Pseudo-first order model (Equation 4):
(
1 a t1)
t eq
q =q −e− (4)
Where a1 pseudo-first order adsorption rate constant (min–1); q
t amount of metal ion absorbed at time t (mEq.L–1).
b) Pseudo-second order model (Equation 5):
2
( ) 1
eq t eq
eq
q kt
q q
q a t =
+ (5)
Where a2 pseudo-second order adsorption rate constant, (g.(mEq min))
c) Intraparticle diffusion (Equation 6):
0.5 3
t
q =a t (6)
Where a3 intraparticle diffusion constant, (min–1).
2.4.1. Adsorption equilibrium
The experiments were performed under the same conditions of the kinetic study, varying the concentration of adsorbate from 0.1 mEq.L–1 to 6 mEq.L–1 using the pH
value set by the study of chemical speciation of ions, for an interaction time of 150 minutes. After reaching the equilibrium, aliquots were withdrawn to determine metal concentration. The adsorption capacity of metal ion was calculated using the Equation 2. The experimental data were fitted with Langmuir and Freundlich isotherms. The fitting was performed using software Origin 6.0.
Langmuir isotherm (Equation 7):
1 m eq eq eq q bC q bC =
+ (7)
Where qm maximum amount of ion adsorbed per unit of adsorbent mass to form a complete monolayer on the surface, (mEq.g–1); b constant related to adsorption energy,
corresponds to the affinity between adsorbent surface and solute, (L.mEq–1).
The use of Langmuir isotherm in fitting the data to remove metal ions from synthetic solutions has been reported with good results12-16.
The essential characteristics of Langmuir isotherm can be expressed by the constant dimensionless number, separation factor or equilibrium parameter (RL), which indicates the curvature of the sorption isotherm: if RL > 1, the isotherm is not favorable; if RL = 1, it is linear; 0 < RL < 1, favorable; RL = 0, irreversible. This value is given by the Equation 8: 0 1 1 L R bC =
+ (8)
Freundlich isotherm (Equation 9): n
eq f eq
q =K ×C (9)
Where kf constant related to adsorbent capacity; n constant related to adsorption intensity.
2.4.2. Thermodynamics of adsorption
The Langmuir isotherm model was used to fit the equilibrium data obtained under the conditions used to study kinetics in finite bath at 293 K, 313 K, 323 K and 348 K using calcined Bofe clay as adsorbent to remove Zn2+. Thermodynamic parameters for the adsorption process,
∆H, ∆S and ∆G were calculated using the thermodynamic Equations 10 and 11:
∆G = –RT × ln Kd (10)
( )
ln d
G S H
K
RT R RT
∆ ∆ ∆
= − = − (11)
Where R universal gas constant (8.314 × 10⁻³ kJ.(K mol)–1);
T temperature, K; ∆H enthalpy variation, (kJ.mol–1); ∆G Gibbs
free energy variation (kJ.mol–1); ∆S entropy variation
(J.Kmol–1); K
d coefficient of adsorbate distribution (L.g–1).
The ln(Kd) versus 1/T graph must be linear with the slope (–∆H/R) and intercepts the y-axis in (∆S/R), providing the values of ∆H, ∆S and ∆G. The variation of Gibbs free energy (∆G) is the fundamental criterion of spontaneity of the process. The given process only occurs spontaneously at a given temperature if ∆G < 0. This relationship is valid when the enthalpy variation remains constant in the considered temperature range.
3. Results
3.1.
Adsorbent characterization
3.1.1. X-ray diffraction (XRD)
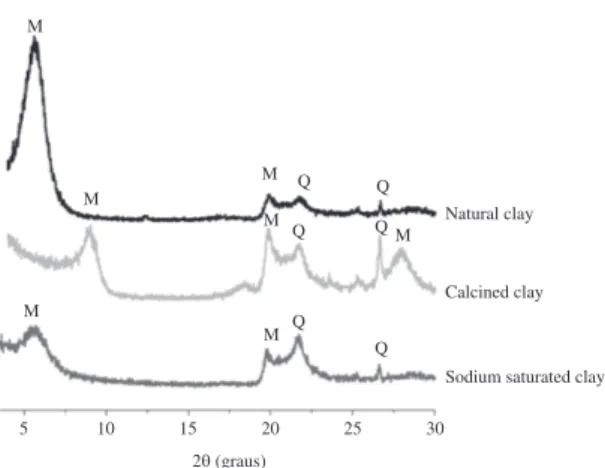
The diffractograms for natural, calcined and sodium saturated Bofe clay are presented in Figure 1. There were peaks relating to the montmorillonite (M) and quartz (Q),
typical of this type of clay that has smectite as a predominant clay mineral17, moreover, these clays does not have a
highly crystalline structure, since the peaks detected by the diffraction are not well-defined.
Heat and chemical treatment provided a modification in the clay structure, decreasing the intensity of the typical peak of montmorillonite (d001), indicating a possible distortion in the arrangement of tetrahedral and octahedral layers after these treatments. With the heat treatment there is a reduction in the basal spacing, whereas the chemical treatment increases this distance. The temperature causes thermal distortions of the crystalline structure, modifying thus the Bragg reflection standards. Dehydration and dehydroxylation occurring during calcination may be followed by cation movement within the octahedral sheet18-20. Structural and basal spacing changes caused by
thermal treatment modify the hydration capacity of the clays, making them more stable in the presence of water, when compared to the natural sample. This enables it to be used in fixed bed columns, since it is a solution for natural clay expansion problems.
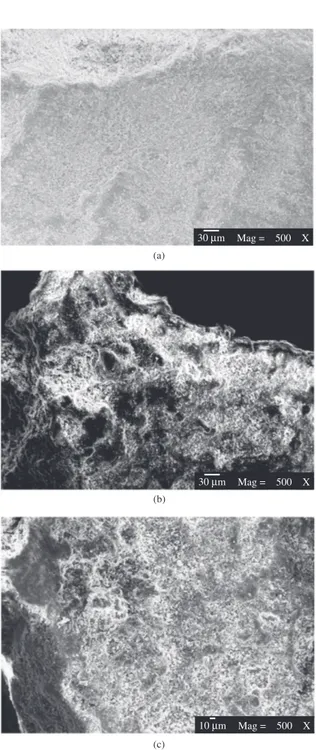
3.1.2. Morphology and qualitative chemical composition The micrographs of natural, calcined and sodium saturated Bofe clays are shown in Figure 2. Comparing the micrographs, the particles have no defined format and present ripples that indicate stacking of the layers with much dispersed grains and variable dimensions, corroborating the information given by Santos20 for clays of this group. The
morphology of the samples, regardless of the modification process, is very similar, without significant differences in the morphological structure after thermal or sodium treatment. Chemical analysis from the energy-dispersive X-ray spectroscopy presented in Table 1 allowed evaluating qualitatively the components of the clays. There was a predominance of silicon and aluminum, base elements of the clays of smectite group, originating from the structure of the phyllosilicate. This clay is polycationic due to the presence of Ca2+, Mg2+ and Na+ cations on the natural
clay, which is interesting for the adsorption process. After calcination, there was no significant change in the chemical composition of Bofe clay and the exchangeable cations were preserved. With sodium treatment, there was a reduction in the amount of Mg2+ and Ca2+ and an increase in Na+, due to
ion exchange during process.
3.1.3. Particle density by He gas pycnometry
The real density values of natural, calcined and sodium saturated Bofe clays are presented in Table 2. Thermal and sodium treatments led to a slight reduction in real density of the clay. In the first case, due to dehydration and dehydroxylation caused by calcination, whereas in the second case, the replacement of Ca2+ and Mg2+ by Na+, an
element with lower density and larger ionic radius, resulted in a decrease in the mass/volume ratio.
3.1.4. Thermogravimetric analysis
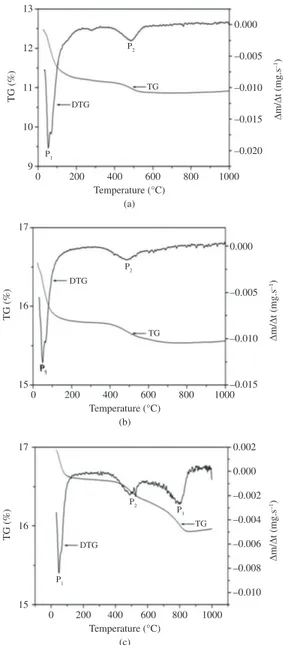
Figure 3 shows the thermogravimetric derivative curve samples of natural, calcined and sodium saturated Bofe clays. All clays have a region of water loss, volatile
compounds, microorganisms and organic matter, around 50 °C (P1). There are two types of losses: type I, water adsorbed with high mobility, being easily removed; and type II, hydration water around the exchangeable cations, whose presence depends on the number of hydrated cations in the interlayer space.Type II takes place in natural clays, with very hydratable cations such as Na+, K+ and Ca2+[21].
Dehydroxylation regions (P2) occur around 400 °C and 480 °C. The range of structural hydroxyl loss for natural clay is in agreement with Santos20, i.e., 400 °C to 700 °C.
Based on this analysis, the temperature of 500 °C was set
for clay calcination in order to increase its stability for subsequent application in fixed bed adsorption column. For sodium-saturated clay, besides (P1) and (P2) losses, there was a new stage of weight loss (P3) regarding NaCl, interspersed in the clay structure during sodium treatment. This peak reaches about 800 °C, coinciding with the melting point of sodium chloride.
3.2.
Determination of the adsorbent point of zero
charge and metal chemical speciation
Figures 4 and 5 illustrate the charge variation for all clay samples and the ions Zn2+ speciation curve of the in
aqueous solution with nitrate ions at 50 mg.L–1 determined
using HYDRA.
The electrical charge of clay surfaces is dependent on pH. There is a particular pH value where the amounts of positive and negative electric charges are equal, this pH value is characteristic for each clay and called point of zero charge, pHzpc. The main surface functional groups in clays that generate loads are pH-dependent Si-OH groups and Al-OH. In Figure 4, the pHZPC value for calcined clay is close to pH 5.3, whereas for natural and sodium saturated clay is close to pH 6.0. This difference is because there are more hydroxyl groups on natural and sodium-saturated clays, while calcined clay underwent dehydroxylation. In order to maximize the removal of zinc ions from an aqueous solution, considering the ion behaves as a cation, it was defined that the adsorption process would be performed in a range of Ph > pHZPC, and in these cases pH > 5.3 for calcined clay and pH > 6.0 for sodium saturated clay. However, taking into consideration the effect of Zn2+ precipitation under high
pH values, a study of chemical speciation of these ions was carried out in relation to the pH.
In Figure 5, the metal species present in deionized water are in the forms of Zn2+, ZnOH+, Zn(O) and Zn(OH)
2(S).
Within the pH range of 1.0-5.0, the solubility of the Zn(OH)2(S) is high and therefore, the Zn2+ is the main species
in the solution. Within the pH range of 5.0-9.0 the solubility of Zn(OH)2(S) decreases and at pH 10.0, the solubility of Zn(OH)2(S) is very low at this time, and the main species in the solution is Zn(OH)2(S) and the fraction of ions Zn2+ in
aqueous solution decreases.
Through the analysis of pHZPC (Figure 4) we should proceed the adsorption in a pH range > pHzpc, in these cases, pH > 5.3 for the calcined clay and pH > 6.0 for sodium saturated clay.
Table 1. Chemical analysis of natural, calcined and sodium saturated Bofe clays.
Components
(% mass) Natural Calcined
Sodium saturated
Na 0.54 0.50 1.83
Mg 1.34 1.19 1.15
Al 7.43 6.84 7.25
Si 46.86 46.17 45.95
K 0.12* -
-Ca 0.44 0.58 0.12
Ti 0.42 0.53 0.47
Fe 3.58 3.32 3.52
Total 60.73 59.13 60.52
*≤ 2 sigma
Table 2. Real density of natural, calcined and sodium saturated Bofe clays.
Bofe Clay Real density (g.cm–3)
Natural 2.5024 ± 0.0038
Calcined 2.4866 ± 0.0031
However, by the chemical speciation, at pH = 5.0 starts the precipitation of zinc. Thus, to ensure the adsorption process, the pH was set to 4.5 for all conditions studied.
The pH of the dispersion formed by natural, calcined and sodium saturated Bofe clays were measured, whereby 1 g of clay was dispersed in 100 mL of deionized water. The results were pH 7.7, 4.3 and 7.9 for natural, calcined and sodium saturated clays, respectively.
The pH of the clay results in part from the nature of exchangeable ions present. According to the chemical composition obtained by EDS (Table 1), the exchangeable ions of Bofe clays are alkali metal cations and alkaline earth metals, which give an alkaline pH to the dispersions formed by natural clays. With calcination, no loss of cations, but dehydroxylation occurs, which provides an acid pH for the dispersion formed with the calcined clay.
3.3.
Adsorption experiments
3.3.1. Adsorption kinetics
The Figure 6 shows the kinetic curves for the adsorption capacity for Zn2+ ions fitted to models of pseudo-first order
and pseudo-second order by natural (a), calcined (b) and
sodium saturated (c) Bofe clays. The intraparticle diffusion model was also fitted to the experimental data, however, it had no satisfactory results and the curves were not presented.
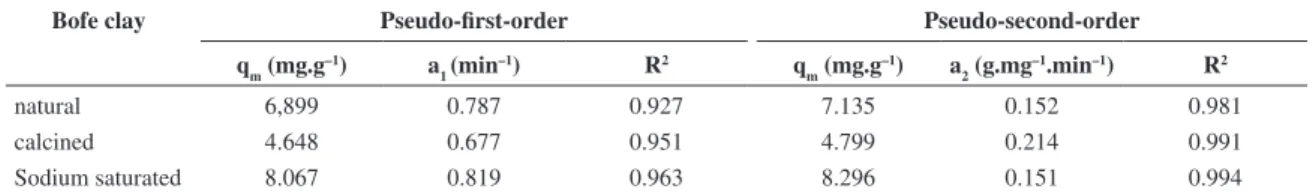
The parameters obtained from fitting of the pseudo-first, pseudo-second order and intraparticle diffusion models are listed in Table 3. The value of R2 demonstrates that the
pseudo-second order model best fitted the experimental results compared to the pseudo-first order model for all the clays analyzed in this study. The kinetic model of pseudo-second order assumes that the limiting step of the process is chemisorption involving valence forces by sharing or exchanging electrons between the adsorbent and the metal22.
The capacity of Zn2+ removal on sodium saturated
Bofe clay increases, whereas in calcined clay, it decreases
Figure 4. Potentiometric titration of natural, calcined and sodium saturated clays.
Figure 5. speciation curve of the Zn2+ ion in aqueous solution with
nitrate ions at differents concentrations determined through the HYDRA application
compared to natural Bofe clay (Table 3). However, the calcination of clay is necessary, since after this process the clay suffers dehydration and dehydroxylation, which cause changes in the structure so as it does not expand in water, making it favorable for the adsorption in fixed bed22. On
the other hand, sodium treatment improved the adsorption capacity, easing the exchange of metal ions by sodium ions.
3.3.2. Adsorption equilibrium
The Figure 7 shows the adsorption isotherms of Zn2+ by
calcined and sodium saturated Bofe clay fitted to models of Langmuir and Freundlich. The isotherms had a similar behavior, and both can be classified as favorable. Table 4 quotes the parameters obtained by these adjustments.
Observing the R2 values in Table 4, the Langmuir model
best fits the concentrations of Zn2+ adsorbed than Freundlich
model. Similar results were found by Bhattacharyya and Gupta23 for the removal of heavy metals on montmorillonite.
The values for Freundlich constant is 0.2-0.3 indicating that the adsorptive characteristics of calcined and sodium-saturated Bofe clays are good for zinc adsorption. The amount of metal adsorbed at equilibrium, adjusted by Langmuir model, was 0.13 mEq.g–1 and 0.24 mEq.g–1, for
calcined and sodium saturated Bofe clays, respectively. The greater amount of metal adsorbed at equilibrium to the sodium saturated clay may be related to the phenomenon of ion exchange existing in this process, as with the use of NaCl is increased the number of cations Na+, which is
more easily exchangeable by being monovalent, which are surrogate of zinc. Therefore, the model of pseudo-second order showed better agreement with the values obtained by Langmuir model.
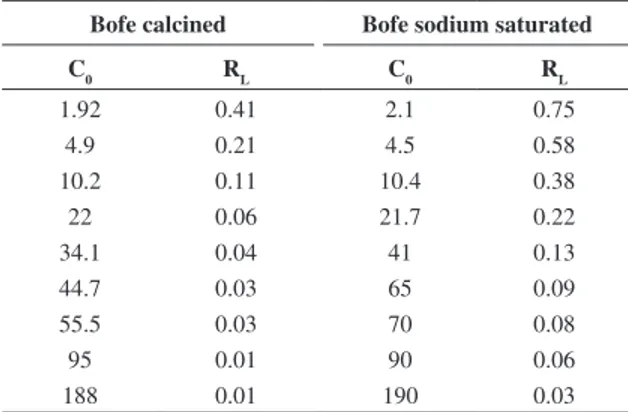
To evaluate the affinity between adsorbate and adsorbent, the dimensionless separation factor (RL) was calculated, based on Langmuir constant b and the initial zinc concentration presented in Table 5. The values of RL for zinc adsorption on calcined and sodium saturated Bofe clays range between 0 and 1, characterizing a favorable adsorption, mainly for the highest initial concentrations of metal.
3.3.3. Thermodynamic study
The Figure 8 shows the isotherms of Zn2+ adsorption on
calcined Bofe clays fitted with Langmuir models at 293 K, 313 K, 323 K and 348 K. For all temperatures, the isotherms had the same behavior and are classified as favorable.
Table 3. Zn2+ adsorption rate coefficients for pseudo-first-order and pseudo-second-order on Bofe clay.
Bofe clay Pseudo-first-order Pseudo-second-order
qm (mg.g
–1) a
1 (min
–1) R2 q
m (mg.g
–1) a
2 (g.mg
–1.min–1) R2
natural 6,899 0.787 0.927 7.135 0.152 0.981
calcined 4.648 0.677 0.951 4.799 0.214 0.991
Sodium saturated 8.067 0.819 0.963 8.296 0.151 0.994
Table 4. Ion Zn2+ parameters obtained by fitting the model of Langmuir and Freundlich.
Bofe clay Langmuir Freundlich
qm (mg.g–1) b (L.mg–1) R2 k f (L.g
–1) N R2
calcined 4.395 0.767 0.9822 18.663 0.213 0.9459
Sodium saturated 7.967 0.161 0.9817 17.909 0.276 0.9709
Negative values of ∆S suggest a reduced randomness in the solid-solution interface during the adsorption of Zn2+ on
calcined Bofe clay. For all temperatures studied, the negative values of ∆G indicate that, thermodynamically, there was a decrease in Gibbs free energy confirming the viability of the adsorption process and that the clay-Zn2+ interactions took
place spontaneously. Another aspect is that the variation of Gibbs free energy decreased with the temperature increase, pointing out that the adsorption process is more favorable at high temperatures. These results are in agreement with that obtained by Kubilay et al.6 in adsorption experiments for the
removal of Zn2+ on bentonite clay between 293 and 353 K.
4. Conclusion
Calcined and sodium saturated Bofe clays presented an adequate capacity of Zn2+ adsorption in aqueous solution,
under the studied conditions. The characterization evidenced the changes occurred in the clays after treatment. Although with less capacity for zinc removal, the calcined clay is more suitable to be employed in fixed bed column, due to the stability gained from the thermal treatment. The pseudo-second-order kinetic model best represented the mechanism of interactions involved during the adsorption. The experimental data at equilibrium satisfactorily fitted the Langmuir model. These results show that calcined and sodium-saturated Bofe clays may be used for elimination of Zn2+ through adsorption mechanisms and can replace other
adsorbents more expensive, because of high availability, low cost, even after the treatments, and good adsorption properties.
Acknowledgements
The authors acknowledge to CNPq, CAPES and FAPESP for financial support.
Table 7. Thermodynamic parameters of adsorption of Zn2+.
Langmuir model
T (K)
kd (L.g–1)
∆G (J.mol–1)
∆H (kJ.mol–1)
∆S (J.(Kmol)–1)
273 1.225 –460.87 –1.99 –5.13
298 1.286 –624.38 323 1.677 –1388.67 348 1.755 –1628.57
Table 5. Separation factor values (RL) for Zn2+ adsorption by
Bofe clay.
Bofe calcined Bofe sodium saturated
C0 RL C0 RL
1.92 0.41 2.1 0.75
4.9 0.21 4.5 0.58
10.2 0.11 10.4 0.38
22 0.06 21.7 0.22
34.1 0.04 41 0.13
44.7 0.03 65 0.09
55.5 0.03 70 0.08
95 0.01 90 0.06
188 0.01 190 0.03
Table 6. Zn2+ ion parameters obtained by fitting the Langmuir model.
Langmuir model
T (K) qm (mg.g–1) b(L.mg–1) R2
273 3.716 0.549 0.9648
298 4.304 0.767 0.9822
323 5.098 0.548 0.9652
348 6.137 0.268 0.9715
Figure 8. Isotherms of Zn2+ adsorption on calcined Bofe clay fitted
to Langmuir models at 293 K, 313 K, 323 K and 348 K.
Moreover, the maximum capacity adsorbed increases with the increase of the temperature of the process, indicating that the energy increase favors the removal of zinc on the clay surface, and this can be attributed to the fact that by increasing temperature of the solution, the mobility of molecules also increases and, therefore, easing the diffusion of Zn2+ in the clay. Kubilay et al.6 performed experiments
of zinc adsorption on bentonite clay and observed the same trend, i.e., as the temperature increases, the amount of adsorbed ion also increases. Table 6 lists the parameters obtained from these adjustments.
To verify the effect of temperature on zinc adsorption by calcined Bofe clay, the thermodynamic parameters enthalpy (∆H), entropy (∆S) and Gibbs free energy (∆G) were calculated and presented in Table 7.
The negative value and the value lower than 40 kJ.mol–1
of ∆H indicate that Zn2+ adsorption on calcined Bofe clay
References
1. Toor M and Jin B. Adsorption characteristics, isotherm, kinetics, and diffusion of modified natural bentonite for removing diazo dye. Chemical Engineering Journal. 2012; 187:79-88. http://
dx.doi.org/10.1016/j.cej.2012.01.089
2. Parolo ME, Avena MJ, Pettinari GR and Baschini MT. Influence of Ca2+ on tetracyline adsorption on montmorillonite.
Journal of Colloid and Interface Science. 2012; 368:420-426.
PMid:22189389. http://dx.doi.org/10.1016/j.jcis.2011.10.079 3. Ghorbel-Abid I, Galai K and Trabelsi-Ayadi M. Retention of
chromium (III) and cadmium (II) from aqueous solution by illitic clay as a low-cost adsorbent. Desalination. 2010; 256:190-195. http://dx.doi.org/10.1016/j.desal.2009.06.079
4. Jiang MQ, Jin XQ and Chen ZL. Adsorption of Pb (II), Cd (II), Ni (II) and Cu (II) onto natural kaolinite clay.
Desalination. 2010; 252:33-39. http://dx.doi.org/10.1016/j.
desal.2009.11.005
5. Arias F and Sen TK. Removal of zinc metal ion (Zn2+) from its aqueous solution by kaolin clay mineral: A kinetic and equilibrium study. Colloids and Surfaces A: Physicochemical
and Engineering Aspects. 2009; 48:100-108. http://dx.doi. org/10.1016/j.colsurfa.2009.06.036
6. Kubilay S, Gürkan R, Savran A and Sahan A. Removal of Cu(II), Zn(II) and Co(II) ions from aqueous solutions by adsorption onto natural bentonite. Adsorption. 2007; 13:41-51.
http://dx.doi.org/10.1007/s10450-007-9003-y
7. Veli S and Alyüz B. Adsorption of copper and zinc from aqueous solutions by using natural clay. Journal of Hazardous
Materials. 2007; 149:226-233. PMid:17560022. http://dx.doi.
org/10.1016/j.jhazmat.2007.04.109
8. Abollino O, Giacomino A, Malandrino M and Mentasti E. Interaction of metal íons with montmorillonite and vermiculite. Applied Clay Science. 2008; 227-236. http:// dx.doi.org/10.1016/j.clay.2007.04.002
9. Tito GA, Chaves LHG, Ribeiro S and Souza, RS. Isotermas de adsorção de cobre por bentonita. Revista
Caatinga. 2008; 21(3):16-21.
10. Santos PS. Ciência e tecnologia de argilas. São Paulo: Edgard
Blücher Ltda.; 1992.
11. Guarino AWS, San Gil RAS, Polivanov and Menezes HSMC. Characterization of a Brazilian Smectite by Solid State NMR and X-Ray Diffraction Techniques. Journal of the
Brazilian Chemical Society. 1997; 8(6):581-586. http://dx.doi.
org/10.1590/S0103-50531997000600004
12. Stumm W. Chemistry of the Solid-Water Interface. Nova York,
John Wiley & Sons; 1992.
13. Akar ST, Akar T, Kaynak Z, Anilan B, Cabuk A, Tabak Ö et al. Removal copper (II) ions from synthetic and real wastewater by the combined action of dried Trametes versicolor cells and montmorillonite. Hydrometallurgy. 2010; 97:98-104. http:// dx.doi.org/10.1016/j.hydromet.2009.01.009
14. Šljivić M, Smičiklas I, Pejanović S and Plećaš I. Comparative study of Cu2+ adsorption on a zeolite, a clay and a diatomite
from Serbia. Applied Clay Science. 2009; 43:33-40. http:// dx.doi.org/10.1016/j.clay.2008.07.009
15. Özdemir G and Yapar S. Adsorption and desorption behavior of copper ions on Na-montmorillonite: Effect of rhamnolipids and
pH. Journal of Hazardous Materials. 2009; 166:1307-1313.
P M i d : 1 9 1 7 8 9 9 9 . h t t p : / / d x . d o i . o r g / 1 0 . 1 0 1 6 / j . jhazmat.2008.12.059
16. Bhattacharyya KG and Gupta SS. Adsorption of a few heavy metals on natural and modified kaolinite and montmorillonite: A review. Advances in Colloid and Interface
Science. 2008; 140:114-131. PMid:18319190. http://dx.doi.
org/10.1016/j.cis.2007.12.008
17. Ayari F, Srasra E and Trabelsi-Ayadi M. Characterization of bentonitic clays and their use as adsorbent.
Desalination. 2005; 185:391-397. http://dx.doi.org/10.1016/j.
desal.2005.04.046
18. Bojemueller E, Nennemann A and Lagaly G. Enhanced pesticide adsorption by thermally modified bentonites. Applied
Clay Science. 2001; 18:277-284. http://dx.doi.org/10.1016/
S0169-1317(01)00027-8
19. Brindley GW and Brown G. Crystal structures of clay minerals and their X-ray identification. London: Mineralogical
Society; 1980.
20. Santos PS. Tecnologia de argilas: aplicada às argilas brasileiras.
São Paulo: Edgard Blücher Ltda.; 1975.
21. Ho YS and McKay G. The kinetics of sorption of divalent metal ions onto sphagnum moss peat. Water
Research. 2000; 34:735-742.
http://dx.doi.org/10.1016/S0043-1354(99)00232-8
22. Treybal RE. Mass transfert operations. 3rd ed. New York:
McGraw Hill; 1980.
23. Bhattacharyya KG and Gupta SS. Adsorptive accumulation of Cd(II), Co(II), Cu(II), Pb(II), and Ni(II) from water on montmorillonite: Influence of acid activation. Journal
of Colloid and Interface Science. 2007; 310:411-424.