*e-mail: [email protected]
bInstitut fuer Werkstofftechnik, Bremen, Germany
Received: July 28, 2011; Revised: January 23, 2012
In this investigation a DoE (Design of Experiments) analysis of distortion for a typical manufacturing process of pre-straightened, cold drawn and induction hardened AISI 1045 cylindrical steel bars was carried out. A careful characterization of the material, including residual stress states and geometrical changes, was done for the different manufacturing steps. In order to identify effects and correlations on distortion behavior, the investigated variables included the drawing process itself with two different drawing angles, a stress relief treatment, which was applied to one part of the samples, and, finally, induction hardening with two different case depths. Main and statistically significant effects on the distortion of the induction hardened samples were found to be in this order, the drawing angle, the stress relief treatment and the induction hardening depth. It was also found that the distortion potentials are transmitted from the drawing process to further manufacturing steps and, consequently, from one production site to the next.
Keywords: wire drawing, design of experiments, distortion potentials, residual stresses
1. Introduction
Manufacturing processes in general consist of materials solidification, metal forming and more than one straightening process, machining and heat treatment processes1,2.
Machining and final straightening is then necessary to guarantee the required shape and dimensions of the mechanical components. Cold forming significantly changes materials properties and, very often, cold formed automotive parts need a surface heat treatment or should be through hardened to fulfill strength requirements3. An improvement
of properties during one production step consequently can result in problems in the next, one of the following or, finally, in the last manufacturing step. Components manufactured in this way show a broad band of distortions, which have to be removed by additional expensive machining operations already in the hardened state4,5. It is well known that distortion
of components is connected to the whole manufacturing history and depends on5:
a) The components’ geometry;
b) The chemical composition and local variations; c) The mechanical history of the components; d) On local time-temperature sequences during
manu-facturing;
e) On the (local) microstructure and phase transforma-tions at temperature;
f) As well as on the generation and relaxation of stresses/ residual stresses.
Quite a high number of references describe properties of the drawing process itself, materials properties and residual
stress states3,7, as well as, give some possibilities to optimize
residual stress states6. The research in this field began as
early as in the fifties and sixty years of the last century, since high tensile residual stresses were a main cause of fracture in drawn wires. The manufacturing chain in this investigation consists of a pre-straightening and shot blasting before the drawing process8. A design of experiments plan
with main affecting parameters, as the drawing process itself with two different drawing angles, a stress relief treatment, which was applied to one part of the samples, and, finally, induction hardening with two different case depths were used to identify effects and correlations of these parameters on distortion. In a first attempt, also a simulation of the drawing process was used to clarify possibilities and limits of this method in the analysis, depending on the available input data.
2. Materials and Microstructures
microstructure in Figure 1 is a banded structure with higher and lower amounts of Pearlite. Statistical evaluation of microstructures resulted in mean grain sizes of ASTM®
10 to 11 (ASTM® E112 standard). Grain size distributions
varied depending on the location of specimens prepared for the micro-structural analysis.
A microstructure of induction hardened samples is shown in Figure 2. Microstructures at higher magnifications present fine Martensite in near surface layers. Some isolated ferrite can be identified up to 10 µm distance from the surface due to some decarburizing. As X-ray diffraction and Synchrotron radiation analysis proved, retained austenite is present to a low amount until 50% of the case depth due to the inhomogeneous distribution of ferrite and pearlite lines (Figure 1). Figure 2 also displays hardness distributions for the two induction hardening depths. Case depths are indicated in the Figure 2. The case depth is measured at HV = 550 HV1 to be 0.63 and 1.21 mm.
3. Experimental Details
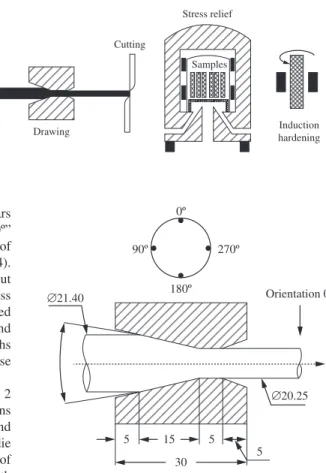
Figure 3 presents the investigated manufacturing chain starting with the hot rolled AISI 1045 steel wire coils,. The initial mean nominal diameter of the hot rolled wire is 21.46 mm. The geometry of the wire however varies along its length and exhibits variations of the nominal diameters from 21.31 to 21.76 mm. This wire is vertically and horizontally straightened, shot blasted and then drawn to a diameter of 20.25 mm. The drawing angle can be set to 15° or 20° (drawing semi-angle α = 7.5° and 10°). Using the mean diameters, an area reduction of 11.6% resulting from the drawing process can be calculated. New tools with polished surfaces have been used for each drawing experiment which was carried out.
Figure 1. Macro image of a radial cross section (a), axial microstructure of the material (b).
Table 1. Chemical composition of the investigated AISI1045 steel.
Element C Si Mn P S Cr Mo Ni Cu Nb
Mass% 0.43 0.24 0.79 0.03 0.02 0.13 0.03 0.08 0.1 <0.01
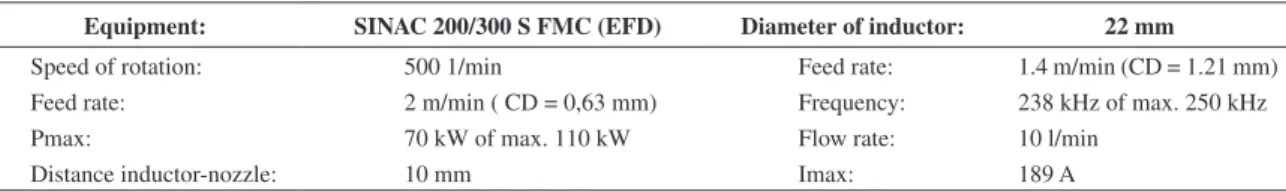
Marked peripheral angular positions around the bars gave a reference for the dimensional analysis. The “0º” position is a horizontal line on the upper most position of the rods as they pass through the drawing tool (Figure 4). From the drawn bars, samples of 200 mm length were cut for any further analysis. A part of the samples was stress relieved in a vacuum furnace with the help of a pressurized nitrogen atmosphere of 2 bar at temperatures of 600 °C and finally induction hardened with two different case depths of 1.21 and 0.63 mm, another part of the samples was case hardened without a previous stress relief treatment.
The Design of Experiments (DoE) plan in Table 2 was executed with 3 samples for each run. The variations which were analyzed in the process are indicated as 1 and –1 in Table 2, meaning the drawing of samples using a die angle of 15° or 20°, stress relief applied at a temperature of 600 °C or no stress relief, and, finally, case hardening with a depth of 0.63 or with a depth of 1.2 mm. All combinations following these variations of the manufacturing process were investigated as indicated in Table 2.
Dimensional analysis after drawing, stress relief and induction hardening were carried out with a Zeiss Contura G2 3-D machine and a Leitz PMM 654 machine. Prior to each measurement series, the machines were positioned in their original position at point 0, 0, 0 and afterwards a standard sphere was measured. Each cylinder was clamped in the central plane with the 0° line always pointing to the top. Twelve (12) circles of measurement were used to define the shape and size of the cylinders with 360 points each at 2, 8.5, 16, 25, 50, 70, 130, 150, 175, 184, 191.5 and 198 mm of distance from one end of the sample. Each circle then was fitted with a best fit circle by a least squares method9. From these calculations, center positions of each
circle then were known. The further data evaluation again followed the procedure given by Frerichs10. The projection
of these centers on imaginary x-y planes in the axial center of each bar creates a vector. The length of this vector is an expression of the curvature. The software MINITAB® was
used for the statistical evaluation of the DoE. The software uses Student’s distributions (effects with unknown variance) for the evaluation of distortion data. As each manufacturing variable, at first sight, shows a different distribution of the data with a different mean value and a different variance, standardization is required and displayed in the results. This standardization (a z-transformation) gives to random variables a mean value zero and variance one. Effects from manufacturing variables are calculated for a statistic significance of α = 0,02 (98%).
The preparation of metallographic images followed standard procedures. Samples were embedded in resin and ground in automatic machines with waterproof SiC grinding paper successively with 220, 400, 600, 1000, and 1200 grit. Following, polishing using diamond fluids with a mean grain size of 1 µm gave a mirror like surface. Polished surfaces were etched with 2 Vol. % HNO3 in alcohol and fully computerized images were acquired in an optical microscope with 8, 100, 200 and 500 fold magnification. Hardness measurements were done on the metallographic cross sections with an automatic Vickers hardness tester (instrument ZHV1-a of Zwick-Roell company). For the detection of local inhomogeneities, a series of hardness indentations were distributed on radial
Figure 3. The investigated manufacturing chain.
Figure 4. Dimensions of the drawing tool with orientations in the analyzed bars.
Table 2. Design of experiments plan.
Drawing angle Stress relief Induction hardening
1 –1 1
–1 1 –1
1 1 –1
–1 –1 –1
–1 –1 1
1 1 1
1 –1 –1
–1 1 1
cross sections along the 0° to 180° line, along the 45° to 225° line, along the 90° to 270° line and along the 135° to 315° line. Vickers indentations with a load of 100 grams (HV0.1) each at distances of 0.25 mm with a total number of 316 measurements then gave information about local variations of hardness.
X-ray diffraction analysis (XRD) of residual stresses used the conventional sin2
ψ-method with a conventional Bragg-Brentano Geometry (Bruker-AXS D8) equipped with Vanadium filtered Cr-Kα-radiation. A primary beam aperture of 2 mm diameter was selected for the local analysis along the length and around the periphery of the drawn cylindrical bar samples. Residual stress fields at each 45° around the periphery and up to 32 points axially were able to detect local differences as suggested earlier11,12.
The {211}-lattice planes of α-iron were measured and any further measurement procedure and evaluation followed procedures of13. Due to the normalized materials state and
well defined X-ray diffraction lines, the standard deviation of measurements typically was ±6 to ±8 MPa. The 1045 steel contains 6.7 Vol. % of Cementite (Fe3C). Neutron diffraction or X-ray diffraction analysis determine phase stresses and macrostress calculation requires measurements in each phase. Literature results of residual stresses in Cementite after drawing processes with very high tensile residual stresses in axial direction of more than 2000 MPa cannot be neglected14-16, as comparison with simulation proved17.
Hoop and radial direction gave high compressive residual stresses in the Cementite (–1500 MPa) and consequently corrections must be done to calculate macro residual stresses
according to the Equation 1. Where,
σ
macroRS are the macroresidual stresses, σRSFe C3 are the residual stress in cementite,
f is the phase content and σRSFe are the residual stresses in ferrite (Equation 1).
3 (1 )
RS RS RS
macro f Fe C f Fe
σ = • σ + − • σ (1)
As the phase contents are known from the Fe-Fe3C equilibrium phase diagram, macro residual stresses can be calculated any time using reference data. Measurements of residual stresses always concentrated on axial residual stresses as samples show a clear bending state of distortion. Some measurements of hoop direction proved a quite reasonable symmetry of residual stress states, with almost equal values of axial and hoop direction.
The neutron diffraction residual stress measurements were performed at the Helmholtz Zentrum Berlin, in Berlin, Germany on beam line E3 of the BER II reactor. The primary beam path was composed by a segmented elastically bent Silicon monochromator with a mask of 2 by 2 mm close to the samples surface. The diffracted beam with
an aperture of accordingly 2 mm in width and no height limitations was recorded with a 3He Position Sensitive Detector of 300 × 300 mm size, using 256 × 256 channels. A diffractometer with automatic xyz-translation table was used. Further details about the equipment of the beam line can be found in18,19. Standard deviation of measurements was
typically around ±25 MPa. Measurement procedures and sequence of calculating force equilibriums of macro residual stresses and iteratively corrected d0 values for the neutron diffraction residual stress determination are discussed in20.
Table 3, finally, contains information about applied induction hardening parameters. A specially designed unit for multi frequency induction heat treatments from EFD in Germany (type SINAC 200/300 FMC) was used for induction heat treatments. All bars were clamped between end faces of the cylinders, forced to rotate with speeds given in Table 3. The inductor was firstly placed at the bottom of the bar and then moved upwards with the indicated feed rate to result in the desired induction hardening depth.
4. Results
Following, possible effects of distortion potential carriers on distortion of initially drawn components are described. For the distortion potential carriers; chemical composition and microstructure, some local chemical and microstructural differences could be verified, as shown in Figure 1 of section 2. More data could be easily acquired for distortion potential carrier residual stresses. Results of strength after the drawing process together with residual stress states are presented for documentation of changes after this manufacturing step. Finally results of the DoE analysis of the investigated manufacturing process are given.
4.1.
Results ahead of the drawing process
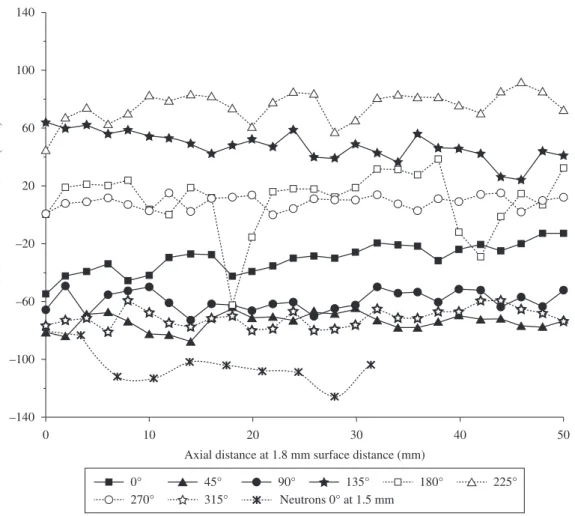
The first step in the manufacturing process after uncoiling is a pre-straightening and a shot blasting to remove hot rolling scale. Consequently residual stress states in the bar cannot be zero. Figure 5 gives an image of residual stress states in pre-straightened bars as a function of axial distance along the length of the bar. No correction for second phase residual stresses was applied in this case as it was assumed that phase stresses in the Cementite would be close to zero. To avoid any effect from the shot blasting process all these measurements have been done at 1.8 mm distance from surface and so far were able to separate effects from the pre-straightening and the shot blasting procedure. Depth’s corrections of residual stresses for layer removal of cylindrical bodies have been applied20.
These residual stresses as determined by X-ray diffraction show varying quantities along the length of the bar. Results show furthermore that for 135°, 180° and 225° angular
Table 3. Parameters of the induction hardening treatment.
Equipment: SINAC 200/300 S FMC (EFD) Diameter of inductor: 22 mm
Speed of rotation: 500 1/min Feed rate: 1.4 m/min (CD = 1.21 mm)
Feed rate: 2 m/min ( CD = 0,63 mm) Frequency: 238 kHz of max. 250 kHz
Pmax: 70 kW of max. 110 kW Flow rate: 10 l/min
positions, positive values of residual stresses occur, whereas more or less at 315°, 0°, 45° and 90° positions, compressive residual stresses have been measured. The wire after pre-straightening consequently contains a pronounced state of bending residual stresses for all axial distances measured. Some data points at –100 MPa indicate results from neutron diffraction analysis for a 0° angular position in similar depth of 1.5 mm. A good correlation can be found between neutron diffraction results and X-ray diffraction results after
d0-correction. In Figure 6 a macro residual stress distribution throughout the cross section of a pre-straightened sample measured by means of neutron diffraction is presented. Radial distances have been normalized to the radius of the sample. In Figure 6 the center of the sample therefore is at zero. Radial distances have been put to square for axial direction and to normalized radial distance for radial and hoop direction. In this way the equilibrium of forces in axial and hoop direction can be verified. Normalized and squared values for the axial direction have partially been given a negative sign to gain a complete residual stress distribution along one diameter. Small negative residual stress values at the centre are observed which are shifted to tensile values of 70 MPa for r2 = 0.5. As expected from the
shot blasting, in this complete analysis over the whole cross section, near the surface, axial and hoop residual stresses
Figure 5. Measured residual stresses (XRD analysis) plotted against the axial distance along the length of one sample. Neutron diffraction data at 1.5 mm surface distance see lowest line. Overview of a residual stress field in pre-straightened bars at a surface distance of 1.8 mm.
are shifted to compression. These measurements indicate an inhomogeneous residual stress distribution over the cross section of bars ahead of the drawing. Due to the change from positive to negative values of residual stresses a bending state of residual stresses is also obvious from the results in Figure 6. The pre-straightening process is continuous, but with varying loads inhomogeneous residual stress states in the axial direction are expected. X-ray diffraction analysis of the shot blasted surface give similar quantities to the ones found by neutron diffraction, if neutron diffraction results are extrapolated to the surface. The open squares and triangles in Figure 7 result from X-ray diffraction measurements and, despite the different volume elements of the two stress analysis methods, a good correlation is present.
4.2.
Results after the drawing process
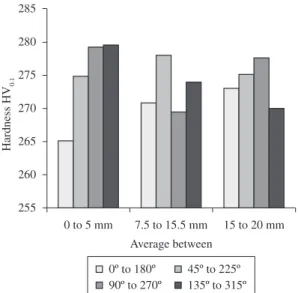
From the results in section 4.1, it is expected that local in-homogeneities along the axial direction and in cross sections should be present after drawing. Therefore a locally different mechanical history of drawn bars should contribute to distortion. Local in-homogeneities after drawing should find their expression in local micro-hardness variations. Radial cross sections of bars drawn with 20° and 15° drawing angle were analyzed with a 316 individual HV0.1 hardness indentations. As expected for Vickers hardness measurements with small loads, the scattering of individual data points is high. To overcome problems with high scattering, mean values of hardness were calculated in the following way: for each measured diameter line, means of hardness were determined for the first 5 mm (0 to 5 mm), for distances between 7.5 and 12.5 mm and between 15 to 20 mm. Figure 7, as one example, presents results for the 20° drawing angle. As an example for the diameter line 0° to 180°, the average between 0 and 5 mm is a layer near the 0° surface, the average between 15 and 20 mm is a layer near the 180° surface. A small increase in hardness can be found from lowest values around the 0° position (0 to 5 mm) with an increase at the center of the bar (7.5 to 12.5 mm) and highest values at the 180° position. On the other hand the 90° to 270° line (the 135° to 315° line too) seem to have high hardness values near the surface and lower values in the center. These average hardness differences are small and do not exceed 15 HV0.1 with a standard deviation of ±5 HV0.1. On the other hand, Figure 7 gives an idea of an asymmetry of mechanical properties around the periphery and in the cross section of drawn bars.
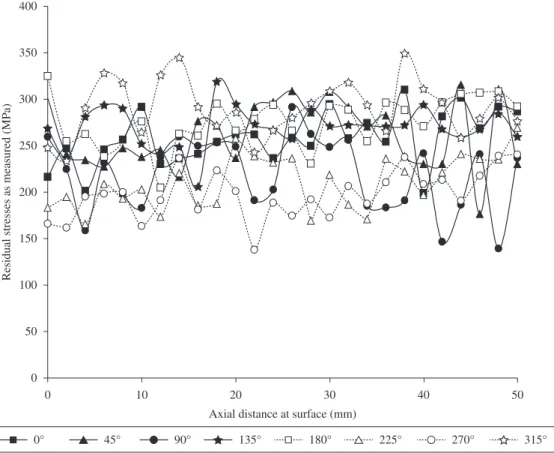
Similar results as in Figure 5 are given in Figure 8 after the drawing process. Again results for the drawing angle of 20° are presented. Measured axial residual stresses are given and second phase residual stresses in Cementite have been neglected for this XRD surface analysis. For each measured axial line, 26 data points are displayed. Surface tensile residual stresses are present after drawing. Local variations of almost a factor of 2 occur between individual residual stress data points (see e.g. the data of the 90° line). Minimum values of 150 MPa and maximum values of 300 MPa are observed. This variation of surface residual stress values was detected for almost every analysis done around the periphery of drawn bars and can be correlated with locally different friction coefficients and slip stick effects22. This variation
should be clearly separated from statistical scattering in the X-ray diffraction analysis. As mentioned, mean standard deviation of all XRD-measurements did not exceed 8 MPa and so far is only 10% of the observed variations from the manufacturing. After the drawing process, a macro residual stress distribution through the cross section of a central plane is presented in Figure 9. Macro residual stresses have been calculated with Equation 1 from Neutron diffraction analysis. As expected high tensile residual stresses of up to 450 MPa for the axial and hoop direction were observed in surface layers and compressive residual stresses of –450 MPa are present in the center of the bars for the balance of forces. Radial residual stresses in near surface layers are zero and show compressive values of up to –200 MPa in the center of the bar. Radial residual stresses are calculated after force equilibrium for axial and hoop directions with the d0 value then obtained and, consequently, are the result of calculations for axial and hoop direction. Similar results have been obtained for the drawing angle of 15°. Differences to the 20° drawing angle do not exceed 50 MPa concerning the asymmetry of residual stresses around the periphery and concerning the distribution of residual stresses in the cross section.
4.3.
Results after stress relief treatments
Residual stress relief for a 1045 material in different material states can be calculated according to the data given in23. Residual stress measurements at the surface
and in 50 µm distance from the surface proved to be near zero. Therefore, it is obvious that drawing induced residual stresses could be relieved totally after annealing at 600 °C for one hour. Consequently samples after stress relief were subjected to induction heat treatments almost free of macro residual stresses.
4.4.
Materials states in induction hardened bars
Induction hardened bars can be characterized as follows: stress relieved bars will consist of a hardened
layer with hardness depth’s profiles from Figure 2b and compressive residual stresses in that layer. A strong gradient to tensile residual stresses is present in the transition zone to normalized material. Low residual stresses exist in the remaining cross section for equilibrium reasons. Similar materials properties can be expected for induction hardened bars as after drawing, with the exception that probably a superimposition of drawing induced residual stresses and those from induction hardening cannot be excluded. Maximum tensile residual stresses after induction hardening would occur at surface distances where tensile residual stresses have been left from the drawing process. Differences in distortion accordingly can be expected. High compressive axial residual stresses up to a maximum of –650 MPa are presented in Figure 10. The residual stress state in the hardened layer is rotationally symmetric and similar values occur for axial and hoop directions as proven by XRD-analysis. With increasing surface distance, residual compressive stresses decrease and are shifted to tensile residual stresses. In Figure 10 residual stresses measured by Neutron diffraction after force equilibrium calculation are presented and plotted against normalized r2 for the
axial direction and against normalized r for hoop and radial directions. As the abscissa contains two different scales, maximum tensile residual stresses apparently occur at different normalized radial positions, but in reality at same distance from bar center. These maximum tensile residual stresses of 400 MPa, which are present at 80% of the radius
Figure 8. Measured residual stresses (XRD analysis) plotted against the axial distance along the length of one sample. Overview of an axial residual stress field after drawing with drawing angle 20°.
With the chosen simple geometry of cylindrical bars received immediately after the drawing process, effects of macroscopic geometrical changes probably are minimized. Cold drawing processes however significantly change occur just beneath the induction hardened layer and exhibit
similar magnitudes for hoop and axial directions.
4.5.
Analysis of distortion data
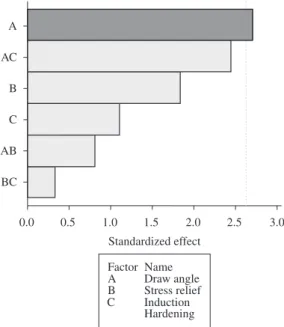
Results of distortion after induction hardening are summarized in Figure 11. As expected individual samples show different amounts of distortion and mean values are different between bars manufactured with 15° drawing angle and 20° drawing angle respectively. All samples showed a clear bending of the bars and mean values and standard deviation are calculated to 39.7 ± 24 µm (20°) and to 59.6 ± 24 µm (15°). Evaluations of the DoE-plan from Table 2 were done for a significance level of 98%. Figure 12 demonstrates a consistent dependence of distortion from one single parameter: the drawing angle. Independently if first, second or third order interactions were analyzed, only the drawing angle gives the required level of significance. Mean values of distortion from the statistical analysis with the MINITAB software can be found in Figure 13 and these results are summarized in Table 4. In industrial production, a value of almost 100 µm (97.42 µm) for a bar of 200 mm in length is normally unacceptable. As known, additional polishing and straightening processes are used. These mean distortion values can be reduced as indicated in the upper left part of Figure 13 by the higher drawing angle of 20°. A stress relief treatment at 600 °C also reduces the mean distortion vector from 110 to 86 µm. The higher case hardening depth superimposes this beneficial effect of stress relief and raises mean distortion values from 87 to 119 µm.
5. Discussion
This investigation followed the systems approach of distortion engineering depending on selected parameters of the total manufacturing process. As far as possible carriers of distortion potential should be identified as they are: geometry, chemical composition, mechanical history, microstructure, temperature and residual stresses.
Figure 10. Distribution of residual stresses in an induction hardened shaft (CD = 0.63 mm).
Figure 11. Values of distortion vector in the investigated DoE plan.
Table 4. Numeric results of main identified effects after each step of the manufacturing chain, values taken from Figure 13.
Effect of Parameter/distortion
Drawing angle [°] / Distortion [µm]
15° 20°
117.6 µm 79.0 µm Stress relief [°C] /
Distortion [µm]
No stress relief 600 °C 1 hour 110.0 µm 85.9 µm Induction hardening [µm]/
Distortion [µm]
CD 0.63 mm CD 1.21 mm 87.3 µm 108.6 µm
materials properties and mechanical history as well as the residual stress state. Consequently the analysis of residual stress states in the manufacturing process identified changes of distortion potentials after each manufacturing step. Minimizing residual stresses after cold drawing by a stress relief treatment reduced the mean distortion level after induction hardening of the analyzed collection of samples by 24 µm. As expected, a higher induction hardening case depth then is responsible for an increase of another 21 µm due to time and temperature dependent phase transformations and the development of elastic-plastic and transformation-strains, as well as, transformation induced plasticity. Additional difficulties arise from the fact that stationary microstructures in induction hardening cannot be expected due to small holding times24. Significant changes
in properties, as strength and ductility, and microstructure and a different distortion potential are the consequence, if compared with conventional martensitic hardening processes25,26.
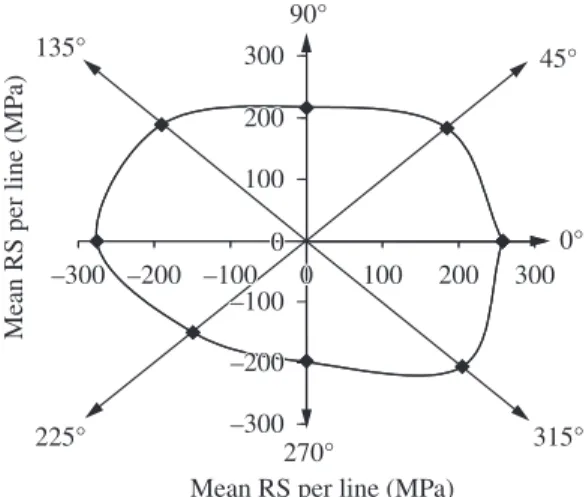
A significant effect on distortion of drawn bars however results from the drawing itself. Only 38 µm difference can be observed for the two different drawing angles at a general high amount of bending at all. The pre-straightening induced a bending state of residual stresses (Figure 5). As with elastic-plastic bending in different directions (Figure 3) locally different strain hardening would result in radial and axial gradients in mechanical properties. As Figure 14 demonstrates, the as-delivered pre-straightened material additionally is not circular and has locally strong dimensional differences in axial and radial direction. As scatter between residual stresses after drawing in Figure 8 is obvious, a mean value for 26 data points along one measured axial line should be able to omit effects of local friction and slip stick in drawing and should be able to demonstrate variations around the periphery of the bars. Mean values of residual stresses are plotted in a polar diagram (Figure 15). The polar diagram has been constructed by multiplying sine and cosine parts of the measured angles with mean values of residual stresses for a particular measured axial line.
A drawing process on first sight is seen as a circular symmetric process and equal means of residual stresses are expected around the measured periphery. Figure 15 however proves that measurements in directions 0° and 180° give higher mean values of residual stresses and directions 90° and 270° result in lower ones (see the different hardness values in Figure 7). Obviously after drawing there is also a bending state of residual stresses present and it is the question if this state of residual stresses was transferred from
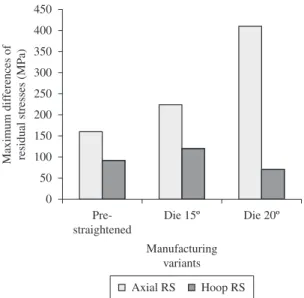
the pre-straightening or was induced during the drawing process, as additionally pointed out in Figure 16. Figure 16 displays maximum differences of residual stresses occurring in cross sections after different manufacturing steps. These differences in residual stresses may contribute to the high amount of distortion directly after the drawing step. As residual stress differences are higher with a 20° drawing angle, high differences counteract probably the geometrical differences in pre-straightened bars.
Figure 13. Total mean of the distortion vector value and effects of parameters of single manufacturing steps.
Figure 14. Geometrical variations of pre-straightened material.
6. Conclusions
A design of experiments plan with main manufacturing parameters of cold drawing, stress relief and induction hardening was used to identify effects and correlations on distortion potentials. The highest effect on distortion of drawn bars after induction hardening resulted from the
drawing process itself. Pre-straightened material is not circular and has locally strong dimensional differences in axial and radial direction as well as inhomogeneous residual stress states, which contribute to distortion after drawing together with small deviations during this process. Minimizing residual stresses after cold drawing by a stress relief treatment reduced the mean distortion level of the analyzed collection of samples. A higher induction hardening case depth is responsible for an increase of distortion of the analyzed cylindrical bar samples. The distortion potentials in the manufacturing of induction hardened automotive components also depends on materials properties induced in previous manufacturing steps.
Acknowledgements
This work was developed in the frame of the “BRAGECRIM” program (Brazilian German Cooperation Research Initiative in Manufacturing). The authors are deeply indebted to DFG, CAPES, CNPq and Finep for financial support and to HZB Berlin (neutron diffraction measurements). Preliminary cooperation also would not have been possible without support from DAAD and CAPES. The neutron diffraction analysis has been supported by the European Commission under the 7th Framework
Program through the Key Action: Strengthening the European Research Area, Research Infrastructures: Contract nº 226507 (NIMI3).
Figure 16. Maximum differences of residual stresses in cross sections throughout the manufacturing process.
References
1. Hoffmann F, Keßler O, Lübben TH and Mayr P. Distortion Engineering - Verzugsbeherrschung in der Fertigung. HTM. 2002; 57(3):213-217.
2. Thoben KD, Lübben T, Clausen B, Prinz C and Schulz A. Distortion Engineering”: A System-Oriented View on the Distortion of Component-Parts. In: Proceedings of the 4th International Conference on Quenching and Control of Distortion; 2003; Beijing, China. Chinese Heat Treatment Society; 2003. p. 325-331.
3. Wang Z and Gong B. Residual Stress in the Forming of Materials. In: Totten GE, Howes MAH and Inoue T. Handbook of residual stress and deformation of steel. Materials Park, Ohio: ASM International; 2002. v. 7, 499 p.
4. Lu J. Prestress Engineering of Structural Material: A Global Design Approach to the Residual Stress problem. In: Totten GE, Howes MAH and Inoue T. Handbook of residual stress and deformation of steel. Materials Park, Ohio: ASM International; 2002. v. 7, 499 p.
5. Zoch H-W. From single production step to entire process chain – the global approach of Distortion Engineering. In:
Proceedings of the International Conference on Distortion Engineering; 2005; Bremen. Bremen; 2005. p. 3-10. 6. Kuboki T, Yoshikawa H, Neishi Y, Kuroda K and Akiyama
M. Influence of back-tension on effect of skin pass in minimising residual stress levels after cold rod drawing. Ironmaking & Steelmaking. 2001; 28(2):117-121. http://dx.doi. org/10.1179/030192301678028
7. Atienza JM and Elices M. Influence of residual stresses in the tensile test of cold drawn wires. Materials and Structures. 2003; 36(262):548-552. http://dx.doi.org/10.1617/13917
8. Rocha AS, Nunes RM, Metz M and Hirsch T. Analysis of the distortion potential in AISI 1048 steel bars induced by a combined drawing-straightening process. In: Proceedings of the 2th International Conference on Distortion Engineering;
2008; Bremen. Bremen; 2008. p. 13-20.
9. Surm H, Kessler O, Hoffmann F and Mayr P. Effect of machining and heating parameters on distortion of AISI 52100 steel bearing rings. International Journal of Materials and Product Technology. 2005; 24(1-4):270-281. http://dx.doi. org/10.1504/IJMPT.2005.007954
10. Frerichs F, Landek D, Lubben T, Hoffmann F and Zoch HW. Prediction of distortion of cylinders without phase transformations. Materialwissenschaft und Werkstofftechnik. 2006; 37(1):63-68. http://dx.doi.org/10.1002/mawe.200500974
11. Krause H, Jühe H-H, Kopp R and Baldner K-R. Ziehverfahren beeinflusst Eigenspannungszustand, Röntgenographische Untersuchungen an Einzelproben von Draht und Rundstäben.
Drahtwelt. 1978; 11:428-432.
12. Krause H and Klinkenberg A. Messtechnische Vorraussetzungen für Eigenspannungsuntersuchungen an Drähten. Stahl und Eisen. 1981; 101:1427-1428.
13. Hauk V and Behnken H. Structural and residual stress analysis by nondestructive methods: evaluation, application, assessment. Amsterdam; New York: Elsevier; 1997. v. 14, 640 p. 14. Atienza JM and Elices M. Influence of residual stresses in the
stress relaxation of cold drawn wires. Materials and Structures.
2004; 37(269):301-304. http://dx.doi.org/10.1617/14008
S1359-6454(96)00051-1
17. Rocha AS, Nunes RM, Souza TF, Soares CAT, Haenisch S and Tekkaya AE et al. Experimental characterization and simulation of a wire drawing process and related distortion potentials. In:
Proceedings of the 3th International Conference on Distortion Engineering; 2011; Bremen. Bremen; 2011. p. 229-237. 18. Poeste T, Wimpory RC and Schneider R. The new and upgraded
neutron instruments for material science at HMI - current activities in cooperation with industry. Materials Science Forum. 2006; 524-525:223-228. http://dx.doi.org/10.4028/ www.scientific.net/MSF.524-525.223
19. Wimpory RC, Mikula PJ, Saroun T, Poeste J, Hoffmann M and Schneider R. Efficiency Boost of the Materials Science Diffractometer E3 at BENSC: One Order of Magnitude Due to a Horizontally and Vertically Focusing Monochromator. Neutron News. 2008; 19(1):16-19. http:// dx.doi.org/10.1080/10448630701831995
wires. Materials Science and Engineering: A. 2010; 527(13-14):3064-3072. http://dx.doi.org/10.1016/j.msea.2010.01.079
23. Löhe D and Vöhringer O. Stability of Residual Stresses. In: Totten GE, Howes MAH and Inoue T. Handbook of residual stress and deformation of steel. Materials Park, Ohio: ASM International; 2002. v. 7, 499 p.
24. Grosch J. Werkstoffseitige Grundlagen des induktiven Randschichthärtens. HTM. 1989; (44):205-209.
25. Braisch P and Rollmann J. Werkstoffkundliche Gesichtspunkte zur Beurteilung des Schwingfestigkeitsverhaltens induktiv randschichtgehärteter Bauteile. Materialwissenschaft und Werkstofftechnik. 2000; 31:66-80.