Inluence of the cable´s layout on the shearing
resistance of prestressed concrete beams
Inluência do traçado do cabo na resistência ao
cisalhamento de vigas de concreto protendido
a Instituto Federal do Amapá, Macapá, AP, Brasil;
b Universidade Federal do Pará, Faculdade de Engenharia Civil, Belém, PA, Brasil.
Received: 30 Apr 2015 • Accepted: 26 Apr 2016 • Available Online: 23 Sep 2016
O. A. SOUZA JUNIOR a
D. R. C. OLIVEIRA b
Abstract
Resumo
Little information on experimental investigations regarding the inluence of the prestressing forces in the shear resistance of prestressed beams is found in the technical literature. Thus, it was experimentally evaluated the shear resistance of six post-tensioned prestressed concrete beams with cross section of (150 x 450) mm2, total length of 2400 mm and concrete’s compressive resistance of 30 MPa, with the variables of this work being the layout of the prestressing cable, straight or parabolic, and the stirrups geometric rate. Verticals displacement, steel and concrete’s strains and a comparison of the experimental loads with the estimates of ACI 318, EUROCODE 2 and NBR 6118: 2014 codes are presented and discussed. The results showed that the cable’s parabolic layout increased the beams’ shear resistance in up to 16% when compared to beams with straight cables.
Keywords: prestressed concrete, shearing, beam.
Poucas informações relativas às investigações experimentais sobre a colaboração da protensão na capacidade resistente ao esforço cortante dos elementos estruturais protendidos, são encontradas na literatura técnica. Assim, foi avaliado experimentalmente o desempenho ao cisalha-mento de seis vigas de concreto protendido com cordoalhas engraxadas, seção transversal de (150 x 450) mm2, compricisalha-mento de 2400 mm e resistência à compressão do concreto de 30 MPa, sendo que as variáveis do trabalho foram o traçado do cabo de protensão, reto ou parabólico, e a taxa de armadura transversal. São apresentados os resultados para os deslocamentos verticais, deformação do aço e do concreto e as cargas últimas experimentais comparadas com as estimadas das normas ACI 318, EUROCODE 2 e NBR 6118: 2014. Os resultados mostraram que as vigas com traçado inclinado apresentaram aumento na resistência ao cisalhamento em até 16 % quando comparadas às vigas com cabos retos.
1. Introduction
In the design of reinforced concrete structures, tensile by bending generated by loading is resisted only by steel, delaying the crack-ing of the concrete. The reinforcement called passive reinforcement, intended to receive the tensile forces not absorbed by the concrete, working only when requested. In prestressed concrete structures the force applied on the cables is transmitted to the concrete, resist-ing the tensile stresses by lexure and assistresist-ing the passive rein-forcement. The prestressing reinforcement, called active reinforce-ment is placed in the structural elereinforce-ment not only to compress and generate the necessary compressive stress so that the concrete can absorb the tensile stresses generated by loadings, but also to resist to external loadings, providing many advantages, such as reduction of the shear forces by the action of the vertical component gener-ated by the prestressing. In the case of inclined cables, the increase of compressive stresses and reducing tensile stresses, vertical dis-placements and cracking reduction, with the structure remaining predominantly in the stage I along its useful life.
According Naaman [1], the longitudinal prestressing introduces in the concrete elements with inclined prestressed cables a vertical component that depends on the overall strength of the cable and
reduces the shear loading. Figure 1 shows a prestressed concrete beam with a section length dx and the components generated by prestressing. The prestressing also induces compressive stresses which contribute to reduce principal tensile stresses so that shear cracking seems more vertical. According to Leonhardt and Monnig [2] the struts inclination varies from 15º to 30º. However, in lengths with concentrated loads or on intermediate supports of continuous beams, for example, shear cracks appear and inevitably reach 45º. This paper aims to evaluate the contribution of prestressing in re-ducing of the shear forces in six beams through the vertical compo-nent generated by the inclination of the prestressing cables, being three with parabolic cables and three with straight cables, and for each cable´s layout three geometrical rates of stirrups were used, and the experimental results were compared to estimates of ACI 318 [3], EUROCODE 2 [4] and NBR 6118 [5] codes.
2. Available information
Some research tried to understand the parameters that inlu-ence the shear strength of prestressed concrete beams. Laskar and Hsu [6] studied the shear behavior of ive prestressed con-crete beams with 7620 mm length, average fc’ of 70.5 MPa, cross
Figure 1 – Prestressing components (Naaman [1])
Table 1 – Variables and failure modes of the beams tested by LASKAR and HSU [6]
Beam l
(mm) D (mm)
bf
(mm) bw
(mm) fc’
(MPa) a/d Traç.
ρw
(%) s (mm)
Vu
(kN)
Mu
(kN.m)
Failure mode
B1
7620 568 150 50
72,4 1,61 R 0,17 250 840,2 892 Web
shearing
B2 74,5 1,61 R 0,95 178 1040,8 1106
B3 64,6 1,61 P. 0,95 178 1014 1077
Flexure-shearing
B4 71,0 4,29 R 0,17 250 430 470
B5 64,5 4,29 P 0,17 250 450 490
section with efective height of 568 mm, with the transversal rein-forcement geometrical rate, the layout of the prestressing cable and the relationship between the shear span and the useful height (a/d) as variables. The beams B1, B2 and B4 presented straight layout and were designed to shear failure mode, with ratio a/d of 1.61, and B3 and B5 beams with parabolic layout, also with shear failure, showed ratio a/d of 4.29. The transverse reinforcement ra-tio of beams ranged from ρw = 0.17% for beams B1, B4 and B5
and of ρw = 0.95% for beams B2 and B3. Table 1 presents the test
parameters, beyond the ultimate experimental loads and failure modes.
It was observed that the cracking stress were higher for beams B1 and B2 with straight cables as compared to the beams with parabolic cables, B3 and B5, because the horizontal component of the cable. The beams with parabolic cables were more eicient in relation to the beams with straight cables against shear forces re-ducing around 10% these forces of the beams in relation to beams with straight cables. The experimental results also showed that the beams had two failure modes, according to the North American standard ACI 318/2011: lexure-shearing and web shearing. The beams that failure with web shear presented brittle fracture, while the beams that failure by lexure-shearing showed ductile
behav-ior. The beams with ratio a/d of 4.29 presented ductile failure com-pared to the beams with a/d of 1.61, showing the strong inluence
of this parameter on the shear strength of prestressed beams. The beams B1 and B2, which exhibited as variables just the transversal reinforcement rates, showed brittle failure due to the low ratio a/d, with the resistance of the beam B1 being 30% greater than that of the beam B2.
MacGREGOR [7] evaluated the inluence of the prestressing cable´s layout on the shear strength of twenty-two prestressed concrete beams with angle of inclination measured from the geo-metric center of the prestressing reinforcement, in the central sec-tion, till the longitudinal axis of the beam, ranging from zero to ten degrees. Table 2 presents the characteristics of the tested beams by MacGREGOR [7]. The behavior of the beams after initial crack (decompression state) was changed according to the inclination of the cables. For beams with higher inclinations of the cables was veriied an average resistance gain of 25%, from the formation of the irst crack till the failure, when compared to the other beams of lower inclinations. For beams with lower inclinations there was no signiicant increase in load, from the formation of the irst crack up to the failure. This was due to the horizontal component to the cables with lower inclinations be greater than for cables with higher
Table 2 – Characteristics of the MacGREGOR’s [7] beams
Beam fc’
(MPa)
bf (mm)
bw (mm)
d (mm)
σp
(MPa)
Φ
(Degree) Cables
AD.14.37 22.5
152
152
254
742 6.45 11
B.14.34 18.2
80
805 0.00 12
B.14.41 20.0 805 0.00 12
BD.14.18 43.0 861 2.70 13
BD.14.19 43.0 784 5.00 12
BD.14.23 26.6 693 10.00 11
BD.14.26 24.0 812 10.00 11
BD.14.27 24.0 777 2.22 11
BD.14.28 23.0 826 1.53 11
BD.24.32 18.6 770 1.88 11
BD.14.34 18.0 770 6.28 11
BD.14.35 20.0 770 2.38 11
BD.14.42 26.0 567 6.45 11
BV.14.30 28.0 861 3.25 11
BV.14.32 26.0 784 3.25 12
BV.14.34 25.0 868 2.70 12
BV.14.35 23.5 805 5.36 12
BV.14.42 20.0 840 6.80 13
CD.13.23 26.5
45
840 0.00 12
CD.13.24 25.0 784 3.40 12
CD.13.25 24.0 826 2.85 12
inclinations, leading to increase the tensions that cause cracks in beams with lower inclination cables.
2.1 Shear behavior of prestressed concrete beams
The shear bearing capacity of a prestressed concrete beam can be divided into two parts, one resisted by the concrete and its auxil-iary mechanisms described ahead, and the other resisted by trans-verse reinforcement. A beam, even without transversal reinforce-ment has the ability to resist to a certain intensity of shear force. Figure 2 shows the various components of the shear resistance mechanisms of beams without transversal reinforcement, except the component related to the arc efect according to ACI-ASCE 426 Comittee [8].
For reinforced concrete structures subject to shear forces, the amount of resistance due to concrete is the sum of several mecha-nisms capable of transmitting forces between the sections as the efect of the non-cracked concrete, and this mechanism occurs at not issured stretches of the beam (between two consecutive cracks) or in non-issured parts of issured elements (compression zone of a cracked section); the aggregate interlock that occurs between the two surfaces of a crack, and the contribution of the aggregates interlock to the shear strength depends on the open-ing of the crack and roughness of surfaces; the dowel action
ef-fect, where the longitudinal reinforcement resists a portion of the displacement caused by shear force due to the dowel action on the bar, and the dowel force in the longitudinal reinforcement bar depends on the bar stifness at the intersection with the crack; and the arc efect, which is a mechanism that occurs more signiicantly in beams with reduced span and confers an increase in their load capacity. In the case of beams subjected to concentrated loads, the intensity of the arc efect is related to the ratio a/d of the beam, where a is the distance from the point of application of load to the nearest support and d is the distance from the more compressed iber of the beam to the center of gravity of the longitudinal ten-sile reinforcement section. Beam with ratio a/d smaller than 1 may present cracks ranging from the loading application point to the supports. These cracks prevent longitudinal reinforcement shear low to the compression zone causing the element starts to behave like an arc and not as a beam.
2.2 ACI 318
According to ACI 318 [3], the shear strength of prestressed con-crete beams is based on the analogy of the modiied truss model, where Vn is the nominal shear strength, obeying the condition of being greater than the design shear force in the considered sec-tion, Vu, being presented in equations 1 and 2.
(1)
³
n u
V V
f
(2)
=
n
+
n
n c s
V
f
V
f
V
Where,
ϕ: reduction factor: 0,75; Vc: concrete parcel;
Vs: transversal reinforcement parcel.
The calculation of Vc parcel is based on the cracking pattern shown in Figure 3, where Vci force is responsible for the appearance of lexure cracks and Vcw force by the appearance of shear cracks in the web, calculated according to the equations 3 and 4. The value of the parcel Vc is the lower of the two.
(3)
0.05
æ
ö
=
ç
+
+
÷
>
è
ø
n
n n
n n
i creci c w p d
max
V M
V
f b d
V
(
0.14
n
f b d
cn n
w)
M
l
(4)
(
0.29
0.3
)
=
n n
+
n
n n
+
cw c pc w p
V
l
f
f
b d V
Figure 2 – Forces acting in an inclined
crack (ACI-ASCE Committee 426 [8])
Where,
λ: concrete´s mechanical properties modiication factor, equal to 1;
fc: concrete´s compressive strength;
bw: beam´s width;
dp: length between the more compressed iber to the gravity center
of the prestressed reinforcement, not less than 0,8∙h; Vd: shear force on the cross section due to self-weight;
Vi: shear force on the cross section due to external loading acting with Mmax;
Mmax: maximum bending moment due to external loading;
Mcre: bending moment that generates lexure cracking on the cross
section due to external loading;
fpc: concrete´s compressive strength at the cross section center which resists to the external loading;
Vp: vertical component of the prestressed force.
2.3 EUROCODE 2
The EUROCODE 2 [4] speciies two methods for calculating the shear strength as a function of the presence or absence of transverse rein-forcement. For no shear reinforcement elements (Equation 5) resis-tance is expressed as Vc. For elements with shear reinforcement, re-sistance is the higher of VRds and VRd,max, shown in equations 6 and 7.
(5)
(
)
13,
=
é
ê
,100
+
1ù
ú
ë
n n
n n
n
û
n n
Rd c Rd c l ck cp w
V
C
k
r
f
k
s
b d
(6)
,
=
swn n
n
Rd s
A
ywdV
z f
cot
s
q
(7)
,
=
+
n n n n
cw w cd
Rd max
b z
f
V
cotg
tg
a
n
q
q
With,
VRd,c: design shear resistance for no shear reinforcement elements;
VRd,s: parcel from shear reinforcement;
VRd,max: concrete strut maximum strength;
CRd,c: factor with value of (0.18/γc);
200 1 2.0
= + ≤
k d
, with d in mm;
ρl: geometric rate of lexure reinforcement;
k1: factor with value of 0.15;
σcp: concrete´s compressive strength due to prestressing, in MPa;
d: cross section useful depth, from the center of the prestressing reinforcement till the more compressed iber, in mm;
Asw: shear reinforcement cross section area;
s: stirrups spacing;
z: lever arm equal to 0.9 d, with d in mm;
fywd: desig yield stress of the shear reinforcement;
v: 0.5 for ≤60 c
f MPa and 0.6 for ≥60 c
f MPa, since the shear
re-inforcement stress be not higher than 80% of the characteristic yield stress.
2.4 NBR 6118
NBR 6118 [5] presents two calculation models based on truss model analogy, associated with complementary bearing mecha-nisms developed within the structural element and represented by an additional component Vc. The model I considers checking the compressed diagonal VRd2 (Equation 8) and tensioned diagonal
VRd3 (Equation 9). The strut inclination θ=45° in relation to the
lon-gitudinal axis of the structural element.
(8)
2
=
0.27
n n n n
Rd v cd w
V
a
f b d
(9)
3
= +
Rd c sw
V
V V
Where, αv = (1-fck/250);
Vsw = (Asw/s)∙0.9∙d∙fywd∙(sen α + cos α);
Vc= 0 for tensioned structural elements when the neutral axis is out of the cross section;
Vc = Vc0 for simple lexure and tension-lexure with the neutral axis
in the cross section;
Vc = Vc0 (1+ M0/MSd,max) ≤ 2 Vc0 for compression-lexure, with: Vc0= 0.6∙fctd∙bw d
fctd= fctk,inf/γc
The model II also consider checking the compressed diagonal VRd2
(Equation 10) and tensioned diagonal VRd3 (Equation 11). In this case, the strut inclination varies between 30º and 45º.
(10)
(
)
2
2
=
0,54
n
2n n n n
sin
cot
+
cot
Rd v cd w
V
a
f b d
q
a
q
(11)
3
=
+
Rd c swV
V V
Where,
Vsw= (Asw/s)∙0,9∙d∙fywd∙ (cotg α + cotg θ)∙sem α
Vc= 0 for tensioned structural elements when the neutral axis is out of the cross section;;
Vc = Vc1, for simple lexure and tension-lexure with the neutral axis
in the cross section;
Vc = Vc1 (1+ M0/ MSd,max) < 2∙Vc1 for compression-lexure, with: Vc1 = Vc0 when VSd ≤ Vc0
3.
Experimental program
3.1 Beams’ characteristics
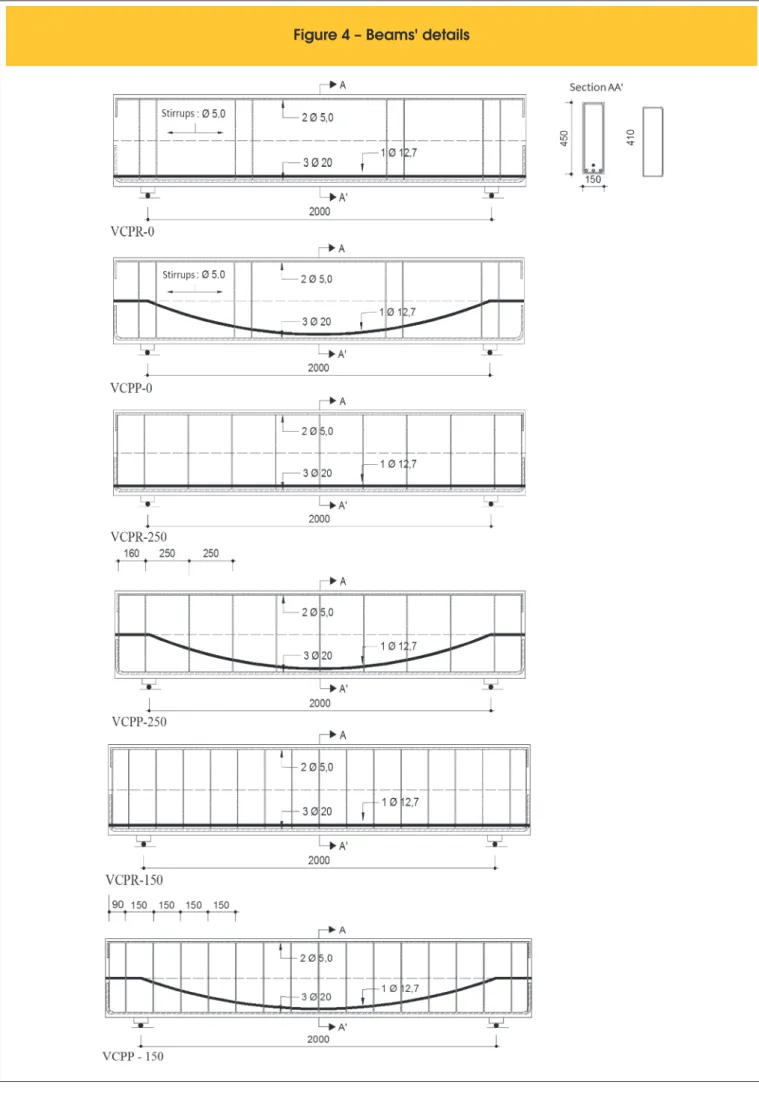
Six prestressed concrete beams using the system with greased cable and with two layouts for the prestressing cables, straight and para-bolic, and variations in the shear reinforcement ratio (vertical stirrups) were tested and analyzed. The beams had cross section of (150 x 450) mm2, length of 2400 mm and 2000 mm of tested span, same
longitudinal reinforcement and mechanical properties of the concrete (same concreted). From the six beams, three had straight cables and three parabolic ones, with one beam of each group presenting trans-verse reinforcement only at the supports and load application points, and the other had stirrups of diameter 5.0 mm each 250 mm and 150 mm. The positions of the straight and parabolic cables and its incli-nations were the same enabling comparisons between beams with same shear reinforcement and cables’ layout. Thus, the inluence of
the cables’ layout in the shear resistance was assessed by comparing the experimental results of the beams 0 and VCPP-0, VCPR-250 and VCPP-VCPR-250, VCPR-150 and VCPP-150. Assuming that the greater the force applied to the cable will be greater this increase in shear resistance, the cable was loaded to its permissible limit of ten-sion to show its inluence. Table 3 and Figure 4 bring the features and details of the prestressed concrete beams.
3.2 Concrete’s mechanical properties
The compressive strength, tensile strength and elastic modulus of concrete were obtained experimentally by compression of cylin-drical proofs molded according to NBR 5738 [9] at the same of the beams’ concrete placement, removing three cylindrical proofs with 150 mm diameter and 300 mm length to perform each of the tests mentioned, totaling nine proofs. Determination of compres-sive strength followed the established by NBR 5738 [9] and the determination of tensile strength by diametrical compression fol-lowed established by NBR 7222 [10] and the secant modulus of elasticity was found according to NBR 8522 [11]. Table 4 presents the results of the mechanical properties of concrete.
3.3 Reinforcements’ mechanical properties
The average values of the yield and failure stresses, yield strain and elastic modulus of the six steel bars samples with diameter of 20.0 mm and 5.0 mm of the lexural and transversal reinforce-ments, respectively, are presented in table 5. Additionally, all
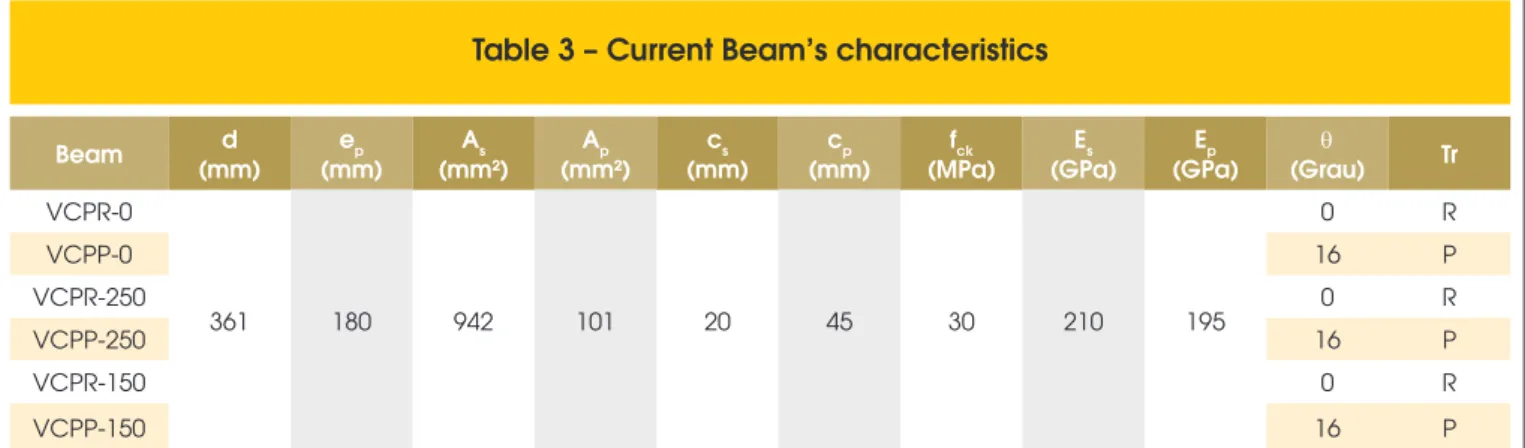
Table 3 – Current Beam’s characteristics
Beam d (mm) ep (mm) As (mm²) Ap (mm²) cs (mm) cp (mm) fck (MPa) Es (GPa) Ep (GPa) θ (Grau) Tr VCPR-0
361 180 942 101 20 45 30 210 195
0 R
VCPP-0 16 P
VCPR-250 0 R
VCPP-250 16 P
VCPR-150 0 R
VCPP-150 16 P
dp – Beams’ useful depth; ep – Prestressing cable’s eccentricity at middle span; cs – Prestressing cable’s concrete cover at middle span; R – Straight layout cable;
P – Parabolic layout cable; θ – Prestressing cable inclination.
Table 4 – Concrete’s mechanical properties
Mechanical property
Experimental Theoretical (NBR 6118 [5])
fc, exp (MPa)
fct, exp (MPa)
Esec, exp (GPa)
fc, teor (MPa)
fct, teo (MPa)
Esec, teo (GPa)
Compressive strength 31.0 – –
30.0 2.0 26.1
Tensile strength – 3.01 –
Elastic modulus – – 25.0
Table 5 – Properties of steel bars with diameter
of 5.0 mm and 20.0 mm
ϕ (mm) fys (MPa) fu (MPa) εys (‰) ES (GPa)
5.0 597.0 602 4.6 229.6
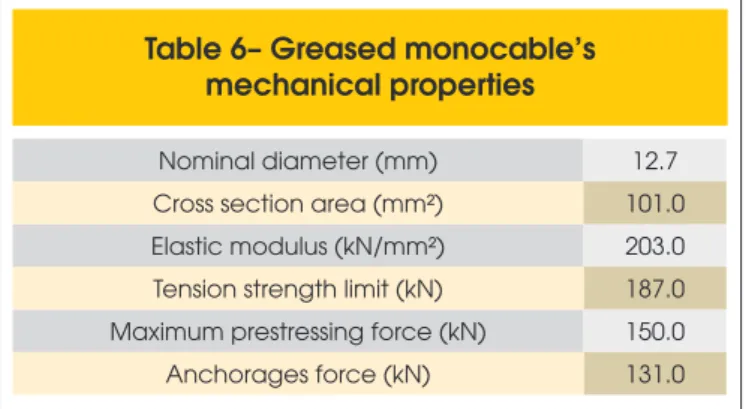
samples met the criteria of ductility of NBR 7480 [12], which pre-scripts the failure stress fu at least equal to 1.10∙fys. The mechani-cal properties of the prestressed cables came from catalog of the manufacturer CIA Siderurgica Belgo Mineira and are presented in Table 6.
3.4 Beams’ production
After making the wooden formwork and application of mold release oil, the active and passive reinforcement received spacers and were positioned carefully aiming the standardization of concrete cover of re-inforcements and, consequently, the useful heights of the beams. Both the beams with straight cable and the beams with parabolic cable ad-opted a concrete cover of 50 mm from the central point of the cable to the bottom surface of the beams. The beams and proofs were then concreted at the same time and using the same concrete, being re-leased and vibrated with immersion vibrators with diameter of 32 mm for beams and 25 mm for proofs and, after 4 hours, beams were cov-ered with wet tissues. The mold removing happened 7 days after con-crete placement. Figure 5 shows the production process of the beams.
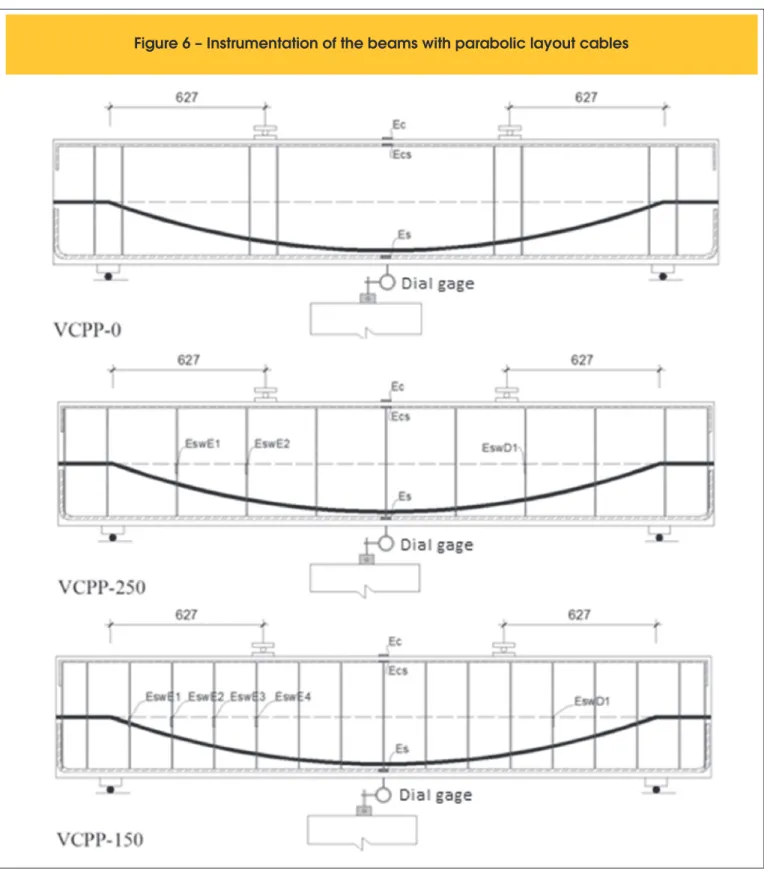
3.5 Instrumentation
For monitoring the behavior of the beams along the test proce-dure, strain gages were used in concrete, lexural and transverse
Table 6– Greased monocable’s
mechanical properties
Nominal diameter (mm) 12.7
Cross section area (mm²) 101.0
Elastic modulus (kN/mm²) 203.0
Tension strength limit (kN) 187.0
Maximum prestressing force (kN) 150.0
Anchorages force (kN) 131.0
reinforcements. There were. 28 strain gages on steel bars, includ-ing passive and transverse reinforcements, 06 strain gages on con-crete and 06 strain gages on the compressive reinforcement totaling 40 strain gages, and 01 dial gage per beam for observation of the evolution of vertical displacements generated by prestressing and
external loadings. Figure 6 shows the instrumentation of the beams.
3.6 Test system
The test of the beams was carried out in the Civil Engineering
oratory of the Federal University of Para. The irst step was to set up the four-point test system (Stuttgart test), positioning the beams on supports of irst and second gender mounted on con -crete blocks which were supported on the laboratory reaction slab. Then the data acquisition system ALMEMO® 5690-2M, from Ahlborn compatible with the AMR WinControl software was connected to all the gages of the beam, followed by mounting of the hydraulic jack and of the load cell in the reaction frame and in the passive anchoring of the beam.
The test starts with the cable tension. The prestressing was ap-plied through a monocable hydraulic jack with capacity of 200 kN, increments of 10 kN until the inal loading of 120 kN, after all the losses. Initially the cable was pulled up to 150 kN, anticipat-ing losses due to the small size of the beams, for accommoda-tion of the wedge and reinforcement slip, which ranged from 30% to 41%. After these losses, there was a need of prestress-ing increment. The prestressprestress-ing increment consisted in pull the
cable up to 150 kN. With the cable tensioned, the anchor was loose from the steel plate leaving a gap, which was illed with small plates to prevent the return of the anchor and the conse-quent loss of strength in the cable. This control was visual and this procedure was considered satisfactory when the gap was no longer visible.
Immediately after the prestressing step, began the external loading application on the beams. The loadings on the beam were applied at two equidistant points, featuring as a four-point test applied by a hydraulic jack with capacity of 1000 kN, which reacted under the beam of the reaction frame of the labora-tory. The hydraulic jack applied loading until the beam’s failure through a steel beam that transferred this loading to two points on the beam. The monitoring of the applied loading was made by a standard load cell of 1000 kN and precision of 1 kN, con-nected to a load cell reader to indicate the magnitude of the loading. Figure 7 shows the test system.
e 7 – Teste system
Table 7– Prestressing forces and losses
Beam
Prestressing Prestressing
immediate loss (%)
Represtressing Represtressing
immediate loss (%)
P0
(kN)
P0F
(kN) Ppi
(kN)
Pp0
(kN)
Pri
(kN)
PF
(kN)
VCPR-0 149 105 29,6 152 119 21,7 113,0 129
VCPP-0 148 88 40,5 150 125 16,6 124,0 135
VCPR-250 152 102 32,9 151 121 19,9 120,5 127
VCPP-250 151 91 39,7 149 115 22,8 114,0 136
VCPR-150 150 109 27,3 149 118 27,5 117,0 124
VCPP-150 150 84 44,0 150 121 19,3 118,0 137
Ppi – Initial prestressing force without immediate loss; Pp0 – Prestressing force after immediate loss; Pri – Initial represtressing force without immediate loss;
4. Results and discussions
4.1 Prestressed forces and immediate losses
The parabolic cables presented the highest variations of the pre-stressing forces (beams VCPP-0, VCPP-250 and VCPP-150) due to the cables’ delections, with immediate average loss of 41.4%, higher than the cables with straight proile (VCPR-0, VCPR-250 and VCPR-150), which had mean immediate losses in the order of 29.9%. Losses reached this amount due to the small size of the beams, high prestressing force in the cable and the manual method of crimping wedge (wedge accommodation). The small size and high prestress-ing force in the cable caused the high stress on anchorages requirprestress-ing a larger work of wedges, increasing its accommodation. After addi-tional prestressing the average loss was between 23% and 19.5% for the beams with straight and parabolic cables, respectively. It was also noted that during application of the loading on the beam, there was a gradual increase in force in the prestressing cable, with the largest increases observed in beams with parabolic cable. Table 7 presents the values of the forces applied in all cables of the six beams along the prestressing process as well as the immediate loss values.
4.2 Concrete’s strains
It was observed that the stresses on the concrete surfaces were reversed along the prestressing process, creating tension at the top surface, very close to the tensile strength of concrete, and compression (-7.4 MPa) at the bottom surface. The highest tensile strain measured at the top surface of the beam, were 0.044 ‰, 0.060 ‰, 0.045 ‰, 0.07 ‰, 0.038 ‰ 0.065 ‰ for the beams VCPR-0, VCPP-0, VCPR-250, VCPP-250, VCPR-150, VCPP-150, respectively. During the testing of beams, none of them exceeded the conventional limit of strain for concrete in lexure according to NBR 6118 [5], 3.5 ‰, then there was no crushing of con-crete. Figure 8 shows the strains measured by the concrete’s strain gage.
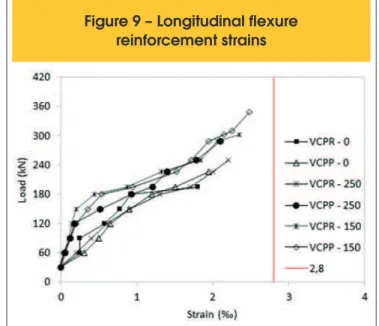
4.3 Flexure reinforcement’s strains
There was no steel yielding in any of the six beams’ passive lexure
reinforcement, despite the higher failure loads of the beams. This is due to the contribution of active reinforcement in lexure strength of the beams, since the prestressing cables are from special steel having tensile strength value of 187 kN. The highest tensile strain in the passive longitudinal reinforcement bars in the middle section of the span were 1.8 ‰, 1.94 ‰, 2.2 ‰, 2.1 ‰, 2.34 ‰, 2.48 ‰ for the beams VCPR-0, VCPP-0, VCPR-250, VCPP-250, VCPR- 150, VCPP- 150, respectively. Figure 9 shows the load versus deforma-tion diagram for passive lexure reinforcement.
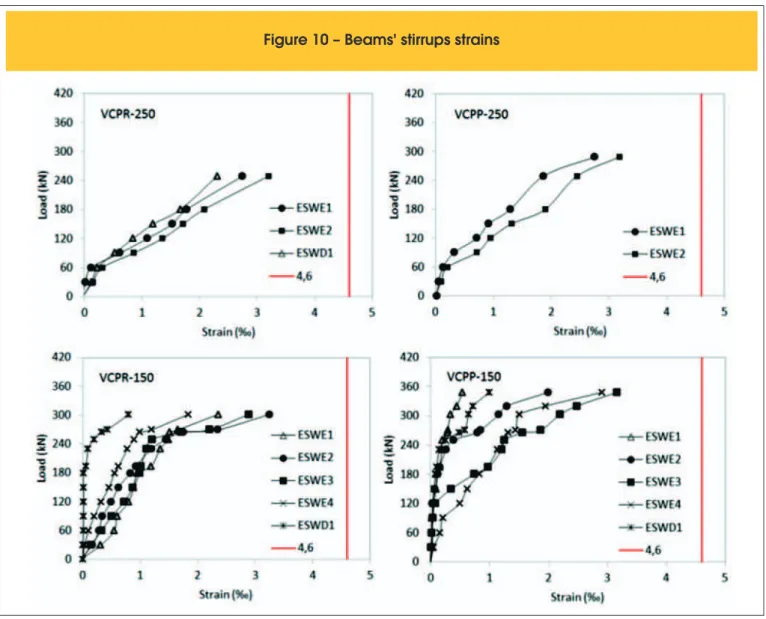
4.4 Shear reinforcement’s strains
It is important to note that the beams VCPR-0 and VCPP-0 had transverse reinforcement only in supporting and load application points to avoid located rupture, and therefore not monitored, so only the beams VCPR-250, 250, VCPR-150 and VCPP-150 received strain gages. Figure 10 shows the load versus strain curve for transverse reinforcement. In all the beams strains were not greater than the yield strain εys=4.6 ‰. The most requested
stirrups were the closest to the loading, indicating that the path of stresses occurred in a lower slope low. According to Leonhardt and Monnig [2] the longitudinal prestressing introduces in rein-forced concrete elements compressive stresses that contribute to reducing tensile stresses (which are more inclined in relation to the element’s axis), so that shear cracking are conigured with lower inclination, with the struts reduced to values between 15º and 30º.
4.5 Vertical displacements
The vertical displacements of the prestressed beams were mea-sured by dial gages located at the middle spans of the beams and are shown in Figure 11. The eccentricity of the prestressing forces helped to reduce these displacements. At the time of prestress-ing were measured vertical displacements of -0.32 mm, -0.20 mm, -0, 35 mm, -0, 43 mm, -0, 32 mm, -0, 37 mm for beams VCPR-0, VCPP-0, VCPR-250, VCPP-250, VCPR-150 and VCPP-150.
Figure 10 – Beams' stirrups strains
4.6 Ultimate loads and failure modes
During the tests, none of the six tested beams reach the passive longitudinal reinforcement’s yield loading, as expected, failing by shearing. Table 8 presents the values of the latest experimental
loads and failure modes of the beams. It was clear the inluence of the inclined cable on the shear strength of the beams. The vertical component generated by the prestressing forces in the parabolic cables provided greater resistant capacity with increases of up to 15% for the beams with stirrups spaced each 150 mm. Parabolic
Table 8 – Ultimate loads and failure modes
Beam As
(mm²)
Asp (mm²)
Asw (mm²)
s (mm)
Pu
(kN) Failure mode
VCPR-0
942 101
– – 194.4
Shearing
VCPP-0 – – 225.1
VCPR-250
39.3
250 249.9
VCPP-250 250 288.5
VCPR-150 150 302.2
Figure 11 – Beams' vetical displacements
Table 9 – Theoretical and experimental results
Beam Pflex
(kN)
NBR 6118 [5] ACI 318 [3] Eurocode 2 [2] Experimental
MOD. I (kN)
MOD. II (kN)
ACI FS (kN)
ACI WS (kN)
EC2 (kN)
Pu
(kN)
VCPR-0
341.2
177.4 177.4 179.9 269.5 181.8 194.4
VCPP-0 242.7 242.7 246.1 269.5 248.0 225.1
VCPR-250 237.3 281.1 246.4 335.9 119.7 249.9
VCPP-250 302.6 346.4 312.6 335.9 185.8 288.5
VCPR-150 277.2 350.2 290.8 380.3 199.5 302.2
VCPP-150 342.5 415.5 356.9 380.3 265.6 348.3
ACI FS - Flexure-shearing failure; ACI WS – web-shearing failure
cables showed greater strength gains at the end of the tests, 15% against 8% of straight cables. This may have contributed to combat tensile stresses generated by struts and to increase the aggregate interlock close to ultimate loadings. Figure 12 shows the inal as-pect of the beams.
5. Codes’ prescriptions analysis
Table 9 presents the theoretical results for shear resistance ac-cording to the codes ACI 318 [3], EUROCODE 2 [4] and NBR 6118 [5] and the experimental results obtained from tests of the six pre-stressed beams, and Table 10 presents the relationship between experimental ultimate load (PU) and predicted ultimate load (PE). The ACI 318 method [3] is based on the average shear stress and the total depth of the cross section bw∙d. The parcel Vc in prestress-ing must be the lower of Vci and Vcw which are, respectively, failure by lexure-shearing (ACI FS) and web shear failure (ACI WS). Be-sides the concrete contribution is also taken into account the par-cel related to shear reinforcement Vs. To the beams with straight cable (VCPR-0, VCPR-250 and VCPR-150), the estimated results for the ACI FS method showed relations Pu/PE equal to 1.08, 1.01, 1.04, and the beams with parabolic cable (VCPP-0, VCPP-250 and VCPP-150) with relationship PU/PE equal to 0.91, 0.92 and 0.98, respectively. The method does not consider directly the contribu-tion of horizontal component Vp. Prestressing is taken into account by a moment which cancels the design external moment, which depends on the prestressing cable eccentricity in relation to the neutral axis. But in the method based on the failure mode by web shearing (ACI WS), the favorable efect of the vertical component is taken into consideration in the equation. By this method the beams with straight cable presented relationship PU/PE equal to 0.72, 0.74 and 0.92, respectively, and beams with parabolic cable had relationship PU/ PE equal to 0.84, 0.86 and 0.79, respectively. As the ICA recommends the lower value between Vci and Vcw for the concrete parcel in the shear strength, in all beams the value used was Vci.
The procedure of EUROCODE 2 [4] considers beams with shear reinforcement and the resistance is based on the truss model with variation of the strut angle inclination, and for beams without shear reinforcement only the concrete’s contribution. For beams
with shear reinforcement the European code deines resistance as the lower of the parcels from shear reinforcement, VRds, and the maximum limit value for strut crushing, VRd,max, without the concrete’s contribution to the resistance. For without shear re-inforcement elements, prestressing is considered through the prestressing tension σcp. The relationship PU/PE for the beams
with straight cable (VCPR-0, VCPR-250, VCPR-150) was 1.07, 2.09 and 1.51, respectively, and the beams with parabolic cable (VCPP-0, VCPP-250, VCPP-150) this relationship was 0.91, 1.55 and 1.31, respectively.
Table 10 – Variation of P
U/P
Erelationship
Beam
NBR 6118 (2014) ACI 318 Eurocode 2
Pu/PE
MOD. I
Pu/PE
MOD. II
Pu/PE
ACI FS
Pu/PE
ACI WS
Pu/PE
EC2
VCPR-0 1.10 1.10 1.08 0.72 1.07
VCPP-0 0.93 0.93 0.91 0.84 0.91
VCPR-250 1.05 0.89 1.01 0.74 2.09
VCPP-250 0.95 0.83 0.92 0.86 1.55
VCPR-150 1.09 0.86 1.04 0.79 1.51
VCPP-150 1.02 0.84 0.98 0.92 1.31
greatest value of the considered length. The relationships PU/PE for Model I and for the beams with straight cables (0, VCPR-250, VCPR-150) were 1.10, 1.05 and 1.09, respectively, and for the beams with parabolic cables (VCPP-0, VCPP-250, VCPP-150) the values were 0.93, 0.95 and 1.02, respectively. For Model II and beams with straight cables, the relationships PU/PE were 1.10, 0.89 and 086, and for the beams with parabolic cables were 0.93, 0,83e 0.84, respectively.
The trend against the safety of NBR 6118 and ACI codes esti-mates, i.e. using the Model II of NBR 6118 and the equation of ACI considering the predominance of shear in the web (ACI WS), may be associated with the theoretical imprecision and/or experimental
on account of the strut inclination (30°) and the vertical component
of prestressing, respectively. However, these guidelines recom-mend that the lowest values are adopted, with the result that their estimates were accurate, i.e. Model I of NBR 6118 and
consider-ations ACI (ACI FS) for lexural-shear ACI (ACI FS).
6. Conclusions
Several aspects of the prestressed system development were dis-cussed in this paper, as the contribution of the prestressing cable’s layout on the shear strength of beams, the inluence of prestress-ing in reducprestress-ing vertical displacements and cracks, transverse and longitudinal reinforcement’s strains, concrete strains, beyond com-parisons of experimental results with the results estimated by the standards ACI 318 [3], EUROCODE 2 [4] and NBR 6118 [5]. For the presented experimental results it can be concluded that the parabolic layout of the cable raised up to 16% the shear strength of beams, with or without stirrups. Already the codes’ estimates difered among themselves with some results against safety, but still close and consistent with the experimental results obtained in this study, except the results of EUROCODE 2 to the beams with stirrups where estimates were too conservatives. It emphasizes the need for more experiments and detailed analyzes (computing, database, etc.) to enable a better understanding of the problem and a more fair assessment of the codes’ estimates.
7. Acknowledges
The authors thank CNPq, IPEAM and CAPES for inancial support at all stages of this research.
8. References
[1] NAAMAN, A. E. Prestressed Concrete. Analysis and Design: Fundamentals. 2º Edition, 2004.
[2] LEONHARDT, F., MONNIG, E. Concrete constructions, ba-sic principles on reinforcement concrete reinforcements. São Paulo – SP. Interciência Ltda., Vol. 3, 1977, 2007. [3] ACI 318. Building Code Requirements for Structural
Con-crete, American Concrete Institute, Farmington Hills, Michi-gan, 2011.
[4] Eurocode 2, Design of Concrete Structures—Part 1-1: Gen-eral Rules and Rules for Buildings, CEN, EN 1992-1-1, Brus-sels, Belgium, 2004.
[5] BRASILIAN ASSOCIATION OF TECHNICAL STANDARDS. NBR 6118 – Design of reinforced concrete structures. Rio de Janeiro, 2014.
[6] LASKAR. A, HSU T.T.C, MO. Y. L. Shear Strengths of Pre-stressed Concrete Beams Part 1: Experiments and Shear Design Equations. ACI Structural Journal, May-June, 2010. [7] MACGREGOR, J. G., Strength and Behavior of Prestressed
Concrete Beams with Web Reinforcement. PhD thesis, Uni-versity of Illinois, July, 1960.
[8] ACI-ASCE Committee 426 (1973). The Shear Strength of Reinforced Concrete Members. In: Journal of the Structural Division, Vol. 99, N° ST6, June, 1973, pp. 1091-1187. [9] BRASILIAN ASSOCIATION OF TECHNICAL STANDARDS.
NBR 5738 – Molding and cure of concrete proofs. Rio de Janeiro, 1994.
[10] BRASILIAN ASSOCIATION OF TECHNICAL STANDARDS. NBR 7222 – Concrete and mortar – Tensile strength determi-nation through diametric compression of cylindrical concrete proofs. Rio de Janeiro, 1994.
[11] BRASILIAN ASSOCIATION OF TECHNICAL STANDARDS. NBR 8522 – Concrete – Determination of the elastic modu-lus and stress-strain curve. Rio de Janeiro, 2003.
![Figure 1 – Prestressing components (Naaman [1])](https://thumb-eu.123doks.com/thumbv2/123dok_br/18861175.417949/2.892.68.833.560.1131/figure-prestressing-components-naaman.webp)
![Table 2 – Characteristics of the MacGREGOR’s [7] beams](https://thumb-eu.123doks.com/thumbv2/123dok_br/18861175.417949/3.892.71.828.561.1138/table-characteristics-macgregor-s-beams.webp)
![Figure 3 – Cracking pattern for reinforced concrete beam (ACI 318[3])](https://thumb-eu.123doks.com/thumbv2/123dok_br/18861175.417949/4.892.72.833.882.1136/figure-cracking-pattern-for-reinforced-concrete-beam-aci.webp)
![Table 9 presents the theoretical results for shear resistance ac- ac-cording to the codes ACI 318 [3], EUROCODE 2 [4] and NBR 6118 [5] and the experimental results obtained from tests of the six pre-stressed beams, and Table 10 presents the relationship](https://thumb-eu.123doks.com/thumbv2/123dok_br/18861175.417949/13.892.459.833.818.1131/presents-theoretical-resistance-eurocode-experimental-obtained-stressed-relationship.webp)
