ISSN 0104-6632 Printed in Brazil
Brazilian Journal
of Chemical
Engineering
Vol. 21, No. 01, pp. 103 - 112, January - March 2004
THE CYCLONIC DRYER - A NUMERICAL AND
EXPERIMENTAL ANALYSIS OF THE INFLUENCE
OF GEOMETRY ON AVERAGE PARTICLE
RESIDENCE TIME
J. L. G. Corrêa
1, D. R. Graminho
1, M. A. Silva
2*and S. A. Nebra
11
School of Mechanical Engineering, State University of Campinas, Unicamp, P. O. Box 6122, CEP: 13083-970, Phone +(55) (19) 3788-3270,
Fax +(55) (19) 3289-3722, Campinas - SP, Brazil, E-mail: [email protected], E-mail: [email protected]
2
School of Chemical Engineering, State University of Campinas, Unicamp, Campinas - SP, Brazil. E-mail: [email protected]
(Received: April 15, 2003 ; Accepted: July16, 2003)
Abstract - Particle residence time is an extremely important variable in a cyclonic dryer project. With the goal of obtaining a device that conduces to a long particle residence time, the influence of cyclone dimensions on particle residence time and on the type of flow is discussed here.The research was based on a device with a very high ratio of cyclone diameter to other dimensions. Simulations were developed with computational fluid dynamics techniques by the use of the commercial code CFX 4.4 of AEA Technology. Particles were treated individually. The fit of a turbulence model was also discussed. Theoretical and experimental results showed that the dimensions of the conical part of the cyclone had a very important influence on flow and consequently on particle residence time. The influences of volumetric concentration and particle diameter on particle residence time were also observed.
Keywords: cyclone, CFD, drying, particle residence time.
INTRODUCTION
The cyclone has been used as a gas cleaner for more than a century (Ogawa, 1997; ter Linden, 1949). It is cheap and simple equipment that can easily remove particles bigger than 5µm from a gaseous phase. But it can also be used as a preheater in the cement industry (Ludera, 1989), a reactor (Lede, 2000) or a dryer (Heinze, 1984; Nebra et al.; 2000; Corrêa et al., 2001a; Corrêa et al., 2002a, Corrêa et al., 2003a and b). Average particle residence time (APRT) becomes very important in these cases, determining the final conditions of the process.
There are several studies on changes in cyclone dimensions (Jackson, 1963; Dirgo and Leith, 1985;
Rongbio Xiang et al., 2001; Santana et al., 2001), but most of them are related to separation efficiency or pressure drop.
The cyclonic chamber used here was based on one in the Dibb and Silva (1997) paper. They used a software based on Silva’s model (Silva, 1991) to study theoretically the influence of cyclone geometry on APRT. Assuming constant inlet velocity, they observed that cyclone diameter was the most influential dimension.
A Lagrangean model was used to simulate particle transport. The most important goal of this work was to project a cyclonic dryer. The projected equipment should provide maximum APRT. The first projected equipment, referred to here as the “cyclonic chamber” had a kind of gas flow different from that of a typical cyclone (Corrêa et al., 2001b; ter Linden, 1949). The second one, cyclone, was based on simulations of changes in that chamber. The best way to present this study is chronologically the theoretical followed by the experimental part, the cyclonic chamber and then the cyclone.
This first theoretical study includes the
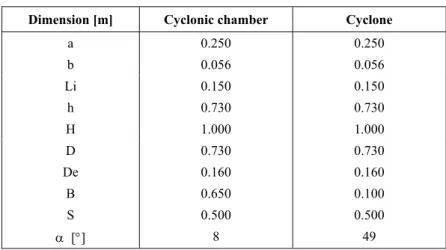
mathematical model, numerical method, boundary conditions and numerical results. Figure 1 illustrates the experimental setup. The blower and Venturi feeder admit respectively air and particles to the system. From the feeder to the lower part of the cyclone the particle and the gas phase flow together. Figure 2 illustrates the cyclonic equipment discussed here and its characteristic dimensions, and Table 1 shows the values of these dimensions for both sets. The cyclonic chamber dimensions are
based on
a previous study on particle residence time (Dibb and Silva, 1997). More information can be seen in Corrêa (2003).8
2 1
3 4
5 6
7
1 - Cyclone or Cyclonic Chamber 2 - Solid Collector
3 - Venturi Feeder
4 - Electrical Conveyor Belt 5 - Heater
6 - Orifice Plate 7 - Brower 8 - Cotton Cloth
Figure 1: Experimental setup
H S
h
e
D
Li
b
B
α
a
The Cyclonic Dryer 105
Table 1: Cyclonic chamber and cyclone dimensions
Dimension [m] Cyclonic chamber Cyclone
a 0.250 0.250
b 0.056 0.056
Li 0.150 0.150
h 0.730 0.730
H 1.000 1.000
D 0.730 0.730
De 0.160 0.160
B 0.650 0.100
S 0.500 0.500
α [°] 8 49
MATHEMATICAL MODEL
The mathematical model is comprised of Eq (1) to (7).
Gas Phase Equations
Continuity Equation
( u) 0
t
∂ρ +∇⋅ ρ =
∂ (1)
Momentum Equation
( )
(
)
u
uu u u g
t
∂ρ + ∇⋅ ρ = ∇ ⋅ τ + ρ ′ ′ + ρ
∂ (2)
where u is the velocity vector, t is time, ρ is density, g is acceleration of gravity, τ the stress tensor and
u
u′ ′
ρ is the Reynolds tensor.
Turbulence Model
Turbulence is still an open area of research. There are some turbulence models, but none of them provide a good fit for every case. One can see that the flow field changes a lot by considering different models (Meier et al., 2000; Hoekstra et al., 1999). Because of this, here the fit of different turbulence models was tested. The models tested were the traditional k-ε, the RNG k-ε described in Mohammadi and Pironneau (1994), the modified k-ε (Abujelala and Lilley, 1984) and the differential stress model (DSM) described in Launder et al., (1975).
Lagrangean Particle Transport Model
The total flow of the particulate phase is modeled by tracking a small number of particles through the
continuum fluid. Particles are treated as individually dragged by the gas. Particle-particle interactions and the influence of the particle phase on the gas phase are not taken into consideration. Griffiths and Boysan (1996) used the same assumptions.
Momentum Equation
The equations for the change in particle’s velocity come directly from Newton 2nd Law.
du m
dt =F (3)
where F is a force acting on the particle, m is particle mass, and u particle velocity.
The major component of F is the drag exerted on the particle by the continuous gas phase, given by
2
D D
1
F d C v
8
= π ρ R v R (4)
where CD is given by Eq (5).
(
0.687)
D
24 1 0.15 Re C
Re +
= (5)
The Reynolds number of the particle is defined by
R
v d
Re=ρ
µ (6)
where d is the particle diameter, ρ and µ are the density and viscosity in the continuum and vR is the
Particle residence time was calculated by
H
0 p
dz APRT
w
=
∫
(7)Numerical Method and Boundary Conditions
The numerical method used for calculation of the partial differential equations is finite volume co-located, coupling pressure with velocity (SIMPLE Consistent), using the interpolation scheme upwind with relaxation factors. Algebraic equations are solved by the AMG algorithm (Algebraic Multi-Grid) and the grid is generated with the multi-blocks technique (CFX User Guide, 2000).
The simulated system was composed of the
Venturi feeder, a horizontal duct between the feeder and the cyclone and the cyclone. The boundary conditions were as follows:
1) Uniform gas velocity field at the Venturi feeder inlet. It is more coherent than a uniform gas velocity field at the cyclone inlet because of the divergent pipe located before the cyclone inlet, as shown by Corrêa et al., (2002c);
2) Inlet-outlet conditions in the other places, defined by the condition of ambient pressure Ambient pressure was given and mass flux was calculated based on inner-outter pressure differences. This condition should be used when the outlet velocity value is not known. In the present study, the only known value for velocity was that at the Venturi feeder inlet and gas can leave (or enter) the system at three openings: the Venturi particle inlet or the upper or lower cyclone outlets; and
3) No-slip conditions for the continuous phase and slip condition for the particulate phase. For the particulate phase, the interaction between particles and the wall was a restitution coefficient. This coefficient was taken here to be one. Griffiths and Boysan (1996) also used these assumptions in a similar model.
EXPERIMENTAL PROCEDURE
The experimental part of this work is presented here. Projection of the cyclone used in this part was based on the theoretical part mentioned previously. The experimental results confirm the theoretical tendencies. The experiments include measurement of average particle residence time (APRT) in two devices referred to here as the cyclonic chamber and the cyclone. They are part of a study on the drying of sugar cane bagasse drying in a cyclone and were
carried out with glass spheres. Constant values of size and diameter make the sphere more appropriate than sugar cane bagasse for APRT diagnostic study.
The operational conditions were a solid mass flow rate between 4.18x10⁻² and 1.17x10⁻¹ kg/s, a gas flow rate between 7.77x10⁻² and 9.42x10⁻² kg/s, average particle diameters of 0.840x10⁻³ m and 4.000x10⁻³ m and a particle density of 2460kgm-3.
Figure 2 illustrates the cyclonic equipment. The difference between the cyclone and the cyclonic chamber is the dimension of particulate outlet, B, and consequently, cone angle, α. B is equal to 0.65m for the cyclonic chamber and equal to 0.10m for the cyclone. As stated previously, this difference causes differences in the fluid dynamics. In the case of the cyclonic chamber, both phases leave the equipment by the lower outlet, B (the upper outlet is not closed). In the case of the cyclone, gas and particles leave the device by the upper and by the lower outlet, respectively.
Airflow rate was measured from pressure drop across a calibrated orifice plate. Solids flow was varied using an electrical conveyor belt. Solid mass flow rate was measured by collecting a sample of material over a given time interval (the separation efficiency of the cyclone was 100% for glass spheres.
The method used to measure particle residence time was discussed by Lede et al. (1987) and used by Yuu et al. (1978) and Silva (1991) and is calculated by Equation (8). It is defined as the ratio of the remaining mass of solid (the solid and gas flows are simultaneously cut) to the solid mass flow rate.
r p m APRT
W
= (8)
The experimental velocity profile for gas in the cyclonic chamber and in the cyclone was obtained by a pressure drop measured by a cylindrical probe. This probe contains only one orifice in its lateral wall. Data on velocity are calculated by Equation 9 and velocity tangential and axial components by Equations 10 and 11, respectively. The radial component of velocity is not as significant as the others. (ter Linden, 1949).
0.5 din a,u 2 P u= ρ ∆
(9)
uθ=u cosβ (10)
z
The Cyclonic Dryer 107
∆P corresponds to the pressure difference between the point of maximum pressure and the point where the pressure is equal to the static pressure. β corresponds to an angle between the flow direction and horizontal axis. This horizontal axis was perpendicular to the probe. The cyclone diameter/probe diameter ratio was 146. Ismail et al., (1998) recommend a ratio higher than 26 for a Pitot probe. This probe was calibrated in a wind tunnel with similar velocities.
The velocity measurements were taken along the radius from the equipment wall to its center or on opposite sides of the draft tube.
RESULTS AND DISCUSSION
Simulation Results
Based on the cyclonic chamber geometry, some simulations were performed to obtain an apparatus with characteristics of a cyclone velocity profile and a large average particle residence time (APRT).
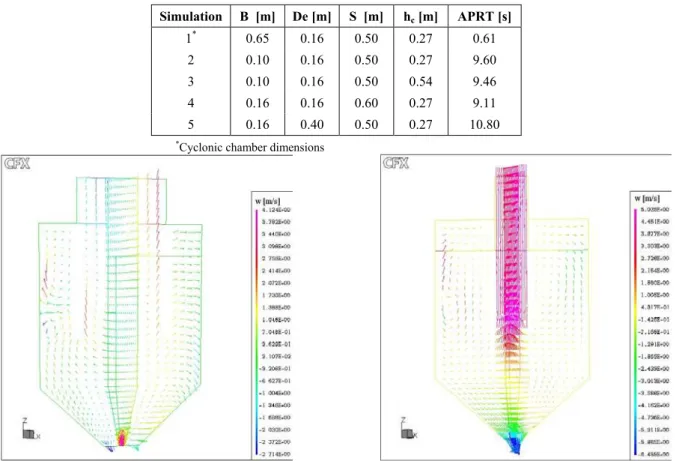
Table 2 shows all the geometries tested and the corresponding values of APRT. Simulation 1
corresponds to the cyclonic chamber. From Table 2, one can see that as the diameter of particle outlet, B, diminishes, APRT become longer and that height of the conical part, hc, did not influence APRT. It was observed that all the modified geometries (simulations 2 to 5, Table 2) produced similar values of APRT. Although simulation 5 was the one that produced the highest value of APRT, this geometry had recycle zones at both outlets of the equipment and a velocity field different from that of a typical cyclone (ter Linden, 1949). This can be seen in Figure 3. Moreover, Iozia and Leith (1989) reported that when De is bigger than B, the upper flow in the core could touch the conical wall of the cyclone and carry particles into it at the upper outlet. From among the modifications studied, the simulation 2 dimensions in Table 2 were chosen because they produced a small modification of the previous cyclonic chamber dimensions. In addition, the flow field in simulation 2 was similar to that of a traditional cyclone (Figure 4). Even though other modifications could be studied, there was a goal: to maintain the majority of the cyclonic chamber. Thus, a modification of the conical part only was simpler, and easier to implement.
Table 2: Simulation results on APRT for some modified dimensions
Simulation B [m] De [m] S [m] hc [m] APRT [s]
1* 0.65 0.16 0.50 0.27 0.61
2 0.10 0.16 0.50 0.27 9.60
3 0.10 0.16 0.50 0.54 9.46
4 0.16 0.16 0.60 0.27 9.11
5 0.16 0.40 0.50 0.27 10.80
*Cyclonic chamber dimensions
Figures 5 and 6 show tests 1 and 2 and Table 2, particle trajectories. They correspond to cyclonic chamber and to cyclone particle trajectories, respectively. These figures can explain the differences in APRT obtained for these cyclonic devices. In the second case, the particle has several spirals in the region of cylindrical-conical junction which makes the second case trajectory and APRT much longer than those in the first case.
Like numerous other studies (Hoekstra et al., 1999; Meier et al., 2000), this work presents tests of turbulence model fit. The turbulent k-ε model, modified k-ε models (RNG and Abujelala and Lilley (1984) model) and differential stress model were tested for the cyclonic chamber and cyclone momentum simulations. Interpolation schemes of the first, second and third order, respectively upwind, higher upwind and curvature compensated convective transport (CCCT) that corresponds to a QUICK scheme modification were tested. In the case of the cyclonic chamber, Figure 7 shows that with the exception of k-ε associated with CCCT, the cases produced almost the same results. Although the simulation velocity data were similar to the experimental data near the equipment core, the fit was poor near the wall and these data are very important to simulate adequately the APRT. It is important to note that the cyclonic chamber
simulations were conducted with the upper outlet of the equipment closed. This was done because it was experimentally observed that there was no gas flow at this open outlet. In the case of the cyclone, the k-ε model associated with the upwind scheme showed better results than the others did (Figures 8 and 9).
Some APRT experiments in the cyclone were also simulated (Table 3). The simulation numbers in Table 3 correspond to experimental tests in Table 4, where all experiments are shown. Even though the simulation results are not very similar to the experimental ones, they were of the same order of magnitude and can be seen as predictive. Maybe these differences are results of the Lagrangean model used for the particle phase that does not consider the interactions among the particles and the influence of the particle phase on the gas fluid flow, with the exception case of extremely low particle concentration. This model should not show a good fit. However, as one can see from Figures 5 and 6, it is useful in trajectory analysis. Experimental results show that particle volumetric concentration has an inverse influence on APRT. This demonstrates particle interaction (Mori et al., 1968; Yuu et al., 1978; Silva, 1991; Corrêa et al., 2000; Corrêa et al., 2002b). These phenomena make a Lagrangean model not so adequate for studying solid flow.
The Cyclonic Dryer 109
0
2
4
6
8
10
12
0.00 0.05 0.10 0.15 0.20 0.25 0.30
Wall distance [m]
T
a
n
g
e
n
ti
al
V
e
lo
ci
ty
[
m
/s
]
Experimental
k-epsilon higher upwind k-epsilon upwind k-epsilon CCCT DSM CCCT DSM upwind DSM higher upwind
Figure 7: Tangential velocity profile in the cyclonic chamber (velocity at the Venturi feeder inlet of 6.9 m/s)
0.0 2.0 4.0 6.0 8.0 10.0 12.0 14.0
0.00 0.05 0.10 0.15 0.20 0.25 0.30
Wall distance [m]
Experimental k-epsilon upwind k-epsilon higher upwind k-epsilon CCCT DSM upwind DSM higher upwind DSM CCCT
T
ange
nt
ia
l V
el
o
ci
ty
[
m
/s
]
Figure 8: Tangential velocity profile in the cyclone (velocity at the Venturi feeder inlet of 6.9 m/s)
0.0 1.0 2.0 3.0
4.0
5.0 6.0 7.0 8.0 9.0
0.00 0.05 0.10 0.15 0.20 0.25 0.30
Wall distance [m]
T
an
g
en
ti
al
V
el
o
ci
ty
[
m
/s
]
Experimental k-epsilon k-epsilon RNG
k-epsilon modified (Abujelala and Lilley, 1984)
Table 3: Particle residence time in the cyclone
Particle residence time [s] Simulation
Experimental Simulated
2 5.84 10.12
7 0.46 0.54
13 1.06 0.60
15 0.13 0.54
17 3.39 9.60
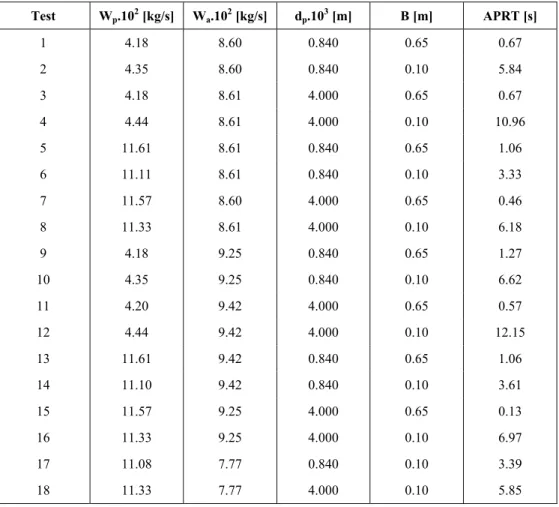
Table 4: Experimental results for glass sphere residence time
Test Wp.102 [kg/s] Wa.102 [kg/s] dp.103 [m] B [m] APRT [s]
1 4.18 8.60 0.840 0.65 0.67
2 4.35 8.60 0.840 0.10 5.84
3 4.18 8.61 4.000 0.65 0.67
4 4.44 8.61 4.000 0.10 10.96
5 11.61 8.61 0.840 0.65 1.06
6 11.11 8.61 0.840 0.10 3.33
7 11.57 8.60 4.000 0.65 0.46
8 11.33 8.61 4.000 0.10 6.18
9 4.18 9.25 0.840 0.65 1.27
10 4.35 9.25 0.840 0.10 6.62
11 4.20 9.42 4.000 0.65 0.57
12 4.44 9.42 4.000 0.10 12.15
13 11.61 9.42 0.840 0.65 1.06
14 11.10 9.42 0.840 0.10 3.61
15 11.57 9.25 4.000 0.65 0.13
16 11.33 9.25 4.000 0.10 6.97
17 11.08 7.77 0.840 0.10 3.39
18 11.33 7.77 4.000 0.10 5.85
Experimental Results
Table 4 shows data of average particle residence times (APRTs) obtained in a cyclonic chamber and in a cyclone (tests where B is 0.65m and 0.10m, respectively). The data are organized in pairs; each pair of tests was conduced under very similar conditions. It is shown in Table 4 that, under the conditions used, APRT increases too much with the decrease in B. The variation in APRT is due to the different flow type developed in these two apparatus. Figure 7 shows the gas velocity profile obtained in
the cyclonic chamber. A thin layer of gas and a null velocity core constitute the flow obtained in this apparatus. A traditional cyclone velocity profile is composed of a descending spiral near the wall and an ascending spiral in the central region (ter Linden, 1949).
Corrêa et al., (2002a) showed that APRT in experiments on sugar cane bagasse drying were longer for the cyclone than for the cyclonic chamber. This caused a bigger reduction in moisture content.
The Cyclonic Dryer 111
Subscripts
of variables like volumetric concentration, inlet gas velocity, particle diameter, particle density and dimensions such as cyclone height and diameter. They concluded that, except for volumetric concentration, which always has an inverse influence on APRT, none of the variables have always the same influence. Their influence depends on the process conditions and the kind of cyclone. This is also true in this work; Table 4 shows that particle diameter has a different influence on the cyclone (direct influence) than on the cyclonic chamber (inverse influence).
a Wet air
p Particle s Solid
r Remained solid
ACKNOWLEDGMENTS
The authors thank Prof. Dr. Eugênio Spanó Rosa for having lent them the glass spheres and CNPq and FAPESP for the financial support.
The Lagrangean model predicted very well the experimental tendencies of APRT. But, due to its characteristics it is not useful to predict particle
influence. REFERENCES
Abujelala, M.T. and Lilley, D.G., Limitations and Empirical Extensions of the k-ε Model as Applied to Turbulent Confined Swirling Flows. Chemical Eng. Communications. Vol. 31, pp. 223-236 (1984).
CONCLUSIONS
In this study of APRT, the following conclusions were reached:
Even though a Lagrangean model was not able to fit particle flow because it does not consider particle interaction, it can be used to predict cyclone geometry in a range of APRTs.
CFX-4.4 User Guide: Solver. AEA Technology, United Kingdom (2000).
Corrêa, J.L.G., Rios, M.T.T., Silva, M.A. and Nebra, S.A., Study of Particle Residence Time in Cyclones, Proceedings of the 28th ENEMP, Teresópolis, RJ, pp. 165-172 (2000) (in Portuguese).
Experimental and theoretical studies showed that solid volumetric concentration was the variable with the most influence on APRT. This variable had the same influence on both types of cyclonic equipment
studied. Corrêa, J.L.G., Chamma, M.O., Godoy, A.L., Silva, M.A. and Nebra, S.A., Experimental Study of Drying and Residence Time of Sugar Cane Bagasse in Cyclonic Devices. Proceedings of 2nd Inter-American Drying Conference, Boca del Rio, Veracruz, Mexico, 407-414, ISBN 968-5401-01-2 (2001a).
Experimental studies showed that particle diameter influenced APRT differently in the cyclone (direct influence) and in the cyclonic chamber (inverse influence).
Corrêa, J.L.G., Graminho, D.R., Silva, M.A. and Nebra, S.A., Simulation and Experimental Study of Gas Flow in a Cyclonic Chamber, Proceedings of the 29th ENEMP, São João del Rei, MG, on CD-ROM (2001b) (in Portuguese).
NOMENCLATURE
Latin Letters
APRT Average particle residence time
s
Corrêa, J.L.G., Graminho, D.R., Silva, M.A. andNebra, S.A., Cyclone as a Sugar Cane Bagasse Dryer, Proceedings of the 13th International Drying Symposium (IDS 2002), Beijing, China, C, pp. 1542-1549 (2002a).
B Outlet diameter of the cyclonic device s
d Diameter m
De Draft tube diameter m Mass kg
Corrêa, J.L.G., Silva, M.A. and Nebra, S.A., Experimental and Theoretical Study of Particle Residence Time in a Cyclonic Chamber. Proceedings of the 13th International Symposium on Transport Phenomena, Elsevier, Victoria, BC, Canada, pp. 63-67, ISBN 2-84299-391-8 (2002b).
hc Conical part height m
S Draft tube height m
W Mass flow ratio kg/s
Greek Letters
Corrêa, J.L.G., Peres, A.P., Graminho, D.R., Pacifico, A.L., Godoy, A.L., Silva, M.A. and Nebra, S.A., Anaysis of Flow in a Venturi Particle Feeder. Proceedings of the 14th Brazilian Congress of Chemical Engeneering (2002c) (in Portuguese)
Corrêa, J.L.G., Graminho, D.R., Silva, M.A. and Nebra, S.A., Experimental Study of Sugar Cane Bagasse in Cyclone. Accepted to publication on the 2nd Nordic Drying Conference, Copenhagen, Denmark (2003a).
Corrêa, J.L.G., Graminho, D.R., Silva, M.A. and Nebra, S.A., Cyclone as a Sugar Cane Bagasse Dryer, Submitted to Chinese Journal of Chemical Engineering. (2003b).
Corrêa, J.L.G., Discussion of Cyclonic Dryer Project Parameters. Ph.D.diss., State University of Campinas, Campinas - SP (2003) (in Portuguese). Dibb A. and Silva, M.A., Cyclone as a Drier – The
Optimum Geometry, Proceedings of The First Inter-American Drying Conference (IADC), Itu, SP, Brazil, B., pp. 396-403 (1997).
Dirgo, J. and Leith, D., Performance of Theoretically Optimized Cyclones. Filtration and Separation. Vol. 22, pp. 119-125 (1985).
Griffiths, W.D. and Boysan, F., Computational Fluid Dynamics (CFD) and Empirical Modeling of the Performance of a Number of Cyclone Samplers. Journal of Aerosol Science, 27, No.2, pp. 281-304 (1996).
Heinze, C., A New Cyclone Dryer for Solid Particles. Ger Chem. Eng., 7, No. 4, pp. 274-279 (1984).
Hoekstra, A.J., Derksen, J.J. and Van Den Akker, H. E. A., An Experimental and Numerical Study of Turbulent Swirling Flow in Gas Cyclones. Chemical Engineering Science, 54, pp. 2055-2065 (1999).
Iozia, D.L. and Leith, D., Effect of Cyclone Dimensions on Gas Flow Pattern and Collection Efficiency, Aerosol Science and Technology. 10, pp. 491-500 (1989).
Ismail, K.A., Gonçalves, M.M. and Benevenuto, F.J., Instrumentação básica para engenharia, Editora da Unicamp, Campinas, SP. ISBN 85-900609-1-8 (1998).
Jackson, R., Mechanical Equipment for Removing Grit and Dust from Gases. Great Britain: The British Coal Utilization Research Association (1963). Launder, B.E., Reece, G.J. and Rodi, W., Progress in
the Development of a Reynolds Stress Turbulence Closure. Journal of Fluid Mechanics, 68, pp. 537-566 (1975).
Lede, J., The Cyclone: A Multifunctional Reactor for the Fast Pyrolysis of Biomass,Ind. & Eng. Chem. Research, 39, pp. 893-903 (2000).
Lede, J., Soulignac, H.L., Li, F. and Villermaux, J., Measurement of Solid Particle Residence Time in a Cyclone Reactor: A Comparison of Four Methods, Chem. Eng. Proc., 22, pp. 215-222 (1987).
ter, Linden A.J., Investigations into Cyclone Dust Collector, Proc. Inst. Mech. Eng. J., 160, pp. 233-251 (1949).
Ludera, L.M., Design Methods for Cyclone Preheaters of Rotary Kilns. Zement-Kalk-Gips, 1, pp. 10-12, 1989.
Meier, H.F., Peres, A.P., Fugihara, T.J., Martignoni, W.P. and Mori, M., Comparison between Turbulence Models for 3-D Turbulent Flows in Cyclones. Proceedings of the XXI Cilance – Iberian Latin American Congress on Computational Methods in Engineering, Rio de Janeiro, on CD-ROM (2000).
Mohammadi, B. and Pironneau, O., Analysis of the k-epsilon Turbulence Model. Research in Applied Mathematics. John Wiley and Sons, Paris (1994). Mori, T., Suganuma, A. and Tanaka, S., On
Collection Efficiency of Gas Cyclone in Coarse Particle Range. Journal of Chemical Engineering of Japan, 1, pp. 82-86 (1968).
Nebra, S.A., Silva, M.A. and Mujumdar, A.S., Drying in Cyclones - A Review, Drying Technology, 18, pp. 791-832 (2000).
Ogawa, A., Mechanical separation process and flow patterns of cyclone dust collectors. American Society of Mechanical Engineers, 50, pp. 97 (1997). Patankar, S.V., Numerical Heat Transfer and Fluid
Flow. Washington: Hemisphere Publishing Co (1980).
Rongbiao Xiang, S.H., Park, S.H. and Lee, K.W., Effects of Cone Dimension on Cyclone Performance, Aerosol Science, 32, pp. 549-561 (2001).
Santana, J.D.A.M., Arnosti Jr, S. and Coury, J.R., Performance of Cylindrical-Conical Cyclones with Different Geometrical Configurations, Brazilian Journal of Chemical Engineering, 18, No. 3, pp. 233-241 (2001).
Silva, M.A., Study of Drying in Cyclones. Ph.D. diss., State University of Campinas, Campinas, SP (1991) (in Portuguese).