Article
J. Braz. Chem. Soc., Vol. 22, No. 4, 736-740, 2011. Printed in Brazil - ©2011 Sociedade Brasileira de Química 0103 - 5053 $6.00+0.00
A
*e-mail: [email protected]
Visible LED-Based Instrumentation for Photometric Determination of
Electroosmotic Flow in Microchannels
José Alberto Fracassi da Silva,*,a,b Ariane Deblire,a Dosil P. de Jesusª,b and Wendell Karlos T. Coltrob,c
aInstituto de Química, Universidade Estadual de Campinas, 13083-970 Campinas-SP, Brazil
bInstituto Nacional de Ciência e Tecnologia em Bioanalítica (INCTBio), Campinas-SP, Brazil
cInstituto de Química, Universidade Federal de Goiás, 74001-970 Goiânia-GO, Brazil
A instrumentação para a determinação fotométrica do luxo eletrosmótico (EOF) em dispositivos microluídicos é descrita neste trabalho. A instrumentação é baseada em componentes acessíveis e consiste em um microscópio trinocular e no fotodiodo integrado OPT101. Um diodo emissor de luz (LED) de alta intensidade foi utilizado como fonte de radiação. Para as determinações foram utilizadas soluções aquosas dos corantes azul patente V e azul de metileno. O sistema foi utilizado no monitoramento do EOF em microdispositivos de poli(dimetilsiloxano) (PDMS) e híbridos de toner/vidro. As mobilidades do EOF determinadas em pH 7,0 foram (5,75 ± 0,01)10-4 cm2 V-1 s-1 e (3,2 ± 0,1)10-4 cm2 V-1 s-1 para os dispositivos de toner/vidro e PDMS, respectivamente. Medidas reprodutíveis foram obtidas em todos os experimentos, levando a uma alta precisão na determinação. O método proposto foi comparado com o método tradicional de determinação do EOF que envolve a medida da corrente nos microcanais.
An instrumental setup for electroosmotic low (EOF) determination in microluidic devices is described. The system is based on a trinocular microscope and an integrated photodiode OPT101. The radiation was provided by a high-intensity white LED. For the determinations, patent blue V and methylene blue aqueous solutions were used. The setup was applied for EOF monitoring in hybrid toner/glass and PDMS microchips. For the toner/glass device, the EOF mobility was determined to be (5.75 ± 0.01) 10-4 cm2 V-1 s-1 at pH 7.0. For PDMS devices the measured EOF mobility was (3.2 ± 0.1) 10-4 cm2 V-1 s-1. Reproducible measurements were obtained in all experiments, which produced results with small errors. The proposed method was compared to the conventional current monitoring method.
Keywords: electroosmotic low, µTAS, Lab-on-a-chip, photometric methods, microluidic devices
Introduction
Electroosmotic flow (EOF) is the movement of solvent molecules caused by an applied voltage in a capillary system. EOF plays an essential role in electromigration separation techniques, such as capillary zone electrophoresis (CZE or free solution capillary
electrophoresis, FSCE) or microchip electrophoresis,1
since the velocity of the ions is influenced by the magnitude of the EOF. As an example, both positively and negatively charged species can be simultaneously analyzed due to the EOF. Moreover, the EOF magnitude
could bring some information about the condition of the surface of the capillary or microchannel wall. In particular, the knowledge about the surface charge density (including not only the EOF magnitude but also the zeta potential) can be of paramount importance for preventing adsorption of analyte to the wall.
It is well accepted that EOF has its origin on the unbalanced charge distribution in the region closer to the capillary/microchannel wall, the so called electrical double layer (EDL). More precisely, the low is caused by the movement of excess ions in the diffuse portion of the EDL. Mathematical treatment of the EOF combines the Newton Law applied to the viscous luids and Poisson’s charge distribution to give the velocity of the EOF (νx):
(1)
where ε is the relative permittivity of the solution inside
the microchannel, E is the magnitude of the electric ield strength, ζ is the zeta potential (or electrokinetic potential), φx is the potential on the plane at a distance x from the
microchannel wall, and η is the dynamic viscosity of the
solution in the region of the EDL.
This equation reveals that the velocity of the EOF (νeo)
is constant for distances greater than 3 or 4 times the EDL thickness, since the potential φx approaches to zero:
(2)
The EOF mobility, µeo, is the ratio between the EOF
velocity and the electric ield strength:
(3)
According to these equations, it is clear that the EOF mobility depends on both the capillary/microchannel wall conditions and solution properties, such as viscosity and ionic strength of the background electrolyte (BGE). Regarding to the microchannel wall, parameters affecting the charge of the wall (e.g., ionizable groups in the surface) will strongly inluence the zeta potential, and consequently the EOF mobility. The monitoring of the EOF is of great importance, since it is an indirect measurement of the surface condition and because it signiicantly inluences the electrophoresis performance. Additionally, values for
the zeta potential can be obtained from EOF data.4,5
Traditionally, EOF can be measured by monitoring a neutral species moving on the microchannel through the application of an electric ield. This method depends on the physicochemical properties of the species, such as high molar absorptivity, electroactivity, fluorescence, and so on. Alternative methods for the EOF monitoring employ photobleaching of molecules,6-8 conductometry,9 indirect
amperometry,10,11 indirect luorescence,12 frontal analysis,13 and
the creation of different temperature zones (thermal marks).14,15
Because of its instrumental simplicity, the
current-monitoring method is also very popular.16-21 In this method,
the microchannel is illed with an electrolyte (for example,
10 mmol L-1 phosphate buffer) and the solution in one of
the reservoirs is replaced by a more diluted electrolyte (for
example, 9.0 mmol L-1 phosphate buffer). The high voltage
is applied and the resulting current is monitored. In this case, using a proper polarity, the diluted solution gets into
the microchannel with the velocity of the EOF, augmenting the channel resistance and reducing the current. After the complete replacement of the solution in the channel - by the EOF pumping - the current stabilizes and the time required for this stabilization is measured. The mobility of the EOF (cm2 V-1 s-1) can be obtained by the following equation:
(4)
where L is the total length of the channel (cm), V is the applied voltage (V), and teo is the time required for the
current stabilization (s). When other detector, such as photometric, is used for the determination, the effective length (l) must be considered, but for the case of current method l equals L.
Although the current monitoring method is very simple and requires no additional instrumentation, in some cases is quite dificult to visualize the current stabilization. This is due to the dilution of the replenishment solution when it reaches the opposite reservoir of the device. Depending on the geometry of the microchannel and reservoir, this dilution can introduce considerable errors in the EOF
determination. Additionally, Pittman and co-workers6
reported that the current monitoring method can cause changes in the EOF as high as 41% in a single experiment.
To overcome this problem, we propose in this work an alternative method for EOF monitoring based on the same principle of the reilling the channel employed in the current monitoring method but making use of the change on the transmittance of visible radiation of an electrolytic solution containing a dye, instead of measuring the electrical current. This new method comprises a simple and accessible instrumentation and was applied for EOF measurement in glass/toner and poly(dimethylsiloxane) (PDMS) microdevices.
Experimental
Reagents and solutions
All solutions were prepared using deionized water from a Milli-Q puriication system (Millipore, Bedford,
MA, USA) with resistivity greater than 18 MΩ cm. All
chemicals were of analytical grade and used as received. Sodium dihydrogen phosphate, disodium hydrogen phosphate, and methylene blue were purchased from Synth (LabSynth, Diadema, SP, Brazil). The dye patent blue V was gently donated by Sensient Colors Brasil Ltda
(Santana de Parnaiba, SP, Brazil). Silastic® T-2 Translucent
preparation of PDMS microchips in the proportion pre-polymer/catalyst of 10:1 (m/m).
Stock solutions of patent blue V were prepared in
the concentrations 0.08 and 4.0 g L-1. Stock solutions of
methylene blue were prepared in 20 mmol L-1 phosphate
buffer, pH 6.0, in the concentrations 0.1 and 1.0 mmol L-1.
Microluidic devices fabrication
The feasibility of the proposed method was evaluated using glass/toner and PDMS microluidic devices. Glass/ toner microchips were produced according to fabrication
technology described by Do Lago et al.22 PDMS microchips
were fabricated using the well-established soft-lithographic protocol, where a master is produced and microchannels
are replicated via direct polymerization over the master.23
The high-relief master was fabricated in the Laboratory of Microfabrication at the National Synchrotron Light Source (LNLS, Campinas, SP, Brazil) using standard photolithographic protocols. In this case, metallic nickel was electrodeposited onto an alumina substrate using
UV-LIGA process.23
In this work, glass/toner microchannels were produced
with 100 µm width, 12 µm deep, and 6 cm long. In addition,
PDMS microchannels were fabricated with 100 µm width,
60 µm deep, and 4 cm long. The photometric detector was
placed at 4.3 and 2.7 cm from the inlet reservoir for glass/ toner and PDMS microchips, respectively.
Instrumentation
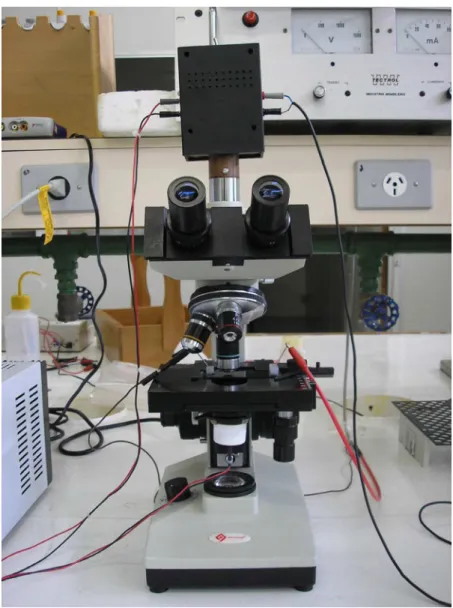
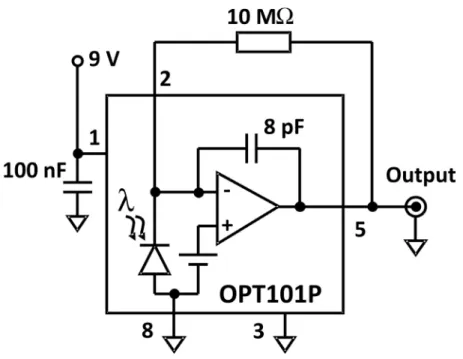
Figure 1 shows the instrumental setup for EOF photometric measurements. A photograph of the instrumental setup can be found in the Supplementary Information. The system was built with a trinocular microscope (model Q-709t, Quimis, Diadema, SP, Brazil). A high-intensity white LED was used as light source, supplied by 5.5 V using dual-channel, adjustable power supply (model MPC-303D, Minipa, São Paulo, SP, Brazil). A 580 nm cut-off high-pass optical ilter was used, but the use of a high-intensity red LED can substitute the white LED. The 100X objective was used throughout this work. A monolithic photodiode and ampliier OPT101 (Texas Instruments, Dallas, TX, USA) as well as the electronic circuitry (Supplementary Information) were cased in a plastic box and the ensemble was adapted
to the microscope using a copper tube.22 The output
of the ampliier was interfaced to a Pentium 133 MHz microcomputer through a PCL-711 interface card (Advantech, Taipei, Taiwan). The data acquisition program was written in Delphi 5.0 (Borland). A model TCH
1500-100 mA high voltage power supply (Tectrol, São Paulo, SP, Brazil) was used in the experiments. The voltage was set to 1500 V and 1000 V for glass/toner and PDMS microchips, respectively, and applied to the microchannels by using stainless steel needles. The data acquisition of the current in the microchannels and the control of the applied high voltage were also included in the control software.
All experiments were carried out at room temperature (25 ± 1 ºC).
Results and Discussion
The method for determination of the EOF proposed is depicted in Figure 2. First, channel and reservoirs are illed with diluted dye solution (Figure 2a). Then, diluted solution in the inlet reservoir is replaced by more concentrated dye solution (Figure 2b). The high voltage is turned on and the solution is moved toward the detector with the velocity of EOF (Figure 2c). In this case a cathodic EOF is assumed. By recording the output of the photometric detector, is possible
to measure the time (teo) the concentrated solution takes to
reach the detector and calculate µeo by using equation 4.
When preparing the instrumental conditions for the EOF determination, one must note that the focal plane is different for the ocular lens and for the photodiode (Supplementary Information). For this reason, the oculars were used preliminarily only to positioning the objective on the region determined by the microchannel walls. Next, the focus is adjusted through the maximization of the OPT101 output signal, since its absolute value is proportional to the intensity of radiation that reaches the photoactive area. If focus adjust is avoided, small variations of the OPT101 output is observed, making dificult the determination of teo.
As exempliied in Figure 2, by changing the solution on the inlet reservoir and applying the high voltage, the
solution inside the microchannel is replaced and the velocity of replacement is governed by the velocity of the EOF, since there are the same ions in both diluted and concentrated zones. If a concentrated solution is placed on the inlet reservoir it is expected a reduction in the intensity of radiation reaching the detector, dropping the OPT101 output signal (Figure 3). Simultaneously, as the concentrated solution enters the microchannel, the channel electrical resistance is dropped, increasing the electrical current. The opposite process (illing the channel with a concentrated solution) is also applicable, but in this case a rise in the output of OPT101 and a current reduction is achieved.
Figure 3 shows typical experimental results for EOF determination, as exempliied in Figure 1, using 0.08 and
4.0 mg L-1 patent blue V dye solutions. Simultaneous
acquisition of current and photodiode output was performed and the graph shows three consecutive runs. Approximately, a difference of 200 mV in the OPT101 output was obtained in the transition of the diluted to concentrated solution boundary. It can be observed that the current deviates in a higher extend and the transition is not so sharp when compared to the photodiode output signal. In fact, the repeatability of the photometric detector is impressive. One of the problems associated with the current monitoring is how to determine the exact point in the graph where the current stabilizes. We tried to develop methods for the analysis of these curves in order to improve the accuracy of the determinations. For example, the irst derivative of the current data was evaluated in order to determine the ending point, but even this mathematical data treatment did not eliminate the subjectivity of the determination by using the current monitoring method. To sum up, smoother the transition in the current-time curves more dificult and uncertain is the EOF determination. The mobility of the EOF obtained for this glass/toner microchip was (5.75 ± 0.01) 10-4 cm2 V-1 s-1, measured with solutions of
patent blue V at pH 7.0 and using the described conditions. This value is higher than 3.5 10-4 cm2 V-1 s-1 obtained in
a previous work,22 but one must consider differences in
the experimental conditions, such as ionic strength and temperature. Most important, the order of magnitude of
the measured EOF is in agreement to glass/toner surfaces.22
The EOF measurement obtained simultaneously using the current method was (4.2 ± 0.1) 10-4 cm2 V-1 s-1. The
difference could be attributed to small variations in the position of the photometric detector and dificulties in determine the exact teo in the current versus time graph.
The LED-based photometric method was also applied in the determination of the EOF in PDMS microchips. Experiments were also carried out with methylene blue at concentrations 0.1 and 1.0 mmol L-1 in 20 mmol L-1
phosphate buffer, pH 6.0 and representative results can be seen in Figure 4. In this case, the OPT101 supplied less than 10 mV in the output for transition from the diluted to concentrated solutions of methylene blue. This could be due to the spurious light transmitted outside the channel, since the whole microchip is transparent, in contrast of glass/toner microchips where the toner layers block the LED radiation outside the channel. In general, it was more dificult to adjust the focus for PDMS microchips, because
the cover layer was thick (ca. 2 mm). Nevertheless, even in
this unfavorable case it was possible to visualize the output transition. The determined EOF for this PDMS microchip at set conditions was (3.2 ± 0.1) 10-4 cm2 V-1 s-1.
Conclusions
The proposed method for the EOF monitoring presented some advantages when compared to the current method. Sharp transitions were observed in all experiments, which
Figure 2 . Scheme of the EOF determination. (a) The channel is illed with a diluted dye solution; (b) Diluted solution in one reservoir is replaced by the concentrated dye solution; (c) High voltage (HV) power supply is turned on. In this scheme a cathodic EOF is generated.
Figure 3. Results for the EOF monitoring in hybrid toner/glass microchip using the photometric method (OPT101) and the current method. Conditions: High voltage: 1500 V; Dye: 0.08 and 4.0 g L-1 patent blue V
allow monitoring the mobility of the EOF with small errors. Also, the photometric method does not depend on the absolute value of the channel current, which could impose some limitations to the current monitoring method. So, experimental conditions closer to that commonly used in electromigration techniques can be set. The positioning of the photometric detector could be improved using align marks during the process of fabrication of the devices, which could improve the reproducibility and accuracy of the EOF determination. The instrumentation is of low cost and safe, since it uses visible LED radiation. Unfortunately, the method cannot be applied to substrates non-transparent to radiation. Using the instrumentation proposed, we could successfully determine the EOF magnitude for hybrid toner/glass and PDMS microdevices. Also, there is the possibility of the use of neutral dyes EOF markers that could improve the measurements, since they would not introduce variations in EOF due to changes in the ionic strength.
Supplementary Information
Supplementary data are available free of charge at http://jbcs.sbq.org.br, as PDF ile.
Acknowledgments
Authors thank Fundação de Amparo à Pesquisa do Estado de São Paulo (FAPESP) and Conselho Nacional de Desenvolvimento Cientíico e Tecnológico (CNPq) for inancial support. Laboratório Nacional de Luz Síncrotron (LNLS), for using their facilities, and Dr. Carol H. Collins, for manuscript language revision, are also acknowledged.
References
1. da Silva, J. A. F.; Coltro, W. K. T.; Carrilho, E.; Tavares, M. F. M.; Quim. Nova2007, 30, 740.
2. Tavares, M. F. M.; Quim. Nova1996, 19, 176.
3. Oldham, K. B.; Myland, J. C.; Fundamentals of Electrochemical Science, Academic Press: San Diego, CA, USA, 1994, ch. 9. 4. Kirby, B. J.; Hasselbrink Jr., E. F.; Electrophoresis2004, 25,
187.
5. Kirby, B. J.; Hasselbrink Jr., E. F.; Electrophoresis2004, 25, 203. 6. Pittman, J. L.; Henry, C. S.; Gilman, S. D.; Anal. Chem.2003,
75, 361.
7. Pittman, J. L.; Schrum, K. F.; Gilman, S. D.; Analyst2001, 126, 1240.
8. Schrum, K. F.; Lancaster III, J. M.; Johnston, S. E.; Gilman, S. D.; Anal Chem. 2000, 72, 4317.
9. Liu, Y.; Wipf, D. O.; Henry, C. S.; Analyst2001, 126, 1248. 10. Wang, W.; Zhao, L.; Jiang, L.-P.; Zhang, J.-R.; Zhu, J.-J.; Chen,
H.-C.; Electrophoresis2006, 27, 5132.
11. Wang, W.; Zhao, L.; Zhang, J.-R.; Zhu, J.-J.; J. Chromatogr., A 2007, 1142, 209.
12. Chen, R.; Guo, H.; Shen, Y.; Hu, Y.; Sun, Y.; Sens. Actuators, A 2006, 114, 1100.
13. Shakalisava, Y.; Poitevin, M.; Viovy, J.-L.; Descroix, S.;
J. Chromatogr., A2009, 1216, 1030.
14. Saito, R. M.; Neves, C. A.; Lopes, F. S.; Blanes, L.; Brito-Neto, J. G. A.; Do Lago, C. L.; Anal. Chem.2007, 79, 215. 15. Seiman, A.; Vaher, M.; Kaljurand, M.; J. Chromatogr., A2008,
1189, 266.
16. Huang, X.; Gordon, M. J.; Zare, R. N.; Anal. Chem. 1988, 60, 1837.
17. Locascio, L. E.; Perso, C. E.; Lee, C. S.; J. Chromatogr., A 1999, 857, 275.
18. Gaudioso, J.; Craighead, H. G.; J. Chromatogr., A2002, 971, 249. 19. Wang, C.; Wong, T. N.; Yang, C.; Ooi, K. T.; Int. J. Heat Mass
Transfer2007, 50, 3115.
20. Almutairi, Z. A.; Glawdel, T.; Ren, C. L.; Johnson, D. A.;
Microluid Nanoluid2009, 6, 241.
21. Wang, W.; Wu, W.; Zhou, F.; Zhang, J.-R.; Miao, Q.; Zhu, J.-J.;
Chromatographia2009, 69, 897.
22. Do Lago, C. L.; Neves, C. A.; de Jesus, D. P.; da Silva, H. D. T.; Brito-Neto, J. G. A.; da Silva, J. A. F.; Electrophoresis2004,
25, 3825.
23. Coltro, W. K. T.; Piccin, E.; Carrilho, E.; de Jesus, D. P.; da Silva, J. A. F.; da Silva, H. D. T.; Do Lago, C. L.; Quim. Nova 2007, 30, 1986.
Submitted: June 25, 2010
Published online: January 20, 2011
FAPESP has sponsored the publication of this article. Figure 4. Results for the EOF monitoring in PDMS microchip using the
photometric method (OPT101) and the current method. Conditions: High voltage: 1000 V; Dye: 0.1 and 1.0 mmol L-1 methylene blue in 20 mmol L-1
Supplementary Information
S
I
J. Braz. Chem. Soc., Vol. 22, No. 4, S1-S2, 2011. Printed in Brazil - ©2011 Sociedade Brasileira de Química 0103 - 5053 $6.00+0.00
*e-mail: [email protected]
Visible LED-Based Instrumentation for Photometric Determination of
Electroosmotic Flow in Microchannels
José Alberto Fracassi da Silva,*,a,b Ariane Deblire,a Dosil P. de Jesusª,b and Wendell Karlos T. Coltrob,c
aInstituto de Química, Universidade Estadual de Campinas, 13083-970 Campinas-SP, Brazil
bInstituto Nacional de Ciência e Tecnologia em Bioanalítica (INCTBio), Campinas-SP, Brazil
cInstituto de Química, Universidade Federal de Goiás, 74001-970 Goiânia-GO, Brazil