Article
Printed in Brazil - ©2017 Sociedade Brasileira de Química0103 - 5053 $6.00+0.00*e-mail: [email protected]
MALDI Imaging Mass Spectrometry of Fresh Water Cyanobacteria: Spatial
Distribution of Toxins and Other Metabolites
Beatriz B. Sandonato,a Vanessa G. Santos,b Milena F. Luizete,a João L. Bronzel Jr.,a Marcos N. Eberlinb and Humberto M. S. Milagre*,a
aInstituto de Química, Universidade Estadual Paulista “Júlio de Mesquita Filho” (UNESP), 14800-060 Araraquara-SP, Brazil
bLaboratório Thomson de Espectrometria de Massas, Instituto de Química, Universidade Estadual de Campinas (UNICAMP), 13084-971 Campinas-SP, Brazil
Cyanobacteria are among the most ancient forms of life, yet they are known to synthesize highly sophisticated defense molecules, such as the highly hepatotoxic cyclic peptides microcystins and nodularins produced by the genera Microcystis, Anabaena and Nodularia. These metabolites are released by cyanobacteria to water environments causing episodes of fatalities among animals and humans. To better understand the releasing of these metabolites, imaging mass spectrometry (IMS) using matrix-assisted laser desorption ionization-time of flight (MALDI-TOF) was herein applied to determine the spatial distribution of such toxins directly on agar-based cultures. Other key metabolites such as aeruginosin 602 and the siderophore anachelin were also mapped in mixed cyanobacterial cultures, showing the great potential of IMS to spatially monitor the biochemical details of cyanobacterial defense and interactions.
Keywords: cyanobacteria, MALDI-TOF, mass spectrometry, imaging
Introduction
Cyanobacteria are believed to represent one of the most ancient yet highly sophisticated forms of life1 and
these gram-negative oxygenic photosynthetic autotrophic microorganisms are adapted to various ecological habitats such as fresh water, marine, brackish, glaciers, and terrestrial environments.2 Fresh and brackish water cyanobacteria
are known to produce a diversity of highly elaborated secondary metabolites, with a truly fascinating variety
of structures that exhibit a broad range of applications in the food, nutritional, cosmetic, pharmaceutical and nutraceutical industries.3
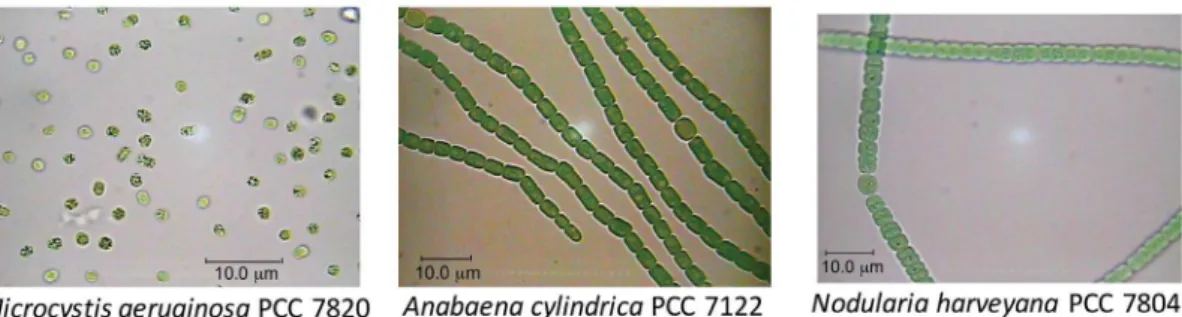
Bloom-forming cyanobacteria (Figure 1), for instance, such as Microcystis aeruginosa, Anabaena cylindrica and
Nodularia harveyana, are known to produce a variety of bioactive metabolites.
Among these metabolites, cyclic and linear peptides such as microcystin, nodularin, aeruginosin, anabaenopeptin, cyanopeptolin, microginin, cyclamides and microviridin
are found, which show activity against various proteases or protein phosphatases.4 Most of these potent and
“dangerous” peptides are released by the cyanobacteria cells into the environment and numerous cases of cyanobacteria poisoning in animals and humans have been reported worldwide.5 Some cyanobacteria also produce
iron chelators known as siderophores such as anachelin, schizokinen and synechobactin.6
There is an interesting behavior of these metabolites, among which the cyclic peptides microcystins and nodularins are such that they are retained inside the cell membrane, whereas anachelin finds its way out in the form of a siderophore, which passes through the membrane into and out of the cell.
Mass spectrometry (MS) and mainly matrix-assisted laser desorption ionization-mass spectrometry (MALDI-MS) has grown tremendously as a powerful tool to analyze secondary metabolites of microorganisms7
and other species such as virus,8 bacteria9 and embryos.10
MALDI-MS has also been demonstrated to offer a suitable technique for the analysis of cyanobacteria metabolites and cyanobacteria extracts.11
Imaging mass spectrometry (IMS) that incorporates spatial distribution is an emerging and promising new technology for metabolomics MS analysis. This methodology was introduced in 1997 by Caprioli et al.12
and mostly applied to create 2D images based on the spatial distribution of peptides and protein across the surface of intact biological tissues. MALDI-IMS combines the high sensitivity and selectivity of MS with 2D surface screening analysis, and its scope has been expanded to deliver spatial distributions of several biomolecules such as metabolites and lipids in different biological matrices.13 This technique
has also been applied for analysis of microbial natural products,14 microbial interactions15 and metabolic profiling
of microorganisms.16 Recently, MALDI-IMS has been
tested for filamentous marine cyanobacteria,17 showing the
spatial distribution of natural products. The main challenges in MALDI-IMS are the sample preparation and the spatial resolution. The sample preparation protocol needs to be selected carefully because an inappropriate application of the matrix may lead to the loss of information of the section analyzed. But the spatial resolution achieved to date is about 10 µm, far from the typical diameter of bacterial cells which lies between 0.2 and 2.0 µm.18
We report herein an investigation of the suitability of MALDI-IMS to visualize the spatial distributions of hepatotoxic cyclic peptides and other key metabolites, and hence to monitor the chemical dynamics of the interactions in cultures and mixed cultures of fresh water cyanobacteria directly on agar plates.
Experimental
Cyanobacteria cultures
The cyanobacteria cultures Microcystis aeruginosa
PCC 7820, Nodularia harveyana PCC 7804 and
Anabaena cylindrica PCC 7122 were provided by The Pasteur Culture collection of Cyanobacteria (PCC), France.
The species Microcystis aeruginosa PCC 7820 and
Nodularia harveyana PCC 7804 were grown in 1.0 L Fernbach flasks containing 0.5 L of modified BG-11
medium, BG-110 (BG-11 medium without nitrate) +
NaNO3 (2.0 mmol L-1) + NaHCO3 (10.0 mmol L-1). The
cyanobacteria Anabaena cylindrica PCC 7122 was grown in BG-110 medium. All strains were maintained at 25 °C
at a photon flux density of approximately 5.0 µmol m-2 s-1
and a regime of 12 h light/12 h dark.
Sample preparation
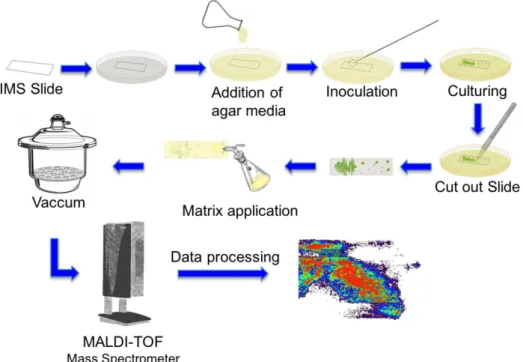
Cyanobacterial MALDI-IMS sample preparation workflow (Scheme 1) starts with the addition of 10.0 mL of agar media over the Petri dish with glass slide for MALDI imaging inside. The agar is 1.0 to 1.5 mm thick; with the final concentration of 0.6% and for these experiments we used the modified BG-11 medium. Afterwards, 50.0 µL of cyanobacteria culture was inoculated on agar-based medium directly on top of the MALDI glass slide and spread with the inoculation loop.
The Petri dishes were sealed with Parafilm M® and
placed in a germination chamber with photoperiod, TECNAL TE-401, at 25 °C at a photon flux density of approximately 5.0 µmol m-2 s-1 and a regime of 12 h
light/12 h dark for three weeks. After this, the culturing glass slide was removed by cutting the surrounding with scalpel. Using a TLC sprayer flask, the saturated solution of α-cyano-4-hydroxycinnamic acid was spread over the
glass slide with the microbial culture, after that, it was put in a desiccator with vacuum for 20 minutes. The prepared glass slide was put on a target for MALDI imaging with two conductive-surface microscope slides.
MALDI imaging
rastered along the x- and y-axis of selected regions at 200 µm resolution. Each spectrum was acquired from 500 laser shots on a single spot. The range over which ions were detected was m/z 500 to 2200. The laser power range was adjusted to 50-70% before the imaging experiment to yield optimal results. MALDI imaging measurements were done in operating conditions as follows: ion source 1 = 19.00 kV, ion source 2 = 16.6 kV, lens voltage = 8.50 kV, reflector voltage 1 = 21.00 kV, reflector voltage 2 = 9.70 kV, pulsed ion extraction time = 120 ns, and suppression = 500 Da. Images were created and normalized using the FlexImaging software.
Results and Discussion
Scheme 1 shows the MALDI-IMS workflow used. The first step was the preparation of a glass slide for MALDI-IMS with the agar medium and the inoculation of cyanobacteria. After three weeks, the culture was ready and the glass slide was removed from the Petri dish and setup for the MALDI-IMS experiment.
As a test case, we studied the cyanobacteria
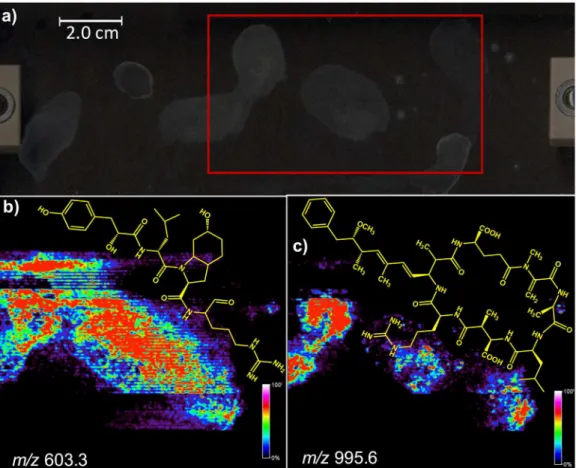
Microcystis aeruginosa PCC 7820, which was selected due to its high ecological and economic relevance since it is known to form quite harmful blooms.19 Figure 2a shows the glass slide
with the M. aeruginosa PCC 7820 colonies. The red rectangle shows the area to which the α-cyano-4-hydroxycinnamic
acid matrix was applied for MALDI-IMS monitoring.
Many ions of m/z ranging from 550 to 1500 with
contrasting spatial distributions were detected and their
images, as Figure 2 illustrates. Some of these ions were identified as variants of the aeruginogins and microcystin toxins. The linear peptide aeruginosin 602 (Figure 3) was detected as its protonated molecule of m/z 603.3 and Figure 2b shows its spatial distribution as revealed by MALDI-IMS. Comparing the morphology of the colonies (Figure 2a) with the IMS of Figure 2b, it is clear that aeruginosin 602 (m/z 603.3) is secreted by the colonies spreading all over their surroundings.
The cyanobacteria M. aeruginosa PCC 7820 is known to produce several hepatotoxic cyclic heptapeptide microcystins, mainly the variants microcystin-LR (MC-LR) and the [D-Asp3]-microcystin-LR ([D-Asp3]-MC-LR),
Figure 4.20 Indeed, as Figure 2c shows, the IMS detects an
ion of m/z 995.6 related to microcystin-LR (MC-LR), which is found in greater abundance inside the colonies. This IMS data perfectly reflects what is known for such peptide, that it has been reported to be unable to pass through the cell membrane being secreted to the environment.6
The relative abundances of the microcystins variants MC-LR (m/z 995.6) and [D-Asp3]-MC-LR (m/z 981.5)
could also be monitored by MALDI-IMS (Figure 5). MC-LR was detected over the three colonies, whereas
the [D-Asp3]-MC-LR peptide was clearly much more
abundant on the left colony. This spatial distribution is in agreement with the microcystins variants produced by the cyanobacteria M. aeruginosa PCC 7820 in which MC-LR is known to largely dominate over [D-Asp3]-MC-LR.20
Figure 6 shows the IMS for another colony of
M. aeruginosa PCC 7820, where a similar spatial distribution
pattern for the ions of m/z 603.3 (aeruginosin 602) and
m/z 995.6 (MC-LR) is exhibited. That is, aeruginosin 602 (Figure 6b) spreads all over the colony and its surroundings whereas MC-LR resides inside the colony (Figure 6c).
The interactions between two different species of cyanobacteria, that is, Nodularia harveyana PCC 7804, which produces the hepatotoxic cyclic pentapeptides nodularins (Figure 7),21 and the Anabaena cylindrica
PCC 7122, which was selected for being a nontoxic strain that produces the linear peptide siderophore anachelin (Figure 8), were also monitored by IMS.22
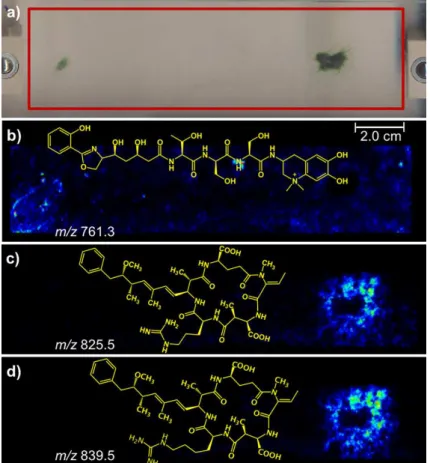
Figure 9a shows the glass slide for the cyanobacteria cultures on an agar plate, inoculated on the right side with the N. harveyana PCC 7804 strain and on the left side
the A. cylindrica PCC 7122 strain. Note in Figure 9b that IMS reveals that the siderophore anachelin (m/z 761.3) is spread all over the slide except over the area occupied by the colony of N. harveyana PCC 7804. This result agrees with the properties of anachelin because it is known to be released by the cells of A. cylindrica PCC 7122 and to diffuse on agar.22
Figure 2. MALDI-IMS of colonies of Microcystis aeruginosa PCC 7820. (a) Scanned area highlighted via a red rectangle; (b) image generated by monitoring the ion of m/z 603, corresponding to the protonated molecule of the linear peptide aeruginosin 602; (c) image obtained for the ion of m/z 995, corresponding to the spatial distribution of MC-LR.
Figure 3. Structure of linear peptide aeruginosin 602.
Figure 5. MALDI-IMS images for microcystins variants of Microcystis aeruginosa PCC 7820: (a) microcystin-LR (m/z 995.6) and (b) [D-Asp3
]-microcystin-LR (m/z 981.5).
Figure 6. MALDI-IMS images for colonies of Microcystis aeruginosa PCC 7820 with the scanned area (a). Images of (b) linear peptide aeruginosin 602 (m/z 603.3) and (c) cyclicpeptide microcystin-LR (m/z 995.6).
Figure 7. Structures of nodularin variants: nodularin-R (Nod-R) and nodularin-[Har] (Nod-[Har]).
Figures 9c and 9d show the MALDI-IMS for nodularin-R (Nod-R, m/z 825.5) and nodularin-[Har] (Nod-[Har], m/z 839.5), respectively. Note that these nodularins show the same behavior as the microcystins, being in greater abundances inside the colonies of the
N. harveyana PCC 7804.
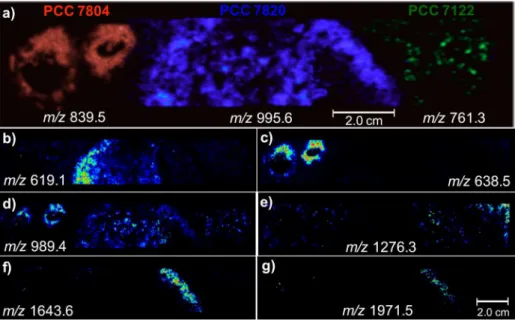
Next, a culture on agar of three cyanobacteria species with the N. harveyana PCC 7804 inoculated on the left side, the M. aeruginosa PCC 7820 inoculated on the center and the A. cylindrica PCC 7122 inoculated on the right side, was subjected to MALDI-IMS (Figure 10). Characteristic ions for each species were monitored, that is, the nodularin Nod-[Har] biomarker of m/z 839.5 in red for the N. harveyana PCC 7804, the microcystins MC-LR of m/z 995.6 in blue for M. aeruginosa PCC 7820 and the anachelin of m/z 761.3 in green for A. cylindrica PCC 7122. Note in Figure 10a that the selection of such biomarker ions allows IMS to properly draw morphologically precise shapes of each respective colony. Note that anachelin (m/z 761.3) is indeed exclusive for the colonies of the
Anabaena cylindrica PCC 7122. Note also that the ions of
m/z 619.1 (Figure 10b), 1643.6 (Figure 10f) and 1971.5 (Figure 10g) are in greater abundance between colonies and, therefore, related to “cross talking”.14,15,22 The ion of m/z
638.5 (Figure 10c) is, however, in greater abundance only on the colonies of the N. harveyana PCC 7804. The ion of
m/z 989.4 (Figure 10d) is detected in all the three colonies, whereas that of m/z 1276.3 (Figure 10e) is abundant except for the colonies of the M. aeruginosa PCC 7820.
Conclusions
Selective MALDI-IMS of fresh water cyanobacteria cultures was obtained directly from agar culture with sufficient sensitivity and conserved spatial distribution. Characteristic 2D profiles revealed details of the dynamics of peptide distribution within the colony and between colonies of the different species. Distribution of biomolecules related to the “cross talking” process could also be detected on the boundaries between the colonies.
These chemically selective images obtained directly from agar cultures on prototype fresh water cyanobacteria indicate that is an important tool and can be used to understand the releasing dynamics of toxic peptide by cyanobacteria to the environment, as well as in their defense during cross talking processes involving secondary metabolites.
Figure 10. MALDI-IMS images for three cyanobacteria species N. harveyana PCC 7804, M. aeruginosa PCC 7820 and A. cylindrica PCC 7122. (a) Images for the biomarkers nodularin Nod-[Har] (m/z 839.5), microcystins MC-LR (m/z 995.6) and anachelin (m/z 761.3); (b) to (g): images for the unknown ions
m/z 619.1, 638.5, 989.4, 1276.3, 1643.6 and 1971.5.
Acknowledgments
We thank the Brazilian research foundations FAPESP, CNPq and CAPES for their financial support.
References
1. Butterfield, N. J.; Palaeontology 2015, 58, 953. 2. Sciuto, K.; Moro, I.; Biodivers. Conserv. 2015, 24, 711. 3. Rastogi, R. P.; Sinha, R. P.; Biotechnol. Adv. 2009, 27, 521. 4. Welker, M.; von Döhren, H.; FEMS Microbiol. Rev. 2006, 30,
530.
5. Ding, J.; Shi, H.; Timmons, T.; Adams, C.; J. Environ. Eng.
2010, 136, 2; Sakai, H.; Oguma, K.; Katayama, H.; Ohgaki, S.; Water Res. 2007, 41, 3458.
6. Wörmer, L.; Huerta-Fontela, M.; Cirés, S.; Carrasco, D.; Quesada, A.; Environ. Sci. Technol. 2010, 44, 3002.
7. Luzzatto-Knaan, T.; Melnik, A. V.; Dorrestein, P. C.; Analyst
2015, 140, 4949; Krug, D.; Müller, R.; Nat. Prod. Rep. 2014,
31, 768; Jarmusch, A. K.; Cooks, R. G.; Nat. Prod. Rep. 2014,
31, 730; Tuiche, M. V.; Lopes, A. A.; Silva, D. B.; Lopes, N. P.;
Pupo, M. T.; Rev. Bras. Farmacogn. 2014, 24, 433; Stafsnes, M. H.; Dybwad, M.; Brunsvik, A.; Bruheim, P.; Antoine van Leeuwenhoek 2013, 103, 603.
8. Caldenaro, A.; Arcangeletti, M. C.; Rodighiero, I.; Buttrini, M.; Gorrini, C.; Motta, F.; Germini, D.; Medici, M. C.; Chezzi, C.; de Conto, F.; Sci. Rep. 2014, 4, 6803.
9. Barreiro, J. R.; Braga, P. A. C.; Ferreira, C. R.; Kostrzewa, M.; Maier, T.; Wegemann, B.; Böettcher, V.; Eberlin, M. N.; dos Santos, M. V.; Proteomics 2012, 12, 2739.
10. Ferreira, C. R.; Saraiva, S. A.; Catharino, R. R.; Garcia, J. S.;
Gozzo, F. C.; Sanvido, G. B.; Santos, L. F. A.; lo Turco, E. G.; Pontes, J. H. F.; Basso, A. C.; Bertolla, R. P.; Sartori, R.; Guardieiro, M. M.; Perecin, F.; Meirelles, F. V.; Sangalli, J. R.; Eberlin, M. N.; J. Lipid. Res. 2010, 51, 1218.
11. Spengler, B.; Anal. Chem. 2015, 87, 64.
12. Caprioli, R. M.; Farmer, T. B.; Gile, J.; Anal. Chem. 1997, 69, 4751; Tata, A.; Motemurro, C.; Porcari, A. M.; Silva, K. C.; Faria, J. B. L.; Eberlin, M. N.; Drug Test Anal. 2014, 6, 949; Tata, A.; Fernandes, A. M. A. P.; Santos, V. G.; Alberici, R. M.; Araldi, D.; Parada, C. A.; Braguini, W.; Veronez, L.; Bisson, G. S.; Reis, F. H. Z.; Alberici, L. C.; Eberlin, M. N.; Anal. Chem.
2012, 84, 6341.
13. Bousimani, A. L.; Sanchez, M.; Garg, N.; Dorrestein, P. C.; Nat. Prod. Rep. 2014, 31, 718; Esquenazi, E.; Yang, Y.; Watrous, J.; Gerwick, W. H.; Dorrestein, P. C.; Nat. Prod. Rep. 2009, 26, 1521.
14. Shih, C.; Chen, P.; Liaw, C.; Lai, Y.; Yang, Y.; Nat. Prod. Rep.
2014, 31, 739.
15. Gonzalez, D. J.; Xu, Y.; Yang, Y.; Esquenazi, E.; Liu, W.; Edlund, A.; Duong, T.; Du, L.; Molnár, I.; Gerwick, W. R.; Jensen, P. R.; Fischbach, M.; Liae, C.; Straight, P.; Nizet, V.; Dorrestein, P. C.; J. Proteomics 2012, 75, 5069; Yang, J. Y.; Phelan, V. V.; Simkovsky, R.; Watrous, J. D.; Trial, R. M.; Fleming, T. C.; Wenter, R.; Moore, B. S.; Golden, S. S.; Pogliano, K.; Dorrestein, P. C.; J. Bacteriol. 2012, 194, 6023.
16. Esquenazi, E.; Coates, C.; Simmons, L.; Gonzalez, D.; Gerwick, W. H.; Dorrestein, P. C.; Mol. BioSyst. 2008, 4, 562.
17. van Apeldoorn, M. E.; van Egmond, H. P.; Speijers, G. J. A.; Bakker, G. J. I.; Mol. Nutr. Food Res. 2007, 51, 7; Codd, G. A.; Morrison, L. F.; Metcalf, J. S.; Toxicol. Appl. Pharmacol. 2005,
2014, 59, 1783; Mowe, M. A. D.; Mitrovic, S. M.; Lim, R. P.; Furey, A.; Yeo, D. C. J.; J. Limnol. 2015, 74, 205; Jakubowska, N.; Szelag-Wasielewska, E.; Mar. Drugs 2015, 13, 1497; Boopathi, T.; Ki, J.; Toxins 2014, 6, 1951.
18. Weaver, E. M.; Hummon, A. B.; Adv. Drug Deliv. Rev. 2013,
65, 1039.
19. Rios, V.; Moreno, I.; Prieto, A. I.; Soria-Díaz, M. E.; Frías, J. E.; Carmeán, A. M. J.; Water Health2014, 12, 69; Robillot, C.; Vinh, J.; Puiseux-Dao, S.; Hennion, M.; Environ. Sci. Technol.
2000, 34, 3372.
20. Saito, K.; Konno, A.; Ishii, H.; Saito, H.; Nishida, F.; Abe, T.; Chen, C.; J. Nat. Prod. 2001, 64, 139; Beattie, K. A.; Kaya, K.; Codd, G. A.; Phytochemistry 2000, 54, 57.
21. Calteau, A.; Fewer, D. P.; Latifi, A.; Coursin, T.; Laurent, T.; Jokela, J.; Kerfeld, C. A.; Sivonen, K.; Piel, J.; Gugger, M.;
BMC Genomics 2014, 15, 977; Ito, Y.; Ishida, K.; Okada, S.; Murakami, M.; Tetrahedron 2004, 60, 9075; Itou, Y.; Okada, S.; Murakami, M.; Tetrahedron 2001, 57, 9093; Raghuvanshi, R.; Singh, S.; Bisen, P. S.; Indian J. Exp. Biol. 2007, 45, 563. 22. Zhai, C.; Zhang, P.; Shen, F.; Zhou, C.; Liu, C.; FEMS
Microbiol. Lett. 2012, 336, 38.
Submitted: February 21, 2016
Published online: June 28, 2016
![Figure 5. MALDI-IMS images for microcystins variants of Microcystis aeruginosa PCC 7820: (a) microcystin-LR (m/z 995.6) and (b) [D-Asp 3 ]- ]-microcystin-LR (m/z 981.5).](https://thumb-eu.123doks.com/thumbv2/123dok_br/19001100.463773/5.892.154.766.112.342/figure-maldi-microcystins-variants-microcystis-aeruginosa-microcystin-microcystin.webp)