NUMERICAL SIMULATION OF WIND WAVES ON THE RÍO DE LA PLATA:
EVALUATION OF FOUR GLOBAL ATMOSPHERIC DATABASES
Paula Martin1,2,3,*, Walter Dragani1,2,3, Bibiana Cerne3,4, Guadalupe Alonso1,2,3, Andrés Pescio1 and Bárbara Prario1
1
Servicio de Hidrografía Naval y ESCM-INUN
(Av. Montes de Oca 2124 (C1270ABV) Ciudad Autónoma de Buenos Aires, Argentina)
2
CONICET, Consejo Nacional de Investigaciones Científicas y Técnicas (Av. Rivadavia 1917. (C1033AAJ) Ciudad Autónoma de Buenos Aires, Argentina)
3Departamento de Ciencias de la Atmósfera y los Océanos, Facultad de Ciencias Exactas y Naturales, UBA,
(Ciudad Universitaria, Pabellón II, 2do. Piso. (C1428EGA) Ciudad Autónoma de Buenos Aires, Argentina)
4
Centro de Investigaciones del Mar y la Atmósfera (CIMA/CONICET-UBA)
(Ciudad Universitaria, Pabellón II, 2do. Piso. (C1428EGA) Ciudad Autónoma de Buenos Aires, Argentina)
*
Corresponding author [email protected]
A
B S T R A C TThe performance of NCEP/NCAR I, NCEP/DOE II, JRA-25 and ERA-Interim global databases, implemented as atmospheric forcings of the SWAN model in the Río de la Plata region, was quantitatively tested by calculating the bias, the mean square root error, the determination coefficient and the slope of the line fitted between observed and simulated wave parameters (significant wave height, mean period and direction). Even though statistical estimators showed no evident differences for wave periods and directions some noticeable differences were observed for simulated significant wave heights depending on the forcing used. The lowest bias (0.22 m) was obtained when the SWAN model was forced by ERA-Interim. With regard to the mean square root errors, the lowest values were obtained when NCEP/NCAR I (0.16 m) and NCEP/DOE II (0.19 m) were used as forcing. In addition, the best slope for simulated heights (0.79) was obtained using NCEP/DOE II. Computed determination coefficients for heights, periods and directions were very similar (0.89-0.93) for all the simulations carried out in this study. Energetic and severe wave events were given special consideration. The most energetic wave episode recorded in the Río de la Plata mouth (24 August, 2005) was analyzed and discussed in particular. It was concluded that during energetic atmospheric conditions the best agreement is achieved by implementing NCEP/DOE II as forcing. In the light of these results it is concluded that NCEP/DOE II is the most suitable atmospheric forcing to simulate wave heights with the SWAN model in the Río de la Plata region.
R
E S U M ONa região do Rio de la Plata, o desempenho das reanálises globais do NCEP/NCAR I, NCEP/DOE II, JRA-25 e ERAInterim implementadas como forçantes atmosféricas do modelo SWAN foram quantitativamente acessados através do viés, erro quadrático médio, coeficiente de determinação e inclinação da reta. Estes índices foram obtidos dos parâmetros de ondas observados e simulados (alturas significativas de ondas, período principal e direção). Embora as estimativas estatísticas não mostrem diferenças evidentes para períodos e direções, algumas diferenças notáveis foram obtidas para altura de ondas simuladas, dependendo do vento utilizado. O menor viés para altura significativa (0.22 m) foi obtido quando o SWAM foi forçado com a ERAInterim, enquanto o NCEP/NCAR I (0.16 m) e NCEP/DOE II (0.19 m) forneceram menor erro quadrático médio. A melhor inclinação da reta entre simulação e observação de altura significativa (0.79) foi obtida usando NCEP/DOE II. No período de estudo, o maior episódio de onda registrado na boca do Río de la Plata foi analisado e discutido. Neste evento de condições atmosféricas energéticas o melhor ajuste foi alcançado utilizando os ventos do NCEP/DOE II como forçante. Conclui-se que a base de dados NCEP/DOE II é forçante atmosférica mais adequada para simular alturas significativas de ondas com o modelo SWAN na região estudada.
Descriptors: NCEP/NCAR Reanalysis I, NCEP/DOE reanalysis II, JRA-25 reanalysis, ERA-Interim; SWAN model; Río de la Plata.
I
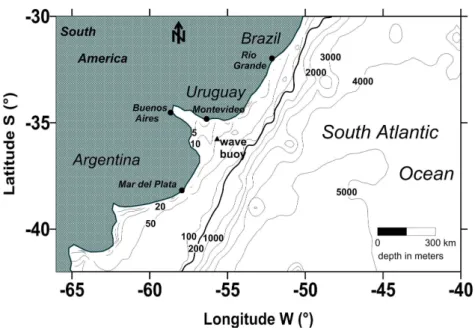
NTRODUCTIONCoastal impacts related to a possible wind wave change on the South-eastern South American Continental Shelf were reported by Dragani et al. (2011) and Codignotto et al. (2012) who studied trends in mean annual wind wave heights implementing Simulating Waves Nearshore (SWAN, BOOIJ, et al., 1999; RIS et al., 1999) model forced with surface winds from National Center for Environmental Prediction/National Center for Atmospheric Research (NCEP/NCAR) Reanalysis I (KALNAY et al., 1996) in a regional domain which includes the Río de la Plata (RDP) estuary and the adjacent continental shelf. The RDP, located on the eastern coast of southern South America at approximately 35°S (Fig. 1), is one
of the largest estuariesin the world
(SHIKLOMANOV, 1998). It has a northwest to southeast oriented funnel shape approximately 300 km long that narrows from 220 km at its mouth to 40 km at its upper end. Through its system of dredged channels the RDP estuary constitutes the main maritime access to Argentina and Uruguay.
The validation of this kind of regional wave modelin this region constitutes a permanent challenge to local modelers due to the paucity of wave
measurements (INNOCENTI et al.,1996; DRAGANI;
ROMERO, 2004) and thelack of a well validated and
reliable high resolution atmospheric numerical model to provide a realistic wind forcing on the ocean. Pianca et al. (2010) provide a description of the wave climate off the Brazilian coast based on an eleven-year
time series (Jan/1997-Dec/2007) obtained from the NWW3 operational model hindcast reanalysis. Da Rocha et al. (2004) presented results relating to the atmospheric conditions and the hindcast of the surface wave field when six extratropical cyclones formed and were displaced over the South Atlantic Ocean between April and September 1999. These events caused high sea waves associated with hazardous conditions along the southern and southeastern coast of Brazil. Some efforts regarding the implementation of realistic wind forcing on the ocean have been presented by Campetella and Saulo (2003) and Ruiz et al. (2010). On the other hand, the unique set of long-term in situ observations of waves available for the region was collected by means of a Datawell Waverider directional wave recorder moored in the outer RDP estuary (Fig. 1). Given the lack of historical direct wind observations over the estuary and the adjacent continental shelf and the low temporal resolution and short time span of satellite wind data, studies of wind variability (SIMIONATO et al., 2005) and sea surface elevation hindcasting (SIMIONATO et al., 2006a) in the region have been mostly based on data/model derived products such as the reanalysis of
NCEP/NCAR I (KALNAY et al., 1996). There
arevarious examples which illustrate that
NCEP/NCAR Reanalysis I has been successfully implemented as forcing in several regional studies
(see, for instance, SIMIONATO et al.,
2005; SIMIONATO et al., 2006a; SIMIONATO et al., 2006b; SIMIONATO et al., 2007).
The aim of this present paper is to investigate the performance of four global atmospheric databases as forcings of the SWAN model to simulate the most realistic wave parameters in the RDP region. The SWAN model has been selected because it has undergone significant testing (perhaps the most extensive testing of any shallow-water wave model) and has been successfully applied all overthe world (ALLARD et al., 2002). In this study, theSWAN model has been forced by (i) NCEP/NCAR Reanalysis I, (ii) NCEP/DOE Reanalysis II (KANAMITSU et al., 2002), (iii) ERA-Interim (DEE et al., 2011) and (iv) the JRA-25 Reanalysis (ONOGI et al., 2007) and the simulated parameters obtained are compared with observed wave parameters in the outer RDP. Statistical estimators are calculated, analyzed and discussed in this paper.
M
ATERIAL ANDM
ETHODS
SWAN is a numerical wave model that provides realistic estimates of wave parameters in coastal areas (BOOIJ et al., 1999; RIS et al., 1999). Even though this model was specifically designed for coastal applications, it could be applied to wind generated surface gravity waves on any scale (HOLTHUIJSEN et al., 2004). The model is based on the wave action balance equation. The spectrum considered is the action density spectrum rather than the energy density spectrum since in the presence of currents, action density is conserved; whereas energy density is not (WHITHAM, 1974). A detailed explanation of the formulation of wind input, wind
drag coefficient formulation, dissipation
(whitecapping, bottom friction and depth-induced breaking) and nonlinear wave-wave interaction terms can be seen in Holthuijsen et al. (2004). The frequency space generated in the numerical simulations presented in this paper has 20 frequencies, between 0.05 and 1.00 Hz. The SWAN model is initialized at rest and wave parameters are set to zero at every grid point. Using this initial condition the first wave parameter fields can be quite misleading, so the first two days of all the numerical simulations were
disregarded. Particular details of theSWAN model
implementation in the computational domain adopted can be seen in Dragani et al. (2008).
Data 1. Waves
The only set of long-term in situ observations of directional waves available for the
region was collected between 1996 and 2009, by means of a Datawell Waverider directional wave
recorder (DATAWELL, 1997) moored in the outer
Río de la Plata estuary at 35°40’S and 55°50’W (Fig. 1). The instrument was programmed to measure 20-minute sea level records with a 0.5 s sampling interval every 2 hours and 40 minutes. The record has several gaps, one of them longer than one year (from October 2003 to November 2004), three of them eight months long (March 1998 to October 1998; November 1998 to June 1999; November 2008 to June 2009) and six others of various durations of from two to seven months (CODIGNOTTO et al., 2012).
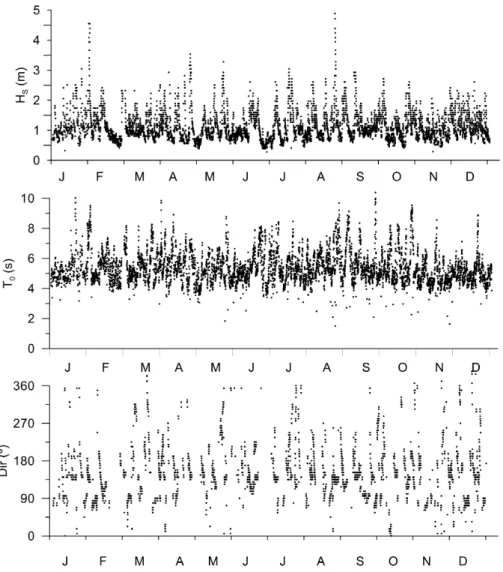
The wave data series and the simulated wave parameters for 2005 (from January to December) - significant wave height (HS), mean period (T0) and
direction - were selected for this study because the data acquisition undertaken in that year was almost complete. Data series of significant wave height, mean period and wave direction gathered on the outer RDP are shown in Figure 2a, b and c, respectively. Significant wave heights are almost always greater than 0.5 m (Fig. 2.a). The minimum, maximum, and mean observed HS (T0) are 0.27 m,
4.89 m, and 1.14 m (1.5 s, 10.4 s, and 5.4 s, Figs. 2.a and b, respectively). The mean observed wave direction (Fig. 2.c) is 153°, corresponding to the southeast as the most frequent direction of wave propagation. Standard deviations of observed HS, T0
and direction are 0.50 m, 1.0 and 65°, respectively. The frequency of occurrence (cases) calculated by Dragani et al. (2004) indicates southeasterly, easterly and southerly as the most frequent directions of propagation, corresponding to 41, 28, and 14% of the cases, respectively, whereas frequencies for the other directions are always equal to or less than 5%.
2. Winds
The atmospheric forcings for the SWAN
the NCEP/NCAR I project and the dataset are given in Kalnay et al. (1996) and discussions on its qualityin the Southern Hemisphere can be found in Simmonds
and Keay (2000), among others. The NCEP/DOE
reanalysis II (KANAMITSU et al., 2002) is based on the widely used NCEP/NCAR I. NCEP/DOE II is an improved version of the NCEP I model with updated
parameterizations of physical processes. This
product has been available since 1979/01/01 and is given as gridded data (spatial resolution: 1.875° in longitude, 1.905° in latitude) with a temporal resolution of 6 h.
The JRA-25 reanalysis represents the first long-term global atmospheric reanalysis undertaken in Asia (ONOGI et al., 2007). It was completed using the numerical assimilation and forecast systemof the Japan Meteorological Agency (JMA) and specially collected and prepared observational and satellite data from many sources including the European
Center for Medium-Range Weather Forecasts
(ECMWF), the National Climatic Data Center (NCDC), and the Meteorological Research Institute (MRI) of JMA. A primary goal of JRA-25 is to provide a consistent and high-quality reanalysis dataset for climate research, monitoring, and operational forecasts, especially by improving the coverage and quality of analysis in the Asian region. The resolution of the model is 1.25º. ERA-Interim was originally planned as an interim reanalysis in preparation for the next-generation extended reanalysis to replace ERA-40. It uses the
European Centre for Medium-Range Weather
Forecasts (ECMWF) Integrated Forecast Model (IFS Cy31r2) version December 2006. It originally covered dates from January 1st, 1989, but an additional decade,
from January 1st, 1979, was added later. The
horizontal resolution is about 80 km and there are 60 vertical levels. The data assimilation is based on a 12-hourly four-dimensional variational analysis (4D-Var) with adaptive estimation of biases in satellite radiance data (VarBC). With some exceptions Interim uses input observations prepared for ERA-40 prior to 2002, and data from ECMWF’s operational archive thereafter (DEE et al., 2011).
3. Bathymetry
The modeled area spans the region between 30°S and 42°S, and 40°W and 65.5°W, approximately, and includes, therefore, regions as dissimilar as the very shallow RDP, the Uruguayan continental shelf, part of the adjacent Argentinian and Brazilian continental shelves, and a portion of the Southwestern Atlantic Ocean (Fig. 1). Bathymetry data for the SWAN was obtained as a combination of a depth dataset with 1´ x 1´ resolution taken from GEBCO
(2003) for the continental shelf and from digitalized
nautical charts for the RDP (SHN, 1986,
1992, 1999a, 1999b). These data were interpolated into the model grid by applying the method of inverse distance to the power (with power equal to 2).
R
ESULTS
Simulated and observed wave parameters (from January to December 2005) were compared using four statisticalestimators: bias, meansquare root error (EMRS), determination coefficient (r2: square
value of the simple linear correlation coefficient) and the slope of the linear fit between 3285 simulated and observed wave parameters taken, approximately, every 2 hours and 40 minutes (Table 1). The computed biases range from 0.22 m (ERA-Interim) to 0.51 m (NCEP/DOE II) for HS. Biases are almost 3 s for
periods and are relatively low (from −2° to 3°) for
directions. Computed EMRS range from 0.16 m
(NCEP/NCAR I) to 0.53 m (JRA - 25) for HS and are
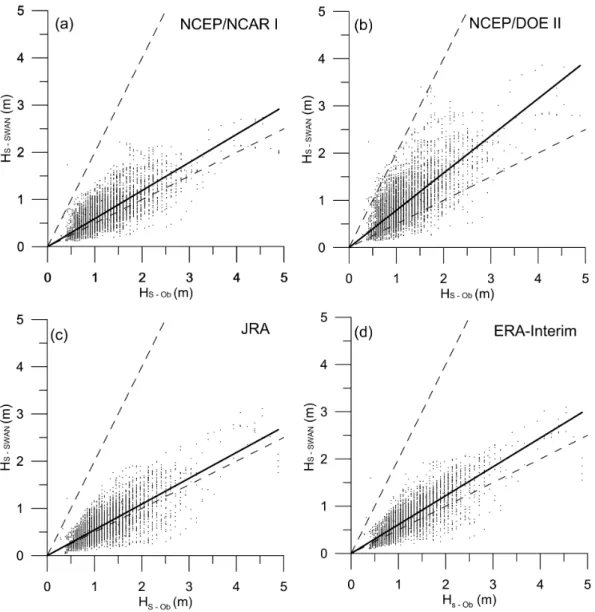
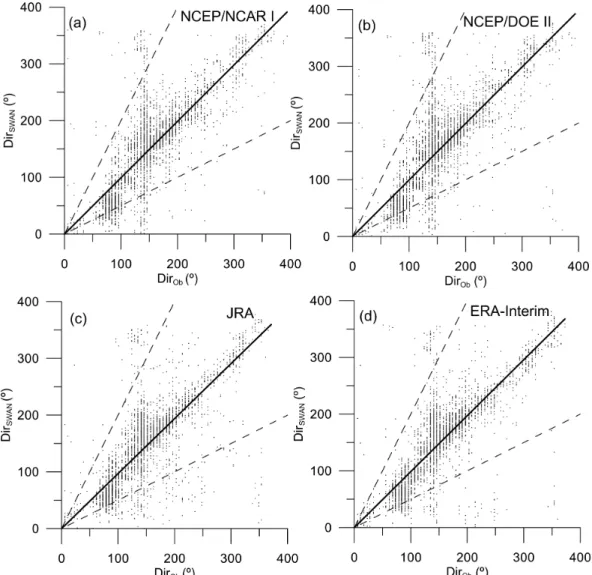
around 3 s for periods and range from 40° (JRA - 25) to 53° (NCEP/DOE II and ERA-Interim) for directions. Dispersion diagrams between observed and simulated wave heights and directions are shown in Figures 3 and 4, respectively. The linear determination coefficients (r2) are similar for H
S(~0.90), T0 (0.92)
and direction (0.91).
It is to be noted that variations in direction greater than 100° are almost always associated with wave heights (observed/simulated) lower than 0.3 m (these cases are mostly located outside the sector formed by the dashed lines with slopes equal to 0.5 and 2, Figure 4). In addition, it is also to be observed that the SWAN model slightly underestimates periods which present relatively large bias and EMRS. This result is consistent with the
conclusions obtained by Lin et al. (2002) in the Cheasapeake Bay and by Dragani et al. (2008) in the
RDP who applied the SWAN model and obtained a
slight underestimation in the simulated periods. Figures corresponding to periods are not shown in this study.
A linear fit with slope (s) equal to unity indicates an accurate agreement between the observations and the simulations. If the slopes are greater than 1, simulated wave parameters are overestimated with respect to the observed ones. On the other hand, if slopes are lower than 1, simulated wave parameters are underestimated. Computed slopes range from 0.55 m (JRA) to 0.79 m (NCEP/DOE II) for HS. The underestimation is a little higher for
Fig. 2. Wave parameters observed at the mouth of the Río de la Plata. Data series of significant wave heights (upper panel), mean periods (central panel) and wave directions (lower panel). Observed wave data were taken every 2 hours and 40 minutes, approximately.
Table 1. Bias, mean root square (square root?) error (Emrs), determination coefficient (r2) and slope (s) between observed and
modeled wave parameters obtained from SWAN simulations forced with NCEP/NCAR I, NCEP/DOE II, JRA-25 and ERA-Interim. Mean values and standard deviations of simulated wave parameters are also presented.
Estimators Bias EMRS r2 s mean SD
GLOBAL MODELS
HS (m)
T0 (s)
Dir (º)
HS (m)
T0 (s)
Dir (º)
HS T0 Dir HS T0 Dir HS (m)
T0 (s)
Dir (º)
HS (m)
T0 (s)
Dir (º) NCEP/NCAR
I
0.45 2.9 0 0.16 3.0 50 0.90 0.92 0.91 0.60 0.45 0.99 0.70 2.5 152 0.35 0.6 80
NCEP/DOE II
0.51 2.6 3 0.19 2.9 53 0.89 0.93 0.91 0.79 0.50 0.97 0.92 2.8 153 0.49 0.7 81
JRA-25 0.45 2.9 0 0.53 3.1 40 0.90 0.93 0.90 0.55 0.44 0.97 0.63 2.4 149 0.35 0.6 75
ERA-Interim 0.22 2.8 -2 0.44 3.1 53 0.93 0.93 0.92 0.61 0.46 0.99 0.70 2.5 152 0.37 0.7 76
Fig. 3. Scatter plot of measured vs. simulated significant wave heights. (a) NCEP/NCAR Reanalysis, (b) NCEP/DOE Reanalysis II, (c) JRA-25 and (d) ERA-Interim. Solid line represents the best adjustment obtained from least root square method. Dashed lines with slopes equal to 0.5 and 2 are included as reference. Observed wave data were taken every 2 hours and 40 minutes, approximately.
D
ISCUSSION
The numerical results previously presented (Table 1) show that the lowest bias (0.22 m) was
obtained whentheSWAN model was forced by
ERA-Interim. Higher biases, a little greater than the double, were obtained using NCEP/NCAR I (0.45 m) and NCEP/DOE II (0.51 m). On the other hand, lower
EMRS for HS are obtained when forcing by
NCEP/NCAR I (0.16 m) and NCEP/DOE II (0.19 m).The best slope for HS (0.79) is obtained with
NCEP/DOE II (but, in general, there are no significant
differences for periods and directions). Computed r2
for heights, periods and directions produced results fairly independent of the forcing, around 0.89-0.93. Bias, EMRS, r2 and s also show very low differences for
periods. Taking into account the aforementioned results it is clear that JRA-25 and Era-Interim produce the highest EMRS for HS (0.53 m and 0.44 m,
respectively). EMRS is an objective statistical measure
of the average of the squares of the differences between observed and simulated wave parameters; consequently, these values place JRA-25 and
NCEP/NCAR I and NCEP/DOE II (which produce EMRS equal to 0.16 m and 0.19 m, respectively). Even
though all selected atmospheric databases produce some underestimation in heights (s lower than 1), the best slope was obtained using NCEP/DOE II.
The above-mentioned underestimation in wave heights could be reduced if the wind drag coefficient were conveniently adjusted. Simionato et al. (2006a) has shown that even though NCEP/NCAR reanalysis I properly reproduces the observed wind direction in the RDP, it tends to underestimate wind speed. Dragani et al. (2008) showed that although simulated waves are proportional to those measured, simulated heights are slightly underestimated as compared those observed. A set of sensitivity
experiments (DRAGANI et al., 2008) has beencarried
out to evaluate a factor that should be applied to the wind drag coefficient adopted by SWAN (WU, 1982) in order to decrease the differences between simulated and observed wave parameters. Following Simionato (2006a), this factor was chosen to depend on the wind speed. A detailed explanation as to the application of this correction factor can be seen in Dragani et al. (2008), where NCEP/NCAR reanalysis I was used as forcing. At present, a similar study is being carried out on the four selected atmospheric databases to further enhance the performance of the SWAN model in the region. Results are being analyzed and will be presentedin an upcoming separate paper.
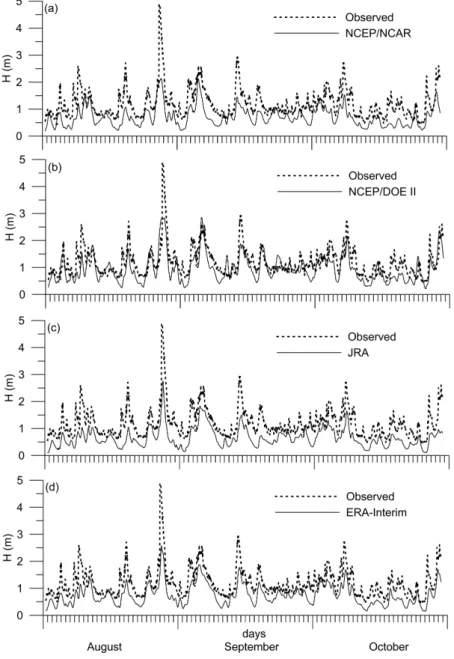
In spite of the fact that significant wave heights are usually low in the outer RDP region - annual mean Hs ranges from 1.0 to 1.3 m (CODIGNOTTO et al., 2012) - events characterized
by significant wave heights somewhathigher than 2 m
are often recorded in this region. A three-month lapse (September – November, 2005) in wave height data series is selected in order to illustrate this fact (Fig. 5). Simulated wave heights forced by NCEP/NCAR I,
NCEP/DOE II, JRA-25 and ERA-Interim are also included in Figure 5. It can be seen that although simulated Hs series presented attenuated peaks, they are properly positioned in time. This fact indicates that all the forcings implemented are able to represent, although with differing degrees of accuracy, the presence of energetic (from moderate to severe) atmospheric events in the region.
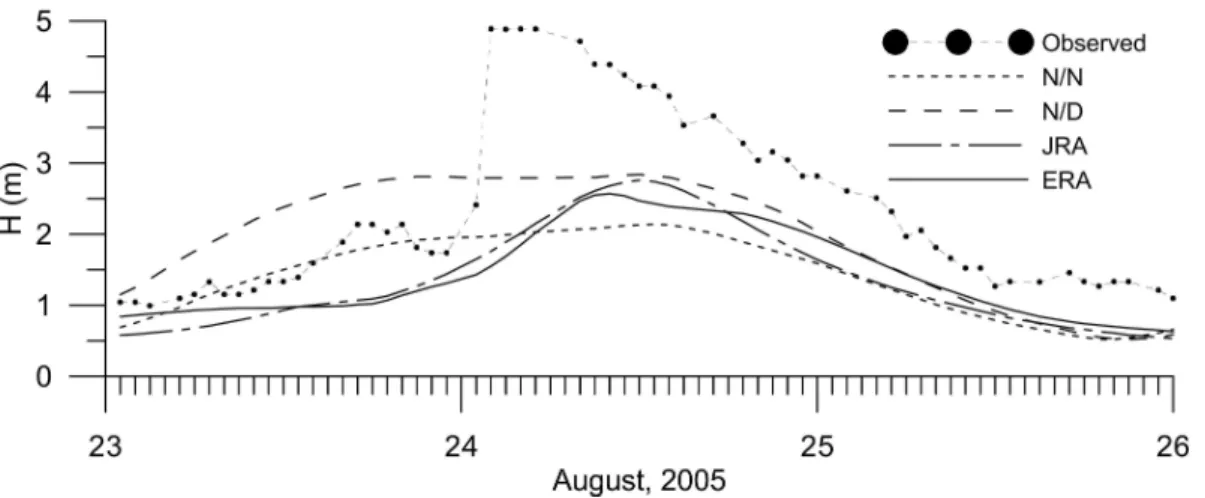
In addition, a particular analysis is carried
outofthe most energetic wind wave event recordedin
the region. On August 23-24, 2005 a deep, intense cyclone developed over the RDP producing strong winds and gusts causing severe damage along the Uruguayan coast (POSSIA et al., 2011). After the occurrence of the strongest gusts, wave heights began to increase reaching the maximum significant height recorded at the RDP mouth (4.89 m, 24 August, 2005). Observed and simulated wave heights, forced by NCEP/NCAR I, NCEP/DOE I, JRA-25 and ERA-Interim, are shown in Figure 6. It can be seen that simulated heights forced by NCEP/DOE II present, in general terms, the best agreement with the observations, especially at the time of the wave peak. Numerical simulations carried out forcing with ERA-Interim and JRA-25 produce an underestimated wave peak, but with a delay of twelve hours. Simulations carried out using the NCEP/NCAR I database as forcing provided the best agreement for the day before the occurrence of the wave peak (August 23). After the occurrence of the wave event (August 25), the four simulated wave height data series converge practically to the same values, approximately, 0.50 m below the observed heights.
C
ONCLUSIONS
Four global atmospheric databases
(NCEP/NCAR I, NCEP/DOE II, JRA-25 and ERA-Interim) were applied as forcing tothe SWAN model in the RDP mouth and on the adjacent continental shelf. The performance of each one was quantitatively tested by means of four statistical estimators (Table 1):
bias, mean square root error, determination coefficient and the slope of the line fitted between observed and simulated wave parameters (heights, periods and directions). From the analysis of these statistical estimators and from the performance of the simulations during energetic atmospheric conditions (for the year 2005) it is concluded that the best agreement between simulations and observations is achieved when NCEP/DOE II is used as forcing. Contento et al. (2012) studied the mean wave climate (1981-2000) and its seasonal variability for the southeastern coast of Australia. The wind forcing was
assessed against observations QuikSCAT and
NCEP/DOE Reanalysis II over the 1981-2000 period. The four global databases considered have got a relatively low spatial resolution. At the present, global databases of much finer resolution such as the NCEP/CFSR global model (National Centers for Environmental Prediction / Climate Forecast System
Reanalysis, http://rda.ucar.edu/pub/cfsr.html) are
available and can be used as forcing of the SWAN model. Spatial resolution NCEP/CFSR global model is 0.25° at the equator and extends to 0.5° beyond the tropics. Nowadays the NCEP/CFSR global model is being implemented as atmospheric forcing of the SWAN model in the RDP region. The corresponding results will be presented in a separate paper.
A
CKNOWLEDGMENTSThis paper is a contribution to the CONICET
PIP 112-200801-02599, PIDDEF 043/10/SHN,
PIDDEF 046/11/SHN and UBACyT 20020100100434 projects.
R
EFERENCESALLARD, R. A.; KAIHATU, J.; HSU, Y. L.; DYKES, J. D. The integrated ocean prediction system (IOPS): Special issue: Navy operational models: Ten years later.
Oceanography, v. 15, n. 1, p. 67-76, 2002.
BOOIJ, N.; RIS, R. C.; HOLTHUIJSEN, L. H. A third-generation wave model for coastal regions. 1: Model description and validation. J. Geophys. Res.-Oceans, v.104 , C4, p. 7649-7666, 1999.
CAMPETELLA, C.; SAULO, C. Verificación objetiva del modelo LAHM/CIMA sobre el centro-este de Argentina y Uruguay. Meteorológica, v. 28, n. 1-2, p. 83-96, 2003. CODIGNOTTO, J.; DRAGANI, W.; MARTIN, P.; MEDINA, R.; ALONSO, G. Wind waves climate change as an explanation of the erosion in Samborombón Bay, Argentine. Cont. Shelf Res., 2012, doi: 10.1016/j.csr.2012.03.013.
CONTENTO, G.; LUPIERI, G.; VENTURI, M.; CIUFFARDI, T. A medium-resolution wave hindcast study over the Central and Western Mediterranean Sea.
Ocean Dynam., v. 62, n. 1, 87-104, 2012.
DA ROCHA, R.; SUGAHARA, S.; DA SILVEIRA, R. Sea waves generated by extratropical cyclones in the South Atlantic Ocean: Hindcast and validation against Altimeter data. Weather Forecast., v. 19, p. 398-410, 2004.
DATAWELL. Manual for the waverider. LM Haarlem, The Netherlands: Laboratory for Instrumentation, 1997.
DEE, D. P. et al.- 35 co-authors. The ERA-Interim reanalysis: Configuration and performance of the data assimilation system. Quart. J. Roy. Meteorol. Soc., v. 137, p. 553-597, 2004, doi: 10.1002/qj.828.
DRAGANI, W.; ROMERO, S. Impact of a possible local wind change on the wave climate in the upper Río de la Plata. Int. J. Climatol., n. 24, p. 1149-1157, 2004. DRAGANI, W.; GARAVENTO, E.; SIMIONATO, C.;
NUÑEZ, M.; MARTÍN, P.; CAMPOS, M.I. Wave simulation in the outer Río de la Plata estuary: an evaluation of SWAN model. J. Waterway, Port,
Coastal Ocean Engineering, v. 134, n. 5, p. 299-305,
2008.
GEBCO. User’s guide to the centenary edition of the
GEBCO digital atlas and its data sets. JONES, M. T.
(Ed.). UK: Natural Environment Research Council, 2003.
HOLTHUIJSEN, L. H. et al. Swan cycle III version 40.31,
user’s manual. Delft: Delft Univ. of Technology,
Faculty of Civil Engineering and Geosciences, Environmental Fluid Mechanics Section, 2004. INNOCENTI, V.; CAETANO NETO, E. A case study of the
9 August 1988 South Atlantic storm: Numerical simulations of the wave activity. Weather Forecast., v. 11, n. 1, p. 78-88, 1996.
KALNAY, E. et al. 1996. The NCEP/NCAR 40-year reanalysis project. Bull. Am. Meteorol. Soc., v. 77, n. 3, p. 437 – 471, 1996.
KANAMITSU, M.; EBISUZAKI, W.; WOOLEN, J.; YANG, S., FIORINO, H.; POTTER, G. NCEP- DOE
amy –II Reanalysis (R-2). Boston, Mass.: American
Meteorological Society, November, 2002. p. 1631-1643.
LIN, W.; SANDFORD, L. P.; SUTTLES, S. E. Wave measured and modeling in Chesapeake Bay. Cont. Shelf
Res., v. 22, n. 18, p. 2673– 2683, 2002.
ONOGI, K.; TSUTSUI, J.; KOIDE, H.; SAKAMOTO, M.; KOBAYASHI, S.; HATSUSHIKA, H.; MATSUMOTO, T.; YAMAZAKI, H.; KAMAHORI, K.; TAKAHASHI, S.; KADOKURA, K.; WADA, K.; KATO, R.; OYAMA, T.; OSE, T.; MANNOJI, N.; TAIRA, R. The JRA-25 Reanalysis. J. Meteorol. Soc.
Japan, v. 85, p. 369-432, 2007.
PIANCA, C.; MAZZINI, P.; SIEGLE, E. 2010. Brazilian offshore wave climate based on NWW3 reanalysis.
Braz. J. Oceanogr., v. 58, n. 1. P. 53-70, 2010.
POSSIA, N.; VIDAL, L.; CAMPETELLA, C. Un temporal de viento en el Río de la Plata. Rev. Meteorolog., v. 36, p. 33-44, 2011.
RIS, R. C.; HOLTHUIJSEN, L. H.; BOOIJ, N. A third-generation wave model for coastal regions. 2: Verification. J. Geophys. Res., v. 104, C04, p. 7667-7681, 1999.
RUIZ ,J. J.; SAULO, C.; NOGUÉS-PAEGLE, J. 2010. WRF Model Sensitivity to Choice of Parameterization over South America: Validation against surface variables. Mon. Weather Rev., v. 138, p. 3342-3355, 2010 doi: 10.1175/2010MWR3358.
SHIKLOMANOV, I. A. A summary of the monograph
world water resources: A new appraisal and assessment
for the 21st Century, report, U. N. Environ. Programme, Nairobi, 1998.
SHN. Mar Argentino, de Río de la Plata al Cabo de Hornos, Nautical Chart, 50. 4th ed. Servicio de Hidrografia Naval, Armada Argentina, 1986.
SHN. Acceso al Río de la Plata, Nautical Chart H1, 5th ed., Servicio de Hidrografia Naval, Armada Argentina, 1992. SHN. Río de la Plata Exterior, Nautical Chart H113. 2nd ed.
Servicio de Hidrografia Naval, Armada Argentina, 1999a.
SHN, El Río de la Plata Medio y Superior, Nautical Chart H116. 4th ed. Servicio de Hidrografia Naval, Armada Argentina, 1999b.
SIMIONATO, C.; VERA, C.; SIEGISMUND, F. Surface wind variability on seasonal and interannual scales over Río de la Plata area. J. Coast. Res., v. 21, n. 4, 770–783, 2005.
SIMIONATO, C. G.; MECCIA, V. L.; DRAGANI, W. C.; NUÑEZ, M. N. On the use of the NCEP/NCAR surface winds for modeling barotropic circulation in the Río de la Plata Estuary. Estuar. Coast. Shelf Sci., v. 70, p. 195-206, 2006a.
SIMIONATO, C., MECCIA, V., DRAGANI, W., GUERRERO, R., NUÑEZ, M.. The Río de la Plata estuary response to wind variability in synoptic to intra-seasonal scales: barotropic response. J. Geophys. Res., v. 111, C09031, 2006b doi:10.1029/2005JC003297. SIMIONATO, C. G.; MECCIA, V. L.; GUERRERO, R. A.;
DRAGANI, W. C.; NUÑEZ, M. N. Río de la Plata estuary response to wind variability in synoptic to intraseasonal scales: 2. Currents’ vertical structure and its implications for the salt wedge structure. J. Geophys.
SIMMONDS, I.; KEAY, K. Mean southern hemisphere extratropical cyclone behavior in the 40-year NCEP/NCAR reanalysis. J. Climate, v. 13, n. 5, p. 873–885, 2000.
WHITHAM, G. B. Linear and nonlinear waves. New York: Wiley, 1974.
WU, J. Wind-stress coefficients over sea surface from breeze to hurricane. J. Geophys. Res., C 12, Oceans Atmos., v.87, p. 9704 – 9706, 1982.