INDEXES OF SPATIO-TEMPORAL CHANGE TO RECONSTRUCT THE HISTORICAL
EVOLUTION OF A COASTAL REGION – CASE STUDY:
SÃO SEBASTIÃO ISLAND – SP*
Lídia S. Bertolo1; Guilherme T. N. P. de Lima2 and Rozely F. dos Santos3
Universidade Estadual de Campinas (Caixa Postal 6021, 13.083-970 Campinas, SP, Brasil)
e-mail: 1[email protected]; 2[email protected]; 3[email protected]
A
B S T R A C TThe coastal regions of Brazil have lost most of their distinct characteristics due to an intense, diverse, and long history of land use. The current scenario is the result of successive changes which have taken place since the colonization of Brazil. These changes should be taken into account in environmental planning since the decisions about the future depend on the understanding of past changes. In this regard, the aim of this study was to identify and quantify the spatio-temporal changes in land use in a coastal region, using principles of landscape ecology and scenario construction. The case study was the São Sebastião Island, divided into 61 watersheds, offthe northern coast of São Paulo State (Brazil). The study involved the development and application of a methodology to interpret the historical dynamics of the island. The driving forces were identified and indexes of change were calculated to define the phases of occupation of the island. Five phases of occupation of the coastal landscape were mapped: preservation, conservation, regeneration, exploitation and urbanization. These phases represent a pattern of internal heterogeneity, sometimes positive (environmental conservation), and sometimes negative (environmental degradation).
R
E S U M OAs regiões costeiras brasileiras encontram-se altamente descaracterizadas devido ao intenso, diversificado e prolongado uso da terra ao longo de sua história. O cenário hoje observado é produto do acúmulo de interferências que vem ocorrendo desde a colonização. Os planejamentos ambientais devem considerar essa questão, uma vez que as decisões sobre o futuro dependem da compreensão dessas mudanças do passado. Neste caminho, o objetivo deste trabalho foi identificar, quantificar e indicar as variações espaços-temporais de uso da terra numa paisagem costeira a partir dos princípios da ecologia de paisagem e da modelagem para construção de cenários. O estudo de caso foi a Ilha de São Sebastião, Litoral Norte do Estado de São Paulo. Para tanto, foi desenvolvida e aplicada uma metodologia para a construção da trajetória histórica por meio da identificação de forças indutoras e aplicação de índices de mudanças que permitiram a definição de fases de ocupação da Ilha. Foram mapeadas nesse território cinco fases de ocupação histórica da paisagem costeira: preservação, conservação, regeneração, exploração e urbanização. Essas fases representam um padrão de heterogeneidade interna, ora como saldo positivo (conservação ambiental), ora como saldo negativo (degradação ambiental) dentro de 61 unidades de análise, definida pelas bacias hidrográficas presentes na Ilha.
Descriptors: Landscape ecology, Coastal planning, Scales of change, Spatio-temporal change. Descritores: Ecologia de paisagem, Planejamento costeiro, Escalas de mudança, Mudança espaço-temporal.
I
NTRODUCTIONThe structural and functional aspects of a landscape are products of spatial occupation and land use history, which may vary depending on the spatial and temporal scale of the analysis.
Coastal planning usually proposes actions that mitigate recent impacts and restrictive measures, in an attempt to find a balance between them and the __________
(*) Paper presented at the Brazilian Symposium of Oceanography, 4. São Paulo, IOUSP, 08-12 December, 2008.
natural dynamics of coastal environments. However, they often fail because their focus is exclusively on the current spatial arrangement of elements and trends of land use. Impacting actions, such as tourism, construction of ports, destruction of dunes, mangroves and salt marshes, modification of beaches, garbage dumping, and disposal of pollutants are often analyzed, interpreted, and mitigated within a single spatial-temporal scale that does not reflect the complexity of the coastal environment.
sensitivity to various impacts. This creates dynamic and heterogeneous changes in the landscape which, when analyzed on an appropriate spatio-temporal scale, reveal both harmful and beneficial effects on the environment. Whether the effects are harmful or beneficial depends on the historical context and the driving forces to which the landscape is being subjected (FRANÇA, 1951). This information can be used to divide the spatial changes into phases or moments over time, based on the driving forces active and the impacts caused at any given moment. A combined spatio-temporal analysis of a landscape is, therefore, always to be recommended, (see Weng, 2007; Gibson et al., 2000).
Remote sensing is one the most common techniques used to study spatial and temporal changes in landscapes, as it allows the detection and management of changes in land cover on various scales (STEFANOV et al., 2001; WILSON et al.,
2003). The changes are most commonly identified by superimposing satellite images, aerial photographs or maps of different dates (SANTOS, 2004). Statistical values can then be calculated for the differences found between dates, and changes can be reclassified in order to convert the data into indexes or models. Cross-classification is a widely used technique that compares the agreement between areas for a category of information, producing indexes such as the Kappa index (PEDREIRA & SANTOS, 2003). Qualitatively
different areas represent the changes from one category to another, which can be quantified cell by cell (SANTOS & SANTOS, 2008).
This study was designed to develop and apply a methodology to characterize the temporal dynamics of a coastal area, by identifying the driving forces and using indexes of change to define the phases of occupation.
São Sebastião Island was chosen as the study area because it represents a complete system, with highly concentrated interdependent factors and flows. Furthermore, it is possible to find pristine as well as highly disturbed habitats.
S
TUDYA
REAThe island of São Sebastião (Fig. 1) is located in the municipality of Ilhabela, on the northern coast of São Paulo State, 220 km from São Paulo City. The island is separated from the continent by the São Sebastião Channel, which has an average width of approximately 1.5 km. The island comprises an area of 348 km2 and has 26,881 inhabitants (SEADE, 2008). The urbanized area, where tourist facilities are concentrated, faces the continent. Tourism, civil construction, and fishing are the main economic activities (PREFEITURA DE ILHABELA, 2005).
The Ilhabela State Park (PEIb–Parque Estadual de Ilhabela) was created on 20 January 1977 by State Decree (SP) 9.414, and covers roughly 85% of São Sebastião Island. The land outside the park represents 15% of the island, of which only 2% can be occupied1.
M
ATERIAL ANDM
ETHODSTo construct the historical chart and to understand the dynamics of the land use of the island over the past five centuries (16th to 21st) bibliographical references in several libraries in São Paulo State and on websites were reviewed. Additionally, in order to obtain information regarding the historical context of Ilhabela on the São Paulo coast, other types of publication were consulted. These papers described the regional history and its
relationship to the development and growth of the São Paulo coast.
This survey was organized on Excel and, whenever possible, the information was arranged in sketches. Thus, a timeline of the most frequently repeated themes and publications in the literature was identified, correlated, and contextualized. This procedure identified the main paths of the history of the region. The most important events for the transformation of the island were also identified and represented on a timeline. The main factors that led to the changes in the spatial arrangement of the landscape were classified as driving forces.
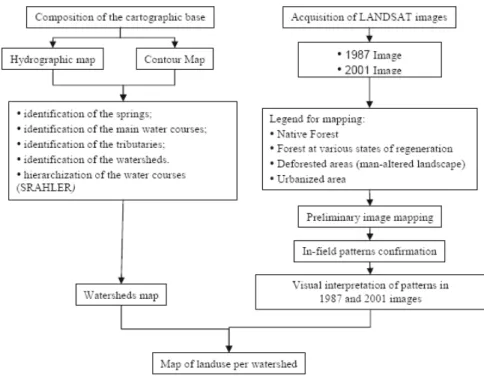
The following methodological procedure was developed (Fig. 2).
The technical specifications of the Landsat satellite images used are presented in Table 1.
Fig. 2. Methodological procedure. Table 1. Materials used.
Satellite Date Type of file Pixel resolution Bands
Landsat 5 TM 218/077 01/07/1987 Tif 30 m 3, 4 and 5
Landsat 7ETM+ 218/077 08/16/2001 GeoTif 30 m 3, 4 and 5
__________
The coordinates of the images were corrected for the UTM (Universal Transverse Mercator System) – Zone 23S and Datum SAD-69. The georeferencing of the Landsat 7 ETM+ and Landsat 5 TM images was done using the GIS ArcGis 9.2, based on 10 control points, distributed throughout the mapped surface. Then a first order polynomial transformation was applied, resulting in a 25 meter RMS error. According to PEC (Brazilian Cartographic Accuracy Standard), this is the maximum value for a scale of 1:50,000.
For the visual interpretation at the 1:50,000 scale, four categories of land use were used: well-preserved native forest2, degraded native forest3, deforested areas (human-altered landscape)4 and urbanized area.
The 1:30,000 scale was used to digitalize the polygons. A spatio-temporal pattern was obtained based on the combination of the four categories and the data (in hectares and in pixels) of the areas covered by each of the four categories for each year. The map of watersheds was overlaid with the maps of land use in order to determine the area of the polygons in each watershed.
These values were transferred to an Excel spreadsheet and a table was created with the areas of each typological category in (for?) each watershed for each year. The differences among the areas and the changes or variations in land use over time were identified. In order to decrease the variation in total area among watersheds, a correction factor fc was
created and applied to each typological class in each unit of analysis for both years (Equation 1).
t c
A A
f = (1)
Where:
A is the average area of all watersheds (549.66 ha); A iis the area of each watershed.
The results obtained in Equation 1 were used to compare the relative areas of the mapped categories of land use, regardless of the size of the watersheds. The island was then divided into sectors (north, south, east and west) according to the different types of land use found in the two years analyzed.
The equation developed by Fujihara et al.
(2005), which calculates the dominance index, was applied to examine the concentration of the areas of each category, in each watershed, for each year (1987 and 2001), (Equation 2).
__________
(2) A well-preserved native forest was defined as having coarse grains, integrity of the canopy, and dark orange color pattern. (3) Degradation was defined in terms of the presence of initial and intermediary successional stages of natural forest cover, fine grains, evidence of deforestation or clearings and a canopy that, when present, was fragmented, and with a light orange color and thin texture.
(4) Areas resulting from deforestation, small farms, pastures and areas abandoned after use of the land.
100 * , , = j j i j i A A
D (2)
Where:
D i, jis the dominance of category i in watersheds j; A i, jis the area of category i in watersheds j Aj is the area of watersheds j.
Based on these results, the spatialization within the watersheds and the overlay on the historical sketch (cf. França, 1954, modified), a map was produced on which the phases of occupation in each watershed were determined.
The cross tabulation (a data integration technique) was applied and an index was created to determine the balance of conservation (Equation 3). This index followed the criteria presented in Figure 3.
∑
+ = B mud C A AI (3)
Where:
Ic is the conservation index; Amud+ is the area of positive change;
ABis the area of the watershed.
Fig. 3. Criteria to determine the effect (positive or negative) of changes in category and the conservation and land use indexes.
Based on these indexes, moments within the
phases of occupation were also determined, subdividing them once again not only in accordance with the evolution of the typological dominance, but also based on the conservation index and land use of each watershed.
R
ESULTS ANDD
ISCUSSION Construction of the historical chart and timeline1850
XVI
XVII
XVIII
XIX
1850
XX
1987XXI
XX
XVI
XVIII
XIX
XX
1950
1987
XXI
XX
0% 50% 100% B e g in n in g o f c o ff e e c u lt iv a ti o n P e a k o f c o ff e e c u lt iv a ti o n O p e n in g o f R io -S a n to s H ig h w a y P E Ib c re a te d P e ri o d o f e v a lu a ti o n fo r th is s tu d y
Forested area on the island Degraded area on the island
Fig. 4. Timeline.
Successive cycles of development and stagnation were driven by three main forces, which varied in importance according to the organization and use of the island's landscape: i) coastal activities – trade activities at ports and the transportation of people, and fishing; ii) ruralization – responsible for the settlement of the population on the island at the beginning of the colonization, characterized by subsistence farming and the sugarcane and coffee plantations; and iii) urbanization and tourism – modern activities that have led to the reorganization of areas of the island in order to build an urban infrastructure.
The first driving force that altered the island’s landscape was ruralization, resulting in the deforestation of the coastal regions, for farming and settlements.
Between the 16th and 18th centuries, the main economic activity on the island consisted basically of sugar cane cultivation and the distillation of alcoholic beverages. Although ruralization was the predominant driving force throughout this period, coastal activities were constantly present. Together, these forces produced a mosaic of cultivated areas, abandoned areas, native forests, degraded forests, shacks and mills.
After the mid-19th century, the island reached its economic, social and demographic peak of development, but it also has have deforestation forthe plantation of coffee. While sugar cane plantations never went above 200 coffee crops reached an altitude of up to 500 meters. However, as in the other coffee producing regions on the northern coast of São Paulo State, its decline was as rapid as its rise, with its peak occurring on the island between 1870 and 1880. The decline was a result of the construction of the railways
connecting São Paulo to the port of Santos and to the Rio de Janeiro, and also of the abolition of slavery. Despite the economic decline followed by a large-scale exodus, the peak of the coffee cycle was important to consolidate the changes in the landscape of the island. As a result, the native forest receded to an altitude of 500 meters, and development concentrated in the region facing the channel, more specifically in the few kilometers between the Perequê plain and the city center.
Between the late 19th and early 20th centuries, the subsistence economy of the small properties that remained on the island was reflected in the coastal activities, through the distribution of the production of sugarcane spirits to other cities on the São Paulo coast. After the decline in the production of sugar and the consequent economic stagnation that hit the entire region of the northern coast of São Paulo, a recovery of the native forest was observed on the island, with the recolonizing of degraded areas, especially at higher altitudes, where sugar cane could not be planted. However, this was a secondary succession forest that regenerated from the higher to the lower altitudes. Furthermore, environmental concerns which emerged in the 70s stimulated the creation of the Ilhabela State Park- Parque Estadual de Ilhabela (1977), which accelerated the regeneration
of the native forest at altitudes of 200 meters and above.
regeneration, not because of a slower pace or capacity of recovery, but rather due to increased urbanization. Currently, fragments of native and recovered secondary forests are protected above the 200 meter contour, differently from the isolated fragments below this altitude, which serve as corridors for the local fauna.
Patterns and Indexes of Landscape Change Over Time
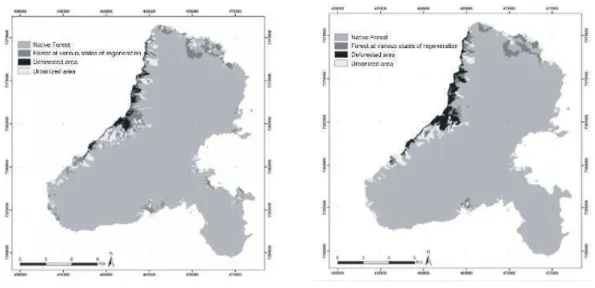
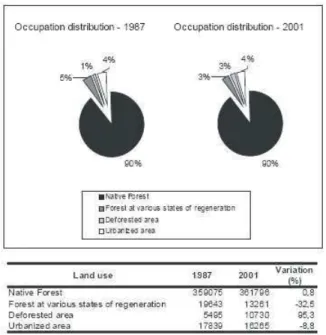
The driving forces on São Sebastião Island have created a series of spatial configurations that once overlaid resulted in a complex of fragments and consolidated impacts. As a result of this intense use, a mosaic formed by fragments of native forest, forests at various stages of regeneration, deforested areas (man-altered landscape), urbanized areas and areas undergoing urbanization is already present in the 1987 image. This was observed in the examination of sequential images. The visual interpretation of these images produced maps of land use (Fig. 5). The areas (in pixels) of the categories for each date (1987 and 2001) and the corresponding percentages of change as between the two years were determined.
Supporting the historical premise discussed above, Figures 5 and 6 show that over 90% of the study area is covered by well-preserved native forest. The vast majority of the other categories are located below 200 meters altitude. Also, in the period
investigated, from 1987 to 2001, the island presented a pattern of regeneration by which the well-preserved native forest increased by 0.8%, while man-altered areas decreased by 8.8%. The degraded forest decreased by 32.5%. This might be a result either of the regeneration of native forest (positive impact) or of the loss of area to the man-modified and urbanized areas (negative impact). Meanwhile, the urban area increased by 95.3%.
The changes in the landscape indicated a need to examine the dynamics of the transformations. A cross tabulation technique was, therefore, applied (Fig. 7), generating a flow diagram of the changes in land use.
Of the 0.7% increase in the cover of well-preserved native forest, 24.5% originated from degraded forest, 0.9% from urbanized areas, and 17.7% from the deforested area (man-altered areas). Thus, the largest area of recovery originated from degraded forest. However, well-preserved forest experienced losses: 0.6% was transformed into deforested areas (man-altered landscapes); 0.1% into urbanized area; and 0.7% into degraded forest. The increase in urbanized area did not, therefore, cause the loss of well-preserved native forest, but did lead to changes in deforested areas (7.6%) and areas of degraded forest (17.7%).
Fig. 6. Distribution of areas in percentages.
Natural
vegetation
Degraded
vegetation
Urbanized
areas
Deforested
areas
Fig. 7. Flow diagram of land use changes between 1987 and 2001.
Temporality and Changes per unit of Analysis: Defining the Phases of Occupation
The visual interpretation of the images of the island identified the areas where changes in land use have been concentrated, but it does not provide a detailed analysis of the axes or vectors inducing the transformation. As already described by Fujihara et al.
(2005), when an area is divided into smaller portions, comparisons among portions can be conducted and, therefore, the reconstruction of the structure of the
original landscape becomes more logical, and change can be examined, patch by patch, according to the land use patterns observed. For landscape ecology studies, the use of the watershed as a unit of analysis has been reported by several authors, such as Turner et al.
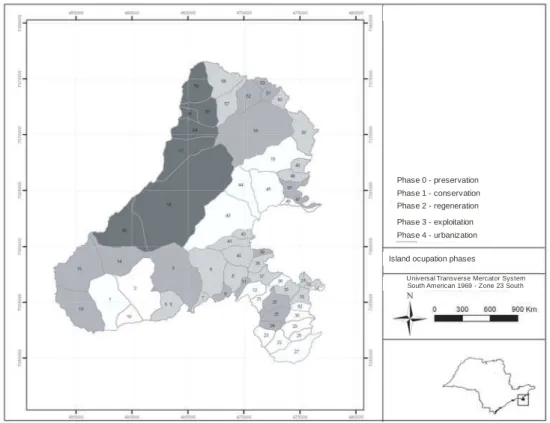
These results revealed watersheds which had not undergone any changes, watersheds with positive changes (regeneration of forest), and watersheds with negative changes (loss of areas of forest and increase in urban areas and/or deforested areas) (Fig. 8). The watersheds were then classified by comparing values of dominant land cover on the two dates and analyzing the historical chart. The different phases of the island’s historical evolution (Table 2) were identified. The phases represent the moment the watersheds currently are in, taking into account the positive and negative changes and the origins of their present spatial distribution.
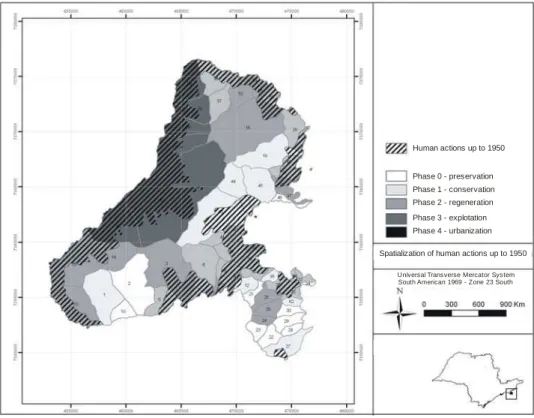
As shown in Table 2, the preservation and conservation phases were defined based on the mapping and the history described by França (1954) (Fig. 9). The distribution of the watersheds in their phases is shown in Figure 10.
Most of the island’s watersheds (32%) are in the regeneration phase (phase 2), while 11% are in the
urbanization phase (phase 4). The watersheds in phase 4 face the São Sebastião Channel and were the first axis of development on the island, between the Perequê plain and the town center.
It should be pointed out that 15% of the watersheds are in phase 0, the preservation phase, and have never experienced human-induced alterations.
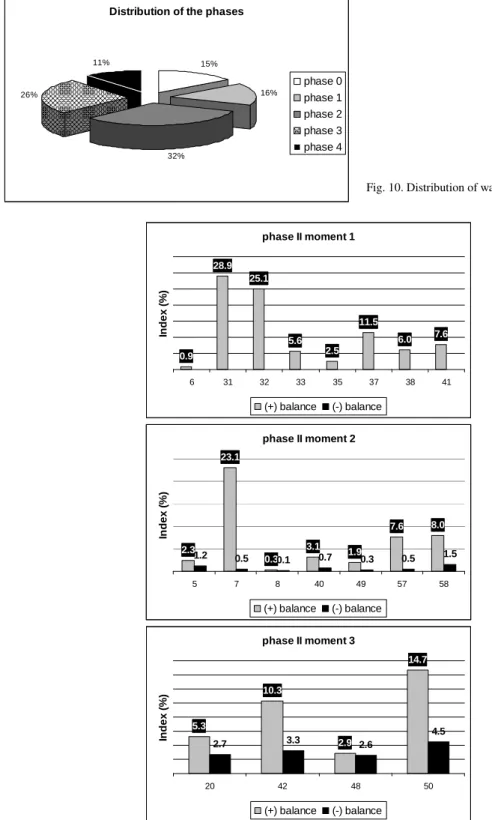
Definition of Moments Based on Indexes of Conservation and Land use
The application of the conservation index revealed different moments within each one of the phases (according to eq. 4). A phase represents the evolution of the dominant land cover of each watershed, while the moment indicates the state in which the phase is, determined by a positive or negative balance in terms of conservation and use. Percentage rates of change in territorial occupation observed, sometimes, therefore, indicate regeneration, sometimes exploitation.
Universal Transverse Mercator System South American 1969 - Zone 23 South
Phase 0 - preservation Phase 1 - conservation Phase 2 - regeneration Phase 3 - exploitation Phase 4 - urbanization
Island ocupation phases
Table 2. Phases of occupation of the island.
Phase Watersheds
0 – Conservation Watersheds that have not presented alterations to their native forests throughout their history. The landscape is homogeneous with that of the forest age. The watersheds in this phase were 100% dominated by native forest in both years.
2, 10, 21, 22, 23, 28, 29, 30 e 46
1 – Preservation
Watersheds that presented no alterations to their native forests during the period studied. They are 100% dominated by a mosaic of native forest of different ages in both years.
1, 12, 19, 27, 34, 36, 62, 43, 44, e 45
2 – Regeneration Watersheds that in the past suffered impacts due to anthropic pressures but are today undergoing regeneration. They are still dominated by native or degraded forest originating from deforested areas. Example: deforested area becoming native or degraded forest, and degraded forest becoming native forest.
5, 6, 7, 8, 20, 31, 32, 33, 35, 37, 38, 40, 41, 42, 48, 49, e 50, 57 e 58
3 – Exploitation Indicates the beginning of the land exploitation due to anthropic occupation, leading to a loss of native and degraded forest and a gain in deforested areas and also in native forest being replaced by degraded forest. This phase also presents urbanized areas in 2001 that did not exist in 1987. The watersheds in this phase must present greater dominance of deforested area in 2001 than in 1987.
3, 9, 11,13, 14, 15, 18, 24, 25, 26, 39, 47 e 61
4 – Urbanization Urbanized areas already existing in 1987 and that underwent an increase, indicating a spread of urbanization. Therefore, they have high change indexes of deforested areas and of forest areas becoming urbanized.
16, 17, 54, 55, 56, 59 e 60
Human actions up to 1950
Universal Transverse Mercator System South American 1969 - Zone 23 South
Phase 0 - preservation Phase 1 - conservation Phase 2 - regeneration Phase 3 - explotation Phase 4 - urbanization
Spatialization of human actions up to 1950
Distribution of the phases
15%
16%
32% 26%
11%
phase 0
phase 1 phase 2
phase 3 phase 4
phase II moment 1
0.9 28.9
25.1
5.6 2.5
11.5
6.0 7.6
6 31 32 33 35 37 38 41
In
d
e
x
(
%
)
(+) balance (-) balance
phase II moment 2
2.3 23.1
0.3 3.1
1.9
7.6 8.0
1.2 0.5 0.1 0.7 0.3 0.5 1.5
5 7 8 40 49 57 58
In
d
e
x
(
%
)
(+) balance (-) balance
phase II moment 3
5.3
10.3
2.9
14.7
2.7 3.3 2.6
4.5
20 42 48 50
In
d
e
x
(
%
)
(+) balance (-) balance
Fig. 11. (a-c) presents an example of phase 2 (regeneration), and its different moments according to the conservation index.
Moment 1 includes the watersheds that presented an improvement in environmental conservation in terms of landscape change, without any effects of degradation. These watersheds have characteristics more like those of watersheds in the conservation phase (phase 1) than the watersheds in moments 2 and 3. In moment 2, the watersheds present levels of land use (degradation) below 2%, thus the conservation index is higher than the land use index. In moment 3, the indexes of land use are above 2%, indicating an increase in deforested areas (man-altered landscape) or areas of degraded forest originated from well-preserved forests, greater than that observed in watersheds in moment 2, however without exceeding the conservation index. Thus these watersheds were still classified as in phase 2.
In summary, our findings suggest that the spatio-temporal changes observed in land use maps are better
interpreted when measurements are combined with historical information of the area and the various
phases and moments in the study area defined
C
ONCLUSIONThis study shows that the interpretation of spatio-temporal changes needs to consider the land use on different dates associated with historical timelines and specific indexes of change to better understand the landscape dynamics. A method based on mapping, cross tabulation, flow diagram, and the construction of dominance and conservation indexes is recommended. Then, sectors of distinct scenarios of evolution and change can be created, revealing how the driving forces have modified the landscape. The information on the driving forces can be used to define phases and moments, indicating distinct patterns of conservation and heterogeneity in the landscape and in each sector. Therefore, each sector with its specific evolution, changes and heterogeneity, can be considered a unit of management and planning, with specific guidelines. These latter can also be taken to point in new directions to other, future phases or moments.
The mapping of a forest mosaic allowed the visualization of undisturbed fragments and others in the process of recovery, with their respective ages and origins.
A
CKNOWLEDGEMENTSThe authors would like to thank CAPES (Coordination for the Improvement of Higher Education Personnel, Brazil) and CNPq/CTHIDRO (National Council for Scientific and Technological Development, Brazil) for their financial support.
R
EFERENCESFRANÇA, A. A Ilha de São Sebastião: estudo de geografia humana. São Paulo: USP, 1954.
FUJIHARA, M.; KIKUCHI, T. Changes in the landscape structure of the Nagara Watershed, central Japan.
Landscape and Urban Planning. 70: 271–281. 2005.
GIBSON, C. C.; OSTROM, E. & ANH, T. H. “The concept of scale and the human dimension of global change: a survey”. Ecological Economics. 32: 217-239. 2000.
PEDREIRA, B. C. C. G. ; SANTOS, R. F. Sensores remotos, escalas geográficas e análises espaciais orientados a planejamentos ambientais em áreas florestais. Revista do Instituto Florestal, São Paulo. 15 (2): 81-96. 2003. PREFEITURA MUNICIPAL DE ILHABELA. 2005. Plano
gestor de turismo – Estância Balneária Ilhabela. SANTOS, M. A.; SANTOS, R. F. 2008. Construção de
cenários por análises temporais e métricas espaciais.
Revista do Instituto Florestal.
SANTOS, R. F. Planejamento ambiental – teoria e prática.
São Paulo: Oficina de Texto, 2004.
SEADE – FUNDAÇÃO SISTEMA ESTADUAL DE ANÁLISE DE DADOS. Relatório Estadual de Acompanhamento dos Objetivos de Desenvolvimento do Milênio – 2008. São Paulo: Imprensa Oficial do Estado de São Paulo. 2008.
STEFANOV, W. L., RAMSEY, M. S.; CHRISTENSEN, P. R. Monitoring urban land cover change: An expert system approach to land cover classification of semiarid to arid urban centers. Remote Sensing of Environment.
77: 173– 185. 2001.
TURNER, M. G.; GARDNER, R. H.; O’NEILL, R. V. 2001.
Landscape ecology in Theory and Practice: pattern and process. New York: Springer-Verlag. 401p. WENG, Y. C. Spatiotemporal changes of landscape pattern in
response to urbanization. Landscape and Urban Planning. 81: 341–353. 2007.
WILSON, J. S.; CLAY, M.; MARTIN, E.; STUCKEY, D.; VEDDER-RISCH, K. Evaluating environmental influences of zoning in urban ecosystems with remote sensing. Remote Sensing of Environment. 86: 303–
321. 2003.
WU, J.; HOBBS, R. J. Key topics in Landscape Ecology. Cambridge University Press. United Kingdom. 2007.