Ar
ti
cle
0103 - 5053 $6.00+0.00
*e-mail: [email protected]
Electrochemical Behavior of 1-Ferrocenyl-3-phenyl-2-propen-1-one on Glassy
Carbon Electrode and Evaluation of its Interaction Parameters with DNA
Afzal Shah, Rumana Qureshi, Asad M. Khan,∗ Rasheed A Khera and Farzana L. Ansari
Department of Chemistry, Quaid-i-Azam University, 45320, Islamabad, Paksitan
O comportamento eletroquímico do 1-ferrocenil-3-fenil-2-propen-1-ona (ferrocenilona), e sua interação com DNA, foi estudado usando eletrodo de carbono vítreo em técnica de voltametria cíclica (VC). Os resultados da VC foram conirmados por espectrometria UV-Visível, em condições similares. O pico potencial positivo deslocado na VC e o deslocamento batocrômico no espectro UV-Vis sugerem um modo de ligação intercalativo. A constante de ligação (K = 1,39 ± 0,02 × 10⁴ mol-1 L) e o tamanho de ligação (0.53 bp) foram obtidos de dados voltamétricos levando
a uma energia livre padrão de Gibbs ((∆Go= −RT lnK) de −23,64 kJ mol-1 indicando assim a
espontaniedade da interação. Os valores de constante de ligação obtidos com medidas UV-Vis e VC, 1,26 ± 0.01 × 10⁴ and 1,39 ± 0.02 × 10⁴ mol-1 L respectivamente, mostraram uma boa concordância.
The electrochemical behavior of1-ferrocenyl-3-phenyl-2-propen-1-one (ferrocenylone) and its interaction with DNA was studied by a glassy carbon electrode using cyclic voltammetry (CV) technique. The results from CV were supported by UV-Visible spectroscopy performed under the similar conditions. The positive peak potential shift in CV and the bathochromic shift in the UV-Vis absorption spectra suggested an intercalative mode of binding. The binding constant (K = 1.39 ± 0.02 × 10⁴ mol-1 L) and the binding site size (0.53 bp) were obtained from voltammetric
data which leads to a standard Gibbs free energy change (∆Go= −RT lnK) of −23.64 kJ mol-1 and
hence indicated the spontaneity of the binding interaction. The values of binding constants obtained from UV-Vis absorption and CV measurements, 1.26 ± 0.01 × 10⁴ and 1.39 ± 0.02 × 10⁴ mol-1 L
respectively, were in close agreement.
Keywords: cyclic voltammetry, UV-Vis, DNA, chalcone, binding constant
Introduction
The binding of small molecules to DNA has drawn the attention of most scientists due to their importance in the understanding of unresolved drug-DNA interaction mechanism and the consequent design of the new eficient DNA targeted drugs with robust therapeutic proiles.1 Such molecules interact non-covalently with DNA, primarily by three modes: the electrostatic interactions with the anionic phosphate of DNA backbone, interactions with the both grooves (major and minor) and the intercalation between the stacked base pairs of DNA bases.2 These interactions have been shown to disrupt the replication and/or transcription machinery of DNA, resulting in cell apoptosis.3 In this regard, chalcones have been the subject of intensive investigations due to their strong intercalative interaction with DNA.4,5 Chalcones are lavonoids that
lack the C ring. The presence of a 4 −OH group and an α, β-unsaturated double bond are essential features for the cytotoxic activity of this class of compound.
The major cytotoxic and mutagenic effects of chalcones are induced by their direct interactions with DNA. The mechanism of cytotoxicity is believed to occur as a consequence of DNA damage. Since the Lerman concept of intercalation into DNA, it is now irmly believed that many anticancer drugs causing DNA damage exert their pharmacological and therapeutic activities by intercalation into DNA.6
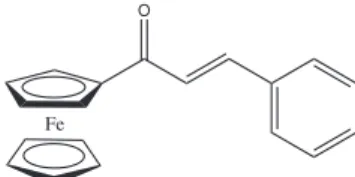
With these facts in mind and in continuation of our interest in chalcones due to their greater binding afinity with DNA,7 we synthesized 1-ferrocenyl-3-phenyl-2-propen-1-one (Scheme 1) and evaluated its binding parameters with DNA with the objective of searching out an effective new anticancer drug.
Experimental
Chemical reagents
1-ferrocenyl-3-phenyl-2-propen-1-one (ferrocenylone) was synthesized by the previously reported method.8 DNA was extracted from chicken blood by Falcon method.9 The ratio of UV absorbance at 260 and 280 nm A260/A280, of 1.85 indicated protein free DNA. The concentration of the stock solution of DNA (2.5 mmol L-1 in nucleotide phosphate, NP) was determined by monitoring the absorbance at 260 nm using the molar extinction coeficient (ε) of 6,600 mol-1 L cm-1. Tetrabutylammonium perchlorate (TBAP) purchased from Fluka (99% purity) was further puriied by recrystallization, using methanol as the solvent. DMSO with 99.5% purity was obtained from Riedal-de-Haën.
Apparatus
Cyclic voltammetric experiments were performed by PGSTAT 302 with Autolab GPES version 4.9 Eco Chemie, Utrecht, the Netherlands. Measurements were carried out in a conventional three electrode cell with saturated calomel electrode (SCE) from Fisher scientiic company (cat No.13-639-51) as a reference electrode, a thin Pt wire of thickness 0.5 mm with an exposed end of 10 mm as the counter electrode and a bare glassy carbon electrode (GCE) with a geometric area of 0.071 cm2 as the working electrode. Prior to experiments, the GCE was polished with 0.25 µm diamond paste on a nylon bufing pad. For electrochemical measurements the test solution was kept in an electrochemical cell (model K64 PARC) connected to the circulating thermostat LAUDA model K-4R. Argon gas was used for lushing out oxygen before every electrochemical assay. Absorption spectra were measured on a UV-Vis Spectrometer; Shimadzu 1601. Table Top Centrifuge, Model PLC-05 (Taiwan) was used for the extraction of DNA.
Results and Discussion
Voltammetric study of ferrocenylone -DNA interaction
The cyclic voltammetric behavior of 0.5 mmol L-1 1-ferrocenyl-3-phenyl-2-propen-1-one in the absence and presence of 10-80 × 10-6 mol L-1 DNA at bare GCE is shown in Figure 1. The voltammogram of the free ferrocenylone (Figure 1a) exhibited a single well deined cathodic peak at −1.372 V versus SCE with Ipc = 18.8 µA in 10% aqueous ethanol at 25 oC. No anodic peak was found in the reverse scan.
The electrochemical signal at −1.372 V with |Ep−Ep/2| = 60 mV relects 1e− reduction of Fc––OC+–CH=CH–C
6H5 to Fc––OC•–CH=CH–C
6H5 state which may result in the formation of non-electroactive dimmer as shown in Scheme 2.
The addition of 10-80 × 10-6 mol L-1 DNA, with concentration intervals of 10 × 10-6 mol L-1 to the same concentration of the drug (Figure 1 b-i), shows a 51.48% overall decrease in peak current and 62 mV positive shift in peak potential.
The substantial diminution in peak current can be attributed to the decrease in free drug concentration due Scheme 1. Molecular structure of ferrocenylone chemically named as
1-ferrocenyl-3-phenyl-2-propen-1-one. Fe
O
Scheme 2. 1e− reduction of ferrocenylone followed by rearrangement
and dimmer formation.
Fc O
+ 1e Fc
O
Fc O Fc
O
Fc
O
to the formation of slowly diffusing, heavy molecular weight ferrocenylone-DNA adduct. The obvious positive peak potential shift could be attributed to the intercalation of the planar part of ferrocenylone into the stacked base pairs domain of DNA.2,10 The extensive aromatization of the phenyl and α,β-unsaturated ketonic part (−CO-C=C-C6H5) of the compound facilitates intercalation. The absence of electrostatic interaction of the positively charged carbon of ferrocenylone with the anionic phosphate of DNA can be attributed to the presence of nucleophylic cyclopentadienyl ring, electron rich oxygen and unsaturated carbon in the close vicinity of carbonyl carbon, which causes to lower its electrophilicity and shield it from the attack of nucleophilic oxygen of DNA. With the continuous addition of DNA, the peak potential gradually shifts to less negative values, indicating easy reduction. This behavior can be further explained by the change in the components of the system (presence of free and DNA bounded with drug in the system) due to which the alteration in diffusion coeficient and reduction potential are expected to take place.
The gradual decay in peak current of ferrocenylone by increasing of DNA concentration, ranging from 10 to 80 × 10-6 mol L-1, can be used to quantify the binding constant by the application of the following equation:11
log (1/[DNA]) = log K + log (IH-G/(IG-IH-G)) (1)
where, K is the binding constant, IG and IH-G are the peak currents of the free guest (G) and the complex (H-G), respectively.
The binding constant with a value of 1.39 ± 0.02 × 10⁴ mol-1 L was obtained from the intercept of log (1/[DNA])
versus log (IH-G/(IG-IH-G)) plot (Figure 2).
Its strong binding afinity for DNA as attested by the greater binding constant than those observed for similar DNA-intercalating complexes, [CrCl2(dicnq)2]+ and [Ru((dicnq)3]+2, 1.20 × 10³ and 9.70 × 10³ mol-1 L,
respectively,12-14 justiies its candidature as an effective anti-cancer drug.
For the determination of binding site size the following equation was used:15
C
b/Cf= K ([free base pairs]/s) (2)
where s is the binding site size in terms of base pairs. Measuring the concentration of DNA in terms of [NP], the concentration of base pairs can be expressed as [DNA]/2. So equation 2 can be re-written as:
Cb/Cf = K ([DNA]/2s) (3)
Cf and Cbdenote the concentrations of free and DNA-bound species respectively.
The ratio of the bound and free drug was determined by the equation given below:16
C
b/Cf = (I − IDNA)/IDNA (4)
Where IDNAand I represent the peak currents of the drug with and without DNA.
Using the value of K = 1.39 × 10⁴ mol-1 L as calculated according to equation 2, the binding site size of 0.53 bp was obtained from the plot of Cb/Cfvs. [DNA] (Figure 3).
The binding site number implies only a binding site per two base pairs, giving evidence for an intercalation of ferrocenylone into DNA according to the neighbor-exclusion model, since groove binding and electrostatic binding usually results in signiicantly higher binding site number.4
To judge the nature of the electrochemical process (diffusion controlled or adsorption controlled), peak current, I, was plotted vs.ν1/2 (Figure 4) in the presence and absence of DNA using Randles-Sevcik equation: 17
Ipc(A) = −2.99 × 10⁵n (αn)1/2AC o*DO
1/2ν1/2 (5)
Figure 2. Plot of log (IH-G/(IG-IH-G)) vs. log (1 / [DNA]) used to calculate the binding constants of ferrocenylone-DNA complex.
Where I is the peak current (A), A is the surface area of the electrode (cm2), C
o* is the bulk concentration (mol mL -1)
of the electroactive species, α is the cathodic charge transfer coeficient, D is the diffusion coeficient (cm2 s-1) and n the number of electrons in the rate-determining step and ν is the scan rate (V s-1).
The linearity of the plots (Figure 4) at lower scan rates indicates that the electrochemical process is controlled by diffusionstep.18 The sudden rise in the slopes of the plots at high scan rates relects an adsorption controlled process. The diffusion coefficients of the free and DNA bound ferrocenylone were determined from the slopes of Randles-Sevcik plots at lower scan rates (20-200 mV s-1). The lower diffusion coeficient of the DNA bound species (Db=1.16 × 105 cm2 s-1) when compared to the free ferrocenylone (Df=1.90 × 105 cm2 s-1) suggests intercalation19,20 of the planar part of the molecule into the stacked base pairs of DNA. It results formation of a poor electroactive supramolecular ferrocenylone-DNA adduct with the consequential decrease of the peak currents in cyclic voltammograms as shown in Figure 1.
Although the antineoplastic activity of ferrocenyl group is known,21 it was ignored due to lower binding afinity to
DNA and absence of its voltammetric signature in the cyclic voltammograms shown in Figure 1.
UV absorption spectra
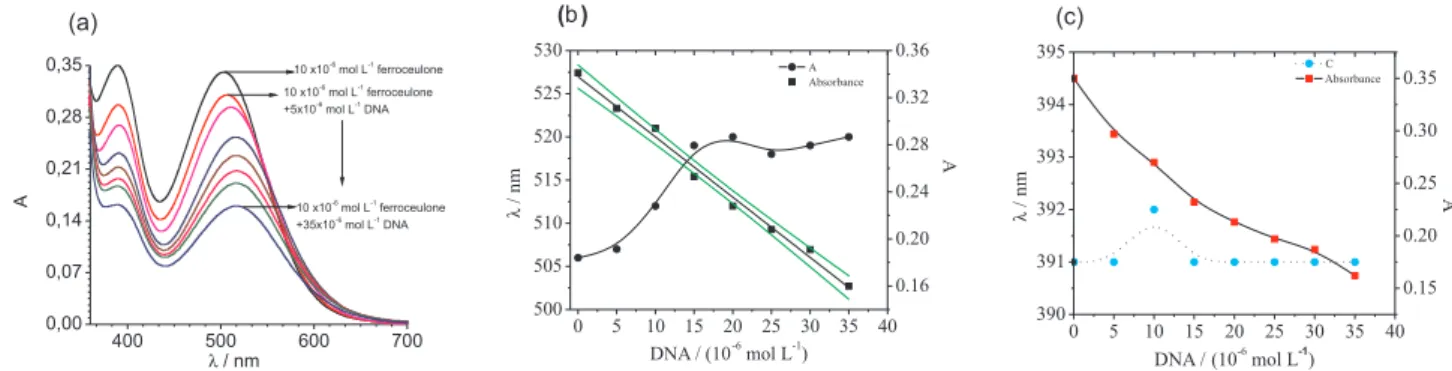
The interaction of ferrocenylone with DNA was monitored by the absorption titration method, in which the ixed concentration (10 × 10-6 mol L-1) of the drug was treated with different concentration of DNA ranging from 5-35 × 10-6 mol L-1. Figure 5 a shows the UV-Vis behavior of ferrocenylone in the presence and absence of DNA.
The summary of the UV-Vis behavior of ferrocenylone due to the addition of DNA can be viewed in Figure 5b, which shows that the absorbance of ferrocenylone at 506 nm decreases with the gradual increase of DNA concentration following a linear trend which is illustrated by the linear it of the data. At the same time, the maximum wavelength furnished by ferrocenylone increases initially and then it become almost constant as shown by the loose curve in Figure 5b. This implies that the addition of DNA causes the absorption peak maxima at 506 nm to undergo a 53.39% hypochromic and 16 nm bathochromic shifts (Figure 5 a and b), while only hypochromism was observed for the peak at 395 nm (Figure 5c). These peculiar spectral characteristics are expected due to the overlap of the electronic states of the aromatic chromophore of the ferrocenylone with the electronic states of the DNA bases.7 The aromatic n-π* and π-π* states of the planar group (−CO-C=C-C6H5) attached to the cyclopentadienyl ring of ferrocene seem to interact strongly with the electronic states of the DNA bases causing red shift in the absorption, followed by an extensive hypochromic shift. The mode of interaction can be inferred from the shift in λmax. A red shift (spectral shift to lower energy) in λmax indicates intercalation and blue shift (spectral shift to higher energy) represents electrostatic mode of interaction. Based of this condition, the peak at 506 nm, associated with substantial red shift, can be attributed to the intercalation of the planar part of Figure 4. Plots of I vs. ν1/2, for the determination of diffusion coeficient
of the free drug (●) and DNA bound drug (■). Scan rates 0.02; 0.05; 0.1; 0.2; 0.3; 0.4; 0.5 V s-1.
ferrocenylone into the double stranded DNA. The change in absorbance values of the same peak, by increasing DNA concentration, was exploited for the evaluation of intrinsic binding constant by the following equation:22,23
(6)
Where K is the binding constant, A0 and A are absorbances of the free drug and the apparent one, εG and εH-G are their absorption coeficients respectively.
The slope of the plot (Figure 6) between A0/(A-A0) vs. 1/[DNA], yielded the binding constant, K = 1.26 ± 0.01 × 10⁴ L mol-1, which is in good agreement with the value of K obtained from CV. The binding constants obtained are comparable to the values evaluated for various intercalating complexes of FeIIINiII and some porphyrin ligands.24,25 Still the simplicity of structure of this ferrocenylone compound is fairly helpful in understanding the mechanism behind the actual process of intercalation.
Conclusions
The interaction of ferrocenylone with DNA was estimated by CV and UV-Vis spectroscopy, based upon the difference in the electrochemical and absorption behavior of the drug in the absence and presence of DNA, including the shifts in peak potential, decay in peak current, decrease in absorption intensity and shift of absorption maxima to longer wavelength, due to the insertion of the drug in to the stacked base pairs of DNA. Interaction parameters like binding constant, binding site size, binding free energy and binding mode were determined. The strong afinity of this drug to DNA as is evident from its high binding constant, offers an important addition to the traditional cancer treatment. This study would help in the design of better, sequence-speciic, more potent anti-cancer drugs with fewer or no side effects, for application in chemotherapy.
References
1. Langer, R.; Science 2001, 293, 58. 2. Aslanoglu, M.; Anal. Sci. 2006, 22, 439. 3. Palecek, E.; Fojta, M.; Anal. Chem. 2001, 73.
4. Xu, Z.; Bai, G.; Dong, C.; Bioorg. Med. Chem. 2005, 13, 5694. 5. Meric, B.; Kerman, K.; Ozkan, D.; Kara, P.; Erdem, A.;
Kucukoglu, O.; Erciyas, E.; Ozsoz, M.; J. Pharm. Biomed. Anal. 2002, 30, 1339.
6. Das, S.; Kumar, G. S.; J. Mol. Struct. 2008, 872, 56.
7. Shah, A.; Khan, A. M.; Qureshi, R.; Ansari, F. L.; Nazar, M. F.; Shah, S. S.; Int. J. Mol. Sci. 2008, 1424.
8. Wu, X.; Tiekink, E. R. T.; Kostetski, I.; Kocherginsky, N.; Tan, A. L. C.; Khoo, S.B.; Wilairat, P.; Go, M. L.; Eur. J. Pharm. Sci. 2006, 27, 175.
9. Sambrook, J.; Fritsch, E. F.; Maniatis, T.; Molecular Cloning: A Laboratory Manual, Cold Spring Harbor: New York, 1989. 10. Long, E. C.; Barton, J. K.; Acc. Chem. Res. 1990, 23, 271. 11. Feng, Q.; Li, N. Q.; Jiang, Y.Y.; Anal. Chim. Acta 1997, 344,
97.
12. Rusanova, J.; Decurtins, S.; Rusanov, E.; Stoeckli-Evans, H.; Delahaye, S.; Hauser, A.; J. Chem. Soc., Dalton Trans. 2002, 4318.
13. Ambroise, A.; Maiya, B.G.; Inorg. Chem. 2000, 39, 4264. 14. Li, Q.; Yang, P.; Wang, H.; Maolin, G.; J. Inorg. Biochem. 1996,
64, 181.
15. Carter, M. T.; Rodriguez, M.; Bard, A. J.; J. Am. Chem. Soc. 1989, 111, 8901.
16. Aslanoglu, M.; Isaac, C. J.; Houlton, A.; Horrocks, B. R.; Analyst 2000, 125, 1791.
17. Randles, J. E. B.; Trans. Faraday Soc. 1948, 44, 327. 18. Wang, S.; Peng, T.; Yang, C. F.; Biophys. Chem. 2003, 104, 239. 19. Chanfreau, S.; Cognet, P.; Camy, S.; Condoret, J. S.;
J. Electroanal. Chem. 2007, 604, 33.
20. Shehatta, I. S.; Ibrahim, M. S.; Can. J. Chem. 2001, 79, 1431. 21. Top, S.; Vessieres, A.; Leclercq, G.; Quivy, J.; Tang, J.; Vaissermann, J.; Huche, M.; Jaouen, G.; Chem. Euro. J. 2003, 9, 5223.
22. Ibrahim, M. S.; Shehatta, I. S.; Al-Nayeli, A. A.; J. Pharm. Biomed. Anal. 2002, 28, 217.
23. Nie, M. Y.; Wang, Y.; Li, H. L.; Pol. J. Chem. 1997, 71, 816. 24. Bejune, S. A.; Alexander, H. S.; McMillin, D. R.; Inorg. Chem.
2003, 42, 8465
25. Batista, S. C.; Neves A.; Bortoluzzi, A. J.; Vencato, I.; Peralta, R. A.; Szpoganicz, B.; Aires, V. V. E.; Terenzi, H; Severino, P. C.; Inorg. Chem. Comm. 2003, 6, 1161
Received: January 8, 2009
Web Release Date: December 3, 2009 Figure 6. Plot of Ao/(A-Ao) vs.1/[DNA] for the determination of binding
![Figure 2. Plot of log (I H-G /(I G -I H-G )) vs. log (1 / [DNA]) used to calculate the binding constants of ferrocenylone-DNA complex.](https://thumb-eu.123doks.com/thumbv2/123dok_br/18994521.461773/3.892.502.800.634.833/figure-plot-dna-calculate-binding-constants-ferrocenylone-complex.webp)