The Spectrophotometric Determination of the pKa of Pyrrolidinedithiocarbamic and Piperidinedithiocarbamic Acids, Based on Diode Array Measurements
Éder T.G. Cavalheiroa* and Gilberto O. Chiericeb
a
Universidade Fed eral de São Carlos, Departamento de Química, C.P. 676,
13560-920 São Carlos - SP, Brazil; e-mail: [email protected]
b
Instituto de Química de S. Carlos, Universidade de São Paulo,
13560-970 São Carlos - SP, Brazil; e-mail: [email protected]
Re ceived: Feb ru ary 16, 1996; Sep tem ber 16, 1996
Neste trabalho apresenta-se um método espectrofotométrico, baseado em equipamentos com arranjo lin ear de diodos (“di ode ar ray”), para determinação de pKa dos
ácidos ditiocarbâmicos derivados da pirrolidina (HPyr-I) e da piperidina (HPip-II). A elevada velocidade de leitura do equipamento, torna possível minimizar o problema da decomposição dos ditiocarbamatos, em meio ácido. Os valores de pKa obtidos foram
3.10(I) e 3.51(II), em I = 0.50 mol L-1 (NaClO4) à 25.0 °C, sendo consistentes com os
mecanismos de decomposição ácida. Apresenta-se também uma discussão baseada na forma dos espectros obtidos em meio ácido e básico e sua relação com a ordem dos valores de pKa, a qual é inversa em relação a valores determinados anteriormente.
A spec tro pho to met ric method, based on the use of a di ode ar ray spectrophotometer, is pro posed in or der to de ter mine the pKa of pyrrolidinedithiocarbamic (HPyr-I) and
piperidinodithiocarbamic (HPipII) ac ids. The high speed of data ac qui si tion of the equip ment made it pos si ble to min i mize the prob lem of acid de com po si tion. The val ues ob -tained were 3.10(I) and 3.51(II) in I = 0.50 mol L-1 (NaClO4) at 25.0 °C, and are con sis tent
with the acid de com po si tion mech a nism. A dis cus sion is pre sented based on the shape of the com pound spec tra in acidic and ba sic me dia and their re la tion to the or der of the pKa
val ues for I and II.
Key words: piperidinedithiocarbamic acid, pyrrolidinedithiocarbamic acid, pKa de -ter mi na tion
In tro duc tion
Dithiocarbamates (DTC) have been widely ap plied in sev eral in dus tries (e.g. rub ber), ag ri cul ture, med i cine, or ganic syn the sis, and in an a lyt i cal chem is try (es pe cially in -or ganic spe cies anal y sis)1-10. The low sta bil ity of the DTC in acidic me dia has been in di cated as the ma jor lim i ta tion to the use of these ver sa tile com pounds.
Zahradnick and Zuman11 first stud ied the de com po si -tion re ac -tion, and Chakrabarti et al.12-16 pro posed a deg ra -da tion mech a nism which may be re lated to the acidic form, rep re sented by an un sta ble in ter me di ate and gen er at ing an amine and car bon disulfide, ac cord ing to the re ac tion:
(1)
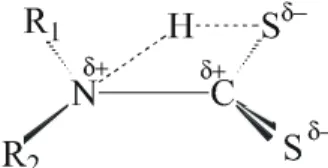
These au thors pro posed that the in sta bil ity of the in ter -me di ate, whose struc ture is pre sented in the Fig. 1, is due to the pos i tive charge den sity in the car bon and ni tro gen at oms of the carbamate bond (NC), which in duces the mol e -cule de com po si tion in acidic me dia.
Ar ti cle
Thus, the pKa value for the DTC is an im por tant fea ture
since it is re lated to the com pound sta bil ity and var ies with the aminic substituent.
The ki netic, polarographic, or math e mat i cal meth ods pro posed for the pKa mea sure ments12-16 are time con sum
-ing. Con ven tional potentiometric and spec tro pho to met ric meth ods are not ap pli ca ble be cause of the rapid de com po -si tion that oc curs in acidic me dia.
The pres ent work de scribes the ap pli ca tion of a rel a -tively eas ier spec tro pho to met ric method based on Volgel’s p r o p o s a l1 7, b u t e m p l o y i n g a d i o d e - a r r a y spectrophotometer, whose read ing speed per mits data ac -qui si tion in such a short time that it by-passes the prob lem of com pound de com po si tion. The method is ap plied to the pKa value de ter mi na tion of pyrrolidinedithiocarbamic
(HPyr) and piperidinedithiocarbamic (HPip) ac ids. The struc tural for mula of the ac ids are:
Ma te rials and Methods
All of the re agents used were of an a lyt i cal grade.
DTC syn the sis and char ac ter iza tion
The Pyr and Pip sodic salts were ob tained by the re ac -tion be tween the car bon disulfide and the re spec tive amine (pyrrolidine or piperidine), in the pres ence of so dium hy -drox ide18 in an eth a nol/wa ter 1:1 (v/v) re ac tion me dia. The white salt ob tained was washed with cold eth a nol and then recrystallized by dis solv ing in wa ter, fol lowed by the ad di tion of eth a nol. The so lu tion was frozen and the white nee -dle crys tals which formed were char ac ter ized by vi bra tional spec trom e try (lig ands), atomic ab sorp tion (so -dium), and thermogravimetric anal y sis.
Buffer so lu tions
The McIlvaine buffer so lu tions with ionic strength ad -justed to 0.50 mol L-1 (NaClO4) were pre pared ac cord ing to
Elving et al.19. The pH of these buff ers was mea sured with a glass elec trode cal i brated with con di tional buff ers.
These con di tional buff ers were so lu tions with an ionic strength of 0.50 mol L-1 (NaClO4), and hy dro gen ion con
-cen tra tions of 1.00 x 10⁻² and 1.00 x 10⁻⁴ mol L-1 (HClO4),
cor re spond ing to pH 2.00 and 4.00, respectivel
y
20.
Equip ment
A d i o d e - a r r a y H e w l e t t - P a c k a r d H P 8 4 5 1 A spectrophotometer and quartz cells 1.00 cm in length were used in the spec tro pho to met ric mea sure ments.
The lig ands were char ac ter ized in a Nicolet 5SXC FTIR spectrophotometer equipped with a TGS de tec tor in the 4.000-400 cm-1 range. The spec tra were ob tained from KBr pel lets.
The num ber of hydration wa ter mol e cules was de ter -mined in a DuPont TGA-951 thermogravimetric mod ule, cou pled with a DuPont 9900 ther mal an a lyzer sys tem.
The atomic ab sorp tion ex per i ments were per formed in an Intralab AA12/1475 spectrophotometer.
Pro ce dures
All of the spec tro pho to met ric mea sure ments were car -ried out at 25.0 0.1°C, us ing the buffer so lu tions pre vi -ously thermostated at this tem per a ture as blanks.
The stock NaDTC so lu tions (50.0 mL), at a 5.0 x 10⁻⁴ mol L-1 con cen tra tion, were used for the prep a ra tion of the work ing so lu tions, with con cen tra tions rang ing from 8.33 x 10⁻⁶ to 6.67 x 10⁻⁵ mol L-1 at pH 2.05 to 4.47. A 3.33 mol L-1 so lu tion of each DTC was used in the de ter mi -na tion of the max i mum wave length ab sorp tion of the acidic and ba sic forms, at pH 0.98 and 7.82, re spec tively. In or der to min i mize the de com po si tion of the com -pounds, the so lu tions were pre pared di rectly in the quartz cells. Thus 0.20 mL of the stock so lu tion of NaDTC was trans ferred with an au to matic pi pette and in tro duced into 2.80 mL of the pre vi ously thermostated buffer. The mean time spent in the pro ce dure and the read ing was about 5 s, since the equip ment reads the spec tral range in 0.1 s.
Re sults and Dis cus sion
The NaDTC char ac ter iza tion
In Ta ble 1 the prin ci pal bands found in the vi bra tional spec tros copy mea sure ments are pre sented, com pared with the lit er a ture val ues for the groups C=S, N-CS2, and C-N
for the com pounds NaPyr and NaPip.
The atomic ab sorp tion ex per i ments ev i denced the pres -ence of 10.80% Na in the NaPyr.2H20 (cal cu lated =
Fig ure 1. The acid de com po si tion in ter me di ate, ac cord ing to Joris et al.13.
Ta ble 1. The prin ci pal IR bands ob served, com pared with the lit er a
-ture val ues.
Com pound C=S N-CS2 C-N
NaPyr.2H2O 1005(1003a) 1110(1110a) 1470(1460a)
11.20%) and 9.94% (m/m) in the NaPip.2H20 (cal cu lated =
10.49%). The thermogravimetric re sults con firmed the pres ence of two hydration wa ter mol e cules for both com -pounds. This is con sis tent with the work of Kudela et al.21 and Siddiqi et al.22.
Mo lar ab sorp tivi ty (ε) de ter mi na tion
The mo lar ab sorp tivi ty was ob tained from an gu lar co -ef fi cients of the absorbance vs. con cen tra tion (mol L-1)
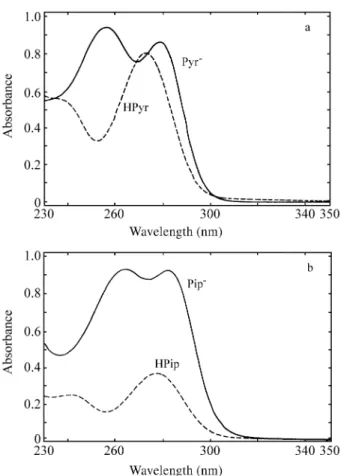
curves for the acidic and ba sic forms of each DTC, in the max i mum wave length (λmax) re gion. The spec tra of these
com pounds are pre sented in Fig. 2a (Pyr) and 2b (Pip), at dif fer ent pH val ues for the acidic and ba sic forms. Ac cord -ing to the lit er a ture23, the pres ence of a sin gle max i mum in acidic me dia is due to protonation, which re duces the res o -nance in the N-CS2 group.
In Fig. 3 the Lam bert-Beer curves for Pyr (3a) and Pip (3b) are pre sented at dif fer ent pH at λmax for the acidic and
ba sic forms of each com pound. Ta ble 2 pres ents the fi nal re sults.
The val ues showed good agree ment with those found by Shankaranarayana and Patel23, be ing on the or der of
104. The re sults in di cate that acidic forms have smaller
absorptivities than ba sic forms.
pKa cal cu la tions
Sub sti tu tion of theε val ues in the Eqs. 2 and 3 AA = εA,RSH(RSH) + εA,RS-(RS-) (2)
AB = εB,RSH(RSH) + εB,RS-(RS-) (3)
which con sider that the absorbance is due only to the pres -ence of the free and protonated spe cies at each wave length, made it pos si ble to cal cu late the con cen tra tion of acidic and ba sic forms in equi lib rium. In the above equa tions, AA is
the absorbance at wave length A, εA,RSH is the mo lar ab sorp
-tivi ty for the protonated form at wave length A, εA,RS- is the mo lar ab sorp tivi ty for the free form at wave length A,
Fig ure 2. The Pyr(2a) and Pip(2b) spec tra in acid (pH = 0.98) and ba
-sic (pH = 7.82) me dia.
Fig ure 3. The Lam bert-Beer law ver i fi ca tion, in the λmax of the acid and ba sic forms of each DTC (3a Pyr and 3b Pip). The an gu lar co -ef fi cients of these curves gave the εA,RSH, εB,RSH, εA,RS- , and
εB,RS- values.
Ta ble 2. Mo lar absorptivities, ε, de ter mined for each DTC to both acidic and ba sic forms.
Com pound pH λ /nm ε/L mol-1 cm-1 log ε
HPyr 0.89 272 1.19.104 4.1
Pyr- 7.82 256 1.45.104 4.2
HPip 0.89 276 5.26.103 3.7
and (RSH) and (RS-) are the ac tiv i ties of the protonated
and free forms, re spec tively.
Using the ra tio of these con cen tra tions it is pos si ble to cal cu late the pKa ac cord ing the Handerson-Hasselbach
equa tion:
pK= −
−
pH RS
RSH
log( )
( ) (4)
A sim ple com puter pro gram in the Quick Ba sic lan guage (©Microsoft Co.) was de vel oped to per form the cal -cu la tions, giv ing the re sults pre sented in Ta ble 3, in I = 0.50 mol L1 (ad justed with NaClO4) and at 25.0 °C. This pro
-gram uti lizes the con cen tra tions of acidic and ba sic forms given by Eqs. 5 and 6, de rived from Eqs. 2 and 3 sys tem:
( ) ( ) ( )
( ) (
, ,
, , ,
RSH = −
− −
− −
−
AA B RS AB A RS
A RSH B RS A RS
ε ε
ε ε ε εB RSH, )
(5)
(RS AB B RSH RSH
B RS
−
−
= −
) ( , ( ))
,
ε
ε (6)
The lit er a ture val ues and the con di tions un der which they were ob tained are pre sented in the Ta ble 4. This ta ble shows that the val ues are not in agree ment for HPip, pos si -bly due to com pound de com po si tion. Also, the or der pKPyr pKPip is in verted in re la tion to the pres ent re sults,
which are con sis tent with the pro posal of the acid de com -po si tion in ter me di ate, since ac cord ing to the pres ent pKa
re sults the Pyr is protonated at a pH more acid than the Pip, hav ing a lower pKa value.
It is widely known that Pyr is much more sta ble in acidic me dia than Pip3,8,9,10, and is fre quently ap plied in sev eral meth ods of anal y sis in acidic con di tions. The solvatation of acidic in ter me di ates12 is not suf fi cient to ex plain this dif fer ence, since the lig ands have sim i lar struc -tures. For in stance, τ(Pyr) = 85.6 min in pH = 3.60 and τ(Pip) =
3.78 min in pH = 4.8525. Other ki netic data are pre sented in Ta ble 5, which are in agree ment with the re sults from Vandebeek et al.14. Ac cord ing to these au thors, the ap par -Ta ble 3. pKa val ues de ter mined by the spec tro pho to met ric method,
us ing Eqs. 5 and 6.
pH Absorbance L/HL pKa
Pyr λ = 256 nm λ = 272 nm
2.05 0.7893 1.567 0.07574 3.17
2.49 0.8980 1.568 0.1922 3.21
2.66 1.086 1.633 0.3948 3.06
3.06 1.313 1.606 0.9422 3.08
3.61 1.672 1.607 3.593 3.05
4.47 1.872 1.588 30.16 2.99
mean 3.10 ± 0.07
Pip λ = 264 nm λ = 276 nm
2.05 0.5852 0.9247 0.03015 3.57
2.49 0.6674 0.9773 0.08700 3.55
2.66 0.5102 0.6920 0.1699 3.43
3.06 0.9604 1.191 0.3305 3.54
3.61 1.413 1.490 1.402 3.46
mean 3.51 ± 0.08
Con stants:
εPyr,256=1.45 εPip,264=1.45
εHPyr,256=0.537 εHPip,264=0.316
εPyr,272=1.21 εPip,276=1.39
εHPyr,272=1.19εHpip,276=0.526
Ta ble 4. Sum mary of pKa val ues from the lit er a ture and the pres ent
work.
pKa Con di tions Ref er ence
Pyr Pip I Temp.(°C)
2.95 - 0.01 25.0 11
3.30 3.21 0.01 25.0 14
3.27 3.18 0.05 25.0 15
3.30 3.21 0 25.0 24
3.10 3.51 0.50 25.0 this work Fig ure 4. Vari a tion in the spec tral shape at pH 3.06, 3.61, and 4.47 for
ent rate con stant (kap) and the half-life time (τ ap) var ies with
the pH up to a cer tain value, at which they be came con stant (klim and τlim, re spec tively).
A sec ond point in fa vor of the pres ent re sults is the spec -tral shape of the com pounds at dif fer ent pHs, pre sented in Figs. 4a and 4b for Pyr and Pip, re spec tively. From these curves it is pos si ble to note that for the Pyr case at pH 3.06, a sin gle peak ap pears at 247 nm (acidic form), and that two peaks are pres ent at pH 3.61 and 4.47 at 258 and 276 nm (ba sic form). Thus, a spec tral change cor re spond ing to an al ter ation in the pre dom i nance of the forms oc curred be -tween pH 3.06 and 3.61.
In the Pip case, this spec tral change ap pears clearly only at pH 4.47. At pH 3.06 there is only one peak at 280 nm (acid form), while at 3.61 there are two peaks, with out def i -ni tion, sug gest ing that the spec tral change oc curs near, but be fore pH 3.61.
Based on these com ments it is pos si ble to con clude that the pres ent val ues are more co her ent with the acid de com po si tion the ory and the spec tral change than the ear lier pro -posed val ues. This has been at trib uted to the use of the di ode ar ray spectrophotometer, with high read ing speed, tech nol ogy which was not avail able when pre vi ous re -search was de vel oped.
Ref er ences
1. Hursthouse, M.B.; Malik, M.A.; Motevalli, M.; O’Brien, P. Poly he dron 1992, 11, 45.
2. Sharma, A. K. Thermochim. Acta 1986, 104, 339. 3. Magee, R.J.; Hill, J.O. Rev. Anal. Chem. 1985, 8, 5. 4. <%-3>Bond, A.M.; Mar tin, R.L. Coord. Chem. Rev.
1984, 54, 23.
5. Sengupta, S.K.; Kumar, S. Thermochim. Acta 1984, 72, 349.
6. Hill, J.O.; Magee, R.J. Rev. Inorg. Chem. 1981, 3, 141.
7. Coucovanis, D. Progr. Inorg. Chem. 1979, 26, 301. 8. Coucovanis, D. Progr. Inorg. Chem. 1970, 11, 233. 9. Hulanick, A. Talanta 1967, 14, 1371.
10. Thorn, G.D.; Lud wig, R.A. In The Dithiocarbamates and Re lated Com pounds, Elsevier, Am ster dam, 1962. 11. Zahradnik, R.; Zuman, P. Col lect. Czech. Chem.
Commun. 1959, 24, 1132.
12. Aspila, K.I.; Chakrabarti, C.L.; Sastri, V.S. Anal. Chem.
1963, 45, 363.
13. Joris, S.J.; Aspila, K.I.; Chakrabarti, C.L. J. Phys. Chem.
1970, 74, 860.
14. Vandebeek, R.R.; Joris, S.J.; Aspila, K.I.; Chakrabarti, C.L. Can. J. Chem. 1970, 48, 2204.
15. Aspila, K.I.; Sastri, V.S.; Chakrabarti, C.L. Talanta
1969, 16, 1099.
16. Joris, S.J.; Aspila, K.I.; Chakrabarti, C.L. Anal. Chem.
1969, 41, 1441.
17. Bas set, J.; Denney, R.C.; Jeffrey, G.H.; Mendham, Vogel-Análise Inorgânica Quantitativa; 4th Ed.; Guanabara Dois, Rio de Ja neiro, 1981; p.565.
18. Malissa, H.; Schöffmann, S. Mikrochim. Acta 1955, I, 187.
19. Elving, P.J.; Morkovitz, J.M.; Rosenthal, I. Anal. Chem.
1956, 28, 1179.
20. Cavalheiro, E.T.G.; Plepis, A.M.G.; Chierice, G.O.; Neves, E.F.A. Poly he dron 1987, 9, 1717.
21. Kudela, S.; Garaj, J.; Hofbauerova, H.; Kettmann, V. Col lect. Czech. Chem. Commun. 1980, 45, 800. 22. Siddiqi, K.S.; Shah, M.A.; Zaidi, S.A.A. Bull. Soc. Chim.
(France) 1983, I, 49.
23. Shankaranarayana, M.L.; Patel, C.C. Acta Chem. Scand.
1965, 19, 1113.
24. Lakanen, E. Suom. kemistilehti 1970, 43B, 226. 25. Cavalheiro, E.T.G. The sis, Univ. de São Paulo, São
Carlos, 1995.
FAPESP helped in meet ing the pub li ca tion costs of this ar ti cle Ta ble 5. Ki netic de com po si tion pa ram e ters for Pyr and Pip, at dif fer ent pHs, and ionic strength ad justed to 0.50 mol L-1 (NaClO4).
pH kap/10-4 min-1 τ ap/min klim/10-2 min-1 τ lim/min
Pyr
3.60 81 85.570 3.1 30
4.59 9.2 753.40 2.7 27
5.80 0.65 10,664 3.0 23
mean: 2.9 ± 0.2 27 ±3
Pip
4.85 1832 3.78 4.2 0.17
5.50 475 14.6 4.7 0.15
6.40 42.5 163 3.8 0.21
7.94 1.73 4,001 4.8 0.14