Artigo
*e-mail: [email protected]
#Artigo em homenagem ao Prof. Otto R. Gottlieb (31/8/1920-19/6/2011)
AUTHENTICITY STUDY OF Phyllanthus SPECIES BY NMR AND FT-IR TECHNIQUES COUPLED WITH
CHEMOMETRIC METHODS#
Maiara S. Santos*, Edenir R. Pereira-Filho e Antonio G. Ferreira
Departamento de Química, Universidade Federal de São Carlos, CP 676, 13560-970 São Carlos – SP, Brasil Elisangela F. Boffo
Instituto de Química, Universidade Federal da Bahia, 40170-115 Salvador – BA, Brasil Glyn M. Figueira
Centro Pluridisciplinar de Pesquisas Químicas, Biológicas e Agrícolas, Universidade Estadual de Campinas, CP 6171, 13081-970 Campinas – SP, Brasil
Recebido em 25/5/12; aceito em 10/8/12; publicado na web em 26/10/12
The importance of medicinal plants and their use in industrial applications is increasing worldwide, especially in Brazil. Phyllanthus
species, popularly known as “quebra-pedras” in Brazil, are used in folk medicine for treating urinary infections and renal calculus. This paper reports an authenticity study, based on herbal drugs from Phyllanthus species, involving commercial and authentic samples using spectroscopic techniques: FT-IR, 1H HR-MAS NMR and 1H NMR in solution, combined with chemometric analysis. The spectroscopic techniques evaluated, coupled with chemometric methods, have great potential in the investigation of complex matrices. Furthermore, several metabolites were identified by the NMR techniques.
Keywords: Phyllanthus species;FT-IR and NMR techniques; chemometric methods.
INTRODUCTION
The importance of medicinal plants and their use for industrial purposes is increasing throughout the world, especially in Brazil. Such plants can be used as vegetal drugs, which are composed of medicinal plants or their parts, after the collection, stabilization and drying process, and later fully crushed or pulverized to be sold as herbal medicines.1,2
In Brazil, medicinal plants have been used since before its “dis-covery”, but the regulation process of these products started only a few decades ago. In June 2006, the Brazilian Policy on Medicinal Plants and Herbal Medicines was approved, whose general objective is “to assure the Brazilian population’s access to safe medicinal plants and herbal medicines along with their rational use, while promoting sustainable biodiversity in their use as well as the development of the production chain and national industry”.3 Moreover, in February
2009, the Brazilian Ministry of Health published the National List of Medicinal Plants. This list contains seventy-one species of medicinal plants which have the potential to generate useful products for the public health system.4
However, the lack of well-established laws up until these publica-tions enabled the use of vegetal drugs without any effective control. This uncontrolled use resulted in a range of problems, such as lack of information about possible toxic effects caused by the plants; the combination of various plant species; the effect of seasonality and rationality and contamination from unknown species. These problems have contributed to poor quality of the products, representing an obstacle for the use of these plants in phytotherapy.5
The Phyllanthus niruri and P. tenellus species, popularly known as “quebra-pedras”, are commonly used in folk medicine for treating urinary infections and renal calculus (recognized by Brazilian phar-macopeia).6,7 Other Phyllanthus species are also known, such as P.
urinaria, P. amarus and P. caroliniensis, and due to the morphological
similarity of these plants, they are often consumed without any criteria. Furthermore, when the plant material is commercialized in the form of finely fragmented parts, it is difficult to determine their correct identification.
The Phyllanthus genus belongs to the Euphorbiaceae family, which in Brazil is represented by 72 genera and about 1100 species with different habits and habitats, widespread throughout all vegeta-tion types.8 The plants of the Phyllanthus genus have a wide variety
of chemical constituents, such as: lignans, alkaloids, terpenoids, flavonoids and tannins.2
Despite this information, the most important biological activity of “quebra-pedras” is not associated with a single active ingredient or an herbal complex, thus studies based on plant fingerprint can be used to differentiate between the taxonomic species of Phyllanthus, as well as for the quality control of this plant-based drug.9
FT-IR and NMR spectroscopy have been widely used for these types of application because both simultaneously detect the signals of many compounds present in the sample.10 As the NMR and FT-IR
spectra of a single sample can contain a wide range of information, often with high complexity, the employment of statistical programs are necessary because these allow subtleties related to the various chemical constituents and their quantities to be clearly distinguished. In this context, chemometrics becomes a valuable tool.
According to the International Chemometrics Society, chemo-metrics is “the science of relating measurements made on a chemi-cal system or process to the state of the system via application of mathematical or statistical methods”.11 There are several chemometric
methods and the following were employed in the present study: Principal Components Analysis (PCA) and Hierarchical Cluster Analysis (HCA); which show the natural grouping from the samples and reveal similarity between them; and K-Nearest Neighbor (KNN), Soft Independent Modelling of Class Analogy (SIMCA) and Partial Least Squares - Discrimination Analysis (PLS-DA), which are super-vised pattern recognition techniques that construct models in order to recognize and classify unknown samples.12-15
methods, applied to NMR fingerprinting for the characterization of plants and quality control of herbal drugs, to be extremely useful.16
Thus, the present study involves an assessment using NMR and FT-IR spectroscopic techniques, coupled with chemometric methods, to investigate the authenticity of commercial samples of the herbal drug “quebra-pedras” by analyzing their fingerprints.
EXPERIMENTAL
Samples
Authentic vegetable samples of five Phyllanthus species (P. amarus, P. caroliniensis, P. niruri, P. tenellus and P. urinaria), which were grown under the same soil and climate conditions, were furni-shed by the Multidisciplinary Center for Chemical, Biological and Agricultural Research of Campinas State University (UNICAMP, Campinas/SP, Brazil). The samples were collected in January 2006 and three sets were analysed: aerial parts (leaves and stems); leaves only; and stems only. Thirteen authentic samples from different locations and collection dates were analyzed using the liquid state NMR technique only. Additionally, twenty commercial samples of “quebra-pedras” herbal drug were bought at several cities located in different regions of Brazil.
All samples were finely ground using a knife mill (14000 rpm for 3 min), then passed through a sieve (Ø 0.350 mm).
Spectroscopic measurements
FT-IR data
All FT-IR spectra were recorded on a Bomem Hartmann & Braun MB-Series model spectrometer. A total of 32 scans of the analysed spectral region (4000 to 400 cm−1) were carried out with a resolution
of 4 cm−1. The cosine function for apodization and automatic baseline
correction were used. The pressed translucent pellets were prepared using 1:50 mg powdered plant material and dry KSCN/KBr (0.2%), respectively.
NMR data
All NMR experiments were recorded at room temperature using a Bruker DRX400 spectrometer 9.4 T (1H at 400.2 MHz and 13C at 100.6
MHz). This equipment was equipped with 5-mm direct and inverse detection probes and a 4-mm HR-MAS probe with zirconium rotor. D2O (99.9%), CD3OD (99.8%) and TMSP-d4
[sodium-3-trimethylsilyl--2,2,3,3-d4 propionate] (98%), from Cambridge Isotope Laboratories
Inc. (USA), were used as solvent and internal reference, respectively. 1H HR-MAS NMR data
For each analysis, a quantity of powder sample sufficient to fill the volume of the rotor (12 µL) was used. Two drops of 0.016% solution of TMSP-d4 prepared in D2O were used as the internal reference for
chemical shift (δ 0.0) and field homogeneity adjustment. Samples were prepared in triplicate.
The spectra were collected spinning to 5 kHz of speed. The Carr-Purcell-Meiboom-Gill (CPMG) spin-echo pulse sequence was used (with low power water signal suppression) using τ=1.0 ms, which was fixed after optimization to permit broad signal attenuation (“T2 filter”),
and 150 cycles for refocusing the spin-coupled multiplets. A total of 256 free induction decays (FIDs) were collected with 32k data points. An 11.8 µs pulse width (90º pulse angle), 1.4 s relaxation delay and 2.9 s acquisition time, were used. The spectra were processed using 32k data points by applying an exponential line broadening of 1.0 Hz before Fourier transform for the S/N increase, and were accurately phased and baseline adjusted.
Liquid state NMR - aqueous extracts
The samples were prepared by carrying out infusions (addition of 0.3 g of previously powdered sample to 10 mL of boiling water for 10 min) and filtration. A 600 µL volume of the extract was transferred to a resonance tube and two drops of 0.16% solution of TMSP-d4 in D2O were added.
The noesypr1d sequence was used to acquire the 1H NMR spectra
(for water signal suppression). A configuration of 64k data points, pulse width of 8.5 µs, relaxation delay of 1.8 s, acquisition time of 5.5 s, mixing time of 100 ms and 64 scans was employed. The spectra were processed using 64k data points, by applying an exponential line broadening of 0.3 Hz and phase correction was carried out manually for each spectrum.
For the 13C{1H} and two dimensional NMR experiments, the
aqueous extract was prepared as described above and then lyophilized. After drying, the extract was dissolved in deuterated water and two drops of TMSP-d4 in D2O were added.
13C{1H} NMR spectra were acquired using 32k data points, a
pulse width of 6.0 µs, relaxation delay of 0.1 s, acquisition time of 1.4 s, and 54399 scans. The spectra were processed using 32k data points and by applying an exponential line broadening of 3.0 Hz and automatic baseline correction.
Two dimensional NMR experiments were performed using the standard spectrometer library pulse sequences. A 1H-1H gCOSY
expe-riment was run with spectral widths of 5208 Hz in f1 and 48 scans per t1 increment. The one-bond 1H-13C gHSQC experiment was recorded with
an evolution delay of 1.7 ms for an average 1J
C,H of 145 Hz. Spectral
widths of 20121 Hz in f1 and 104 scans per t1 increment were recorded. The long-range 1H-13C gHMBC experiment was recorded by setting
the evolution delay of 62.5 ms for LRJ
C,H for coupling constants of 8
Hz. A total of 196 scans per t1 increment were acquired, with spectral widths of 23981 Hz in f1. All spectra were acquired with spectral widths of 5208 Hz in f2, 4k x 256 data matrices, and relaxation delay of 1.0 s. Liquid state NMR - ethanolic extracts
Dried samples (600 mg) were extracted in 10 mL of absolute ethanol for 90 min. After filtration, the solvent was evaporated at 40 °C using a Büchi Waterbath B-480 rotary evaporator. The solid extract was dissolved in 600 µL of deuterated methanol and transferred to a 5 mm resonance tube and TMS was then added.
The composite pulse sequence, with HDO signal pre-saturation (zgcppr) pulse sequence, was used to acquire the 1H NMR spectra
(for water signal suppression). The parameters used were 64k data points, pulse width of 8.5 µs, relaxation delay of 1.8 s, acquisition time of 5.9 s and 32 scans. The spectra were processed using 64k data points, by applying an exponential line broadening of 0.3 Hz and phase correction was carried out manually.
The 1H-1H gCOSY experiment was performed with spectral
widths of 5995 Hz in f1 and 20 scans per t1 increment. The
1H-13C
gHSQC experiment was run with an evolution delay of 1.7 ms, spectral widths of 20121 Hz in f1 and 40 scans per t1 increment. The
1H-13C gHMBC experiment was conducted with an evolution delay
of 62.5 ms, 80 scans per t1 increment and spectral widths of 23981 Hz in f1. All spectra were acquired with spectral widths of 5995 Hz in f2, 4k x 256 data matrices and relaxation delay of 1.0 s.
Chemometric analyses
The software Pirouette® versions 3.11 and 4.0 (Infometrix Inc.,
Bothell, Washington, USA) was used for data analysis.
1H NMR and FT-IR spectra were transformed into ASCII files
Each 1H NMR spectrum was normalized using area normalization
(the area under the sample profile is set at equal to one) and the first derivative was taken (to correct minor variations in the spectra base-line) prior to PCA and HCA analysis. The data were also autoscaled, i.e., each variable was mean-centered and scaled to unit variance. In HCA, the Euclidean distance among samples was calculated and transformed into similarity indices ranging from 0 to 1 using the incremental linkage method.
Each FT-IR spectrum was normalized using area normalization and first and second derivatives were taken prior to the analyses. The data were also mean-centered. The group average method was used for HCA.
Construction of classification models
The parameters used in the optimization of all the models are shown in the supplementary material.
FT-IR data
The aerial parts, leaves and stems of each species were analyzed in triplicate for the construction of the models. The 5 classes used refer to the 5 species of Phyllanthus studied. Five replicates, one from each species, were randomly selected to validate the models.
In the KNN method, the Euclidean distance was used as the cri-terion for calculating the distance between samples from the training set, and the optimum number of nearest neighbors (K) was selected by taking into account the classification success with different K values. For the SIMCA model, the number of principal components (PCs) used in each class model was determined using local scope and a 95% confidence level.
In the PLS-DA model construction, the same mathematical parameter settings employed for PCA were used. Cross-validation (leave-one-out procedure) was used to estimate the performance of the model developed. Moreover, the optimal number of PCs was es-tablished by evaluating several statistical parameters: standard error of calibration (SEC) and standard error of validation (SEV), predicted residual sum of squares (PRESS), which had to be minimized, along with the R2 values from regression.
1H HR-MAS NMR data
The same samples described for the FT-IR data were used. However, these were analyzed in 6 replicates to confer added ro-bustness to the models. Ten replicates, 2 from each species, were randomly selected to validate the models.
The construction of the KNN, SIMCA and PLS-DA models was carried out in the same manner as described for the FT-IR data.
Liquid state NMR – aqueous extracts
Two different data sets were used in the construction of the mo-dels: set A – the same samples analyzed by the previous techniques (15 samples: 5 Phyllanthus species – aerial parts, leaves and stems); set B – the samples cited in set A and 13 authentic samples from different locations and with different collection dates (28 samples).
Five replicates of set A and 9 replicates of set B were randomly selected to validate the models. The construction of the classification models was carried out in the same manner as described previously.
RESULTS AND DISCUSSION
Spectroscopic analysis
FT-IR data
The present work studied the FT-IR spectroscopy due to three
factors: the measurements are easily carried out once the quantities of material and KBr are standardized; it is a low-cost technique; the analysis can be carried out directly from previously powdered plants , thus the laborious processes of extraction and/or isolation are eliminated and decomposition and/or undesirable chemical changes are prevented.
An internal standard was used in the FT-IR analyses in order to compare the absorption intensities of the samples. Based on the literature data, potassium thiocyanate (KSCN) was chosen because it absorbs in a different region of the samples (a unique absorption at approximately 2063cm-1), is non-toxic and thermally stable.17
Some characteristic absorption regions were observed in all spectra: O–H stretching vibration at approximately 3375 cm−1 (can
be derived from water molecules due to hygroscopicity of KBr, internal standard and/or the sample; therefore, this absorption was disregarded in the analysis); C–H stretching vibration at appro-ximately 2900 cm−1; C=O stretching vibration at approximately
1730 cm−1 (ester) and at approximately 1625 cm−1 (amide); N–H
bending vibration at approximately 1625 cm−1; C–N bending
vi-bration at approximately 1400 cm−1 (amide) and at approximately
1250 cm−1 (amine); C–O bending vibration at approximately 1100
cm−1 (ester/ether).
A high degree of similarity between standard and commercial samples was noted on the FT-IR spectra. However, the standard sam-ples P. niruri and P. urinaria and commercial samples P3, P10 and P11 showed more intense absorption than the other samples analyzed.
The leaves and stems of each species were analyzed separately, because the different proportions in commercial samples could affect the chemometric analysis results, given that the presence and quantity of chemical constituents in certain parts of the plant could vary. Only slight differences in the spectral profile of leaves and stems of each species were observed.
The visual analysis of all spectra was inconclusive, since only subtle differences were observed among them due to the presence of many compounds that generate complex information. Therefore, the chemometric methods were used to assist in the discrimination of the Phyllanthus species.
1H HR-MAS NMR data
Previously powdered plants were analyzed due to the same ad-vantages described in the FT-IR study.
The spectra were acquired using a modified CPMG pulse sequen-ce, as a T2 filter, and with water suppression. Therefore, the intense
HDO signal and the macromolecules signals were excluded. The presence of a large number of signals in the carbohydrates region was observed in all spectra. The intensity of these signals varied between samples and between replicates of the same sample. The presence of D-sucrose and α-D-glucose was identified in almost all samples, evidenced by the observation of the doublets in δ 5.42 (J = 3.8 Hz) and δ 5.24 (J = 3.7 Hz), respectively, related to anomeric hydrogens.
The spectra of the commercial samples were similar to the spectra of standard samples. However, the commercial samples designated P1, P7 and P13 had profiles that differed substantially to the others. These samples showed a small number of signals in the carbohydrates region.
The analyses of the leaves and stems of each species were also carried out separately. Some spectra showed very low signal/noise ratios because the powders obtained from them were finer and consequently were expelled more easily in the closure of the rotor.
Liquid state NMR - aqueous extracts
The samples were prepared by carrying out infusions with boiling water, because this is the usual form of ingesting the herbal drug (“quebra-pedras”). As a large amount of water was present in the samples, the spectra were obtained using a pulse sequence for water signal suppression (noesypr1d sequence).
The ¹H NMR spectra of aqueous extracts of the standard samples showed a large number of signals in the carbohydrates region, as well in the ¹H HR-MAS NMR spectra. Moreover, there were also signals in the aromatic and aliphatic regions. Again, a high degree of similar-ity between various signals present in all regions of all samples and signal intensity differences were observed.
The aqueous extracts of leaves and stems were also analyzed. For all species, the amount of chemical constituents in the extracts of the leaves was higher than in the extracts of the stems, which may have been related to the amount of hydrosoluble metabolites present in this part of the plant.
Some commercial samples had spectral profiles closely resem-bling the profiles of the standards, while others (P1, P7, P13, P14 and P19) had distinctly different profiles, as observed in the analysis of 1H HR-MAS spectra of the same samples.
A more detailed analysis of the 1H NMR spectra of the standard
samples and the employment of 13C, gCOSY, gHSQC and gHMBC
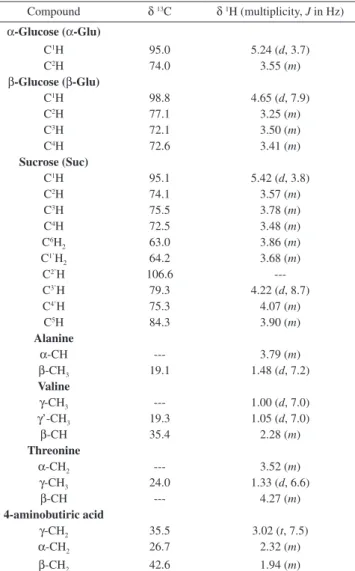
NMR experiments enabled some signals to be assigned. All spectra showed the carbohydrate signals (D-sucrose, α and β-D-glucose) and amino acids (alanine, valine, threonine and 4-aminobutyric acid). The assignment is shown in Table 1S, supplementary material. These signals were observed at different intensities for each species. Assignment confirmation was reached using the literature data.18
Liquid state NMR - ethanolic extracts
The ethanolic extracts of the standard samples were also analyzed so as to allow the results of their exploratory analysis to be compared with results obtained in the analysis of aqueous extracts.
The information obtained from the spectra of aqueous extracts was mostly on the primary metabolites (carbohydrates and amino acids), while the information obtained in the spectra of ethanolic extracts was on the secondary metabolites, giving the spectra a greater complexity.
Despite this complexity, it was possible to identify one of the metabolites present in the extract prepared using the P. amarus sample: phyllanthin (Figure 1S, supplementary material). The com-pound structure was determined by 1D (1H and 13C) and 2D (1H-13C
gHMBC) NMR experiments (Table 2S, supplementary material) and confirmed by comparing these data with those from the literature,19
since this compound was isolated from this species. It should be noted that the phyllanthin signals were only observed in the extract of P. amarus species.
Chemometrics analysis
Phyllanthus species discrimination by PCA and HCA methods FT-IR data
The absorbance data of all samples were used for chemometric analysis, because the principal components in PCA are obtained by linear combination of original data that are correlated. Therefore, the data to be analyzed have to vary linearly with the concentration to prevent any changes in the original data.
Initially, the PCA method was applied to FT-IR spectra of the standard samples in order to determine compositional differences between these samples. Regions that had no relevant information to the discrimination of the samples were excluded (Figure 2S, supple-mentary material).
The data were mean-centered in preprocessing. With this mathe-matical manipulation the relationships between samples can be more easily visualized by placing the plot origin at the center of the data set. Therefore, this procedure is recommended for most types of data.15
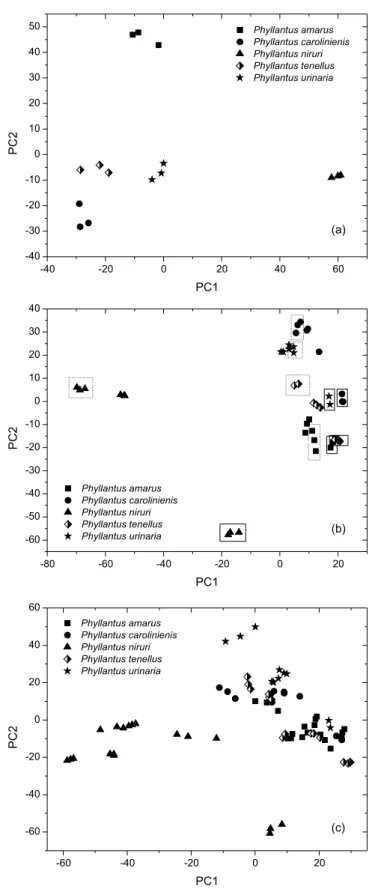
The PCA results related to the data matrix obtained from the FT-IR spectra of five standard samples of Phyllanthus species after variable selection, are reported in Figure 1. The first principal ponent (PC1) shows 42.0% of total variance, while the second com-ponent (PC2) shows 27.5%. The samples are grouped into 5 distinct clusters according to the different Phyllanthus species: P. amarus, P. caroliniensis, P. niruri, P. tenellus and P. urinaria.
According to the loadings graph, the variables responsible for taxonomic discrimination of the samples are in the area of fingerprint and absorptions at approximately 1700 and 2900 cm-1.
The taxonomic differentiation between Phyllanthus species was also obtained by Hierarchical Cluster Analysis (HCA) with a similarity index of 0.487 (Figure 3S, supplementary material). The separation was in good agreement with the PCA results.
A further PCA analysis was carried out by adding data from the stems and leaves to the matrix. PCA score plots (Figures 4Sa and 4Sb, supplementary material) show 85.5% of the original variability information. Figure 3Sa, supplementary material, demonstrates good discrimination between the samples composed of stems only (positive score values of PC1) and the other parts (aerial parts and samples composed of leaves only). However, satisfactorily discrimi-nation between the samples composed of leaves only (circled with a dashed line) and the standard samples (comprising aerial parts) proved unattainable. This shows that the composition of standard samples contained more leaves than stems. Figure 4Sb shows a trend of taxonomic differentiation of the plant species.
According to the loadings graph, the spectral regions responsible for discrimination shown in Figure 1 were also responsible for the distinction shown in Figures 4Sa and 4Sb, supplementary material. 1H HR-MAS NMR
PCA analysis of 1H HR-MAS NMR spectra of standard samples
was carried out, as in the FT-IR data study, to verify the similarities between these samples. In this analysis, the residual signal of water, the TMSP-d4 signal, and non-informative ranges of the spectra were
excluded (Figure 5S, supplementary material).
The data were autoscaled during processing. This function confers the less intense signals in the 1H NMR spectra the same importance
as the most intense signals. When smaller constituents are of interest,
this function is useful because it attributes the same influence to all signals. However, its use requires the exclusion of all noise in the spectrum to ensure it does not interfere in the discrimination.
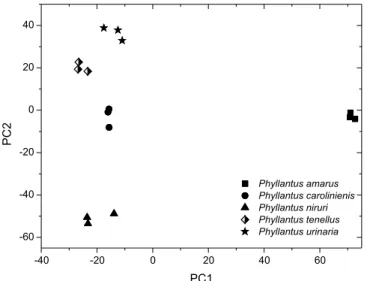
Figure 2 shows the PCA results after variable selection was re-ported. PC1 shows 42.8% of total variance, while PC2 shows 27.3%. The samples are grouped into 5 clearly distinct clusters according to taxonomic origin.
The loadings graph and 1H HR-MAS NMR spectra revealed the
variables responsible for sample discrimination. The doublet from D-sucrose had greater weight for the differentiation of the P.urinaria and P. tenellus species, while the α-D-glucose had greater weight for the discrimination of the P. caroliniensis species.
In the HCA, 5 main clusters were obtained with a similarity index of 0.591 and these clusters are related to the taxonomic differentiation between species (Figure 6S, supplementary material).
A further PCA analysis was carried out, in which the data from the stems and leaves were added to the matrix. PCA score plots (Figure 7S, supplementary material) showed 53.3% of the original variability information. In this graph, the dispersion observed between the replicates is likely due to sample preparation problems. However, these problems must be considered in the construction of the models, because the tendency of separation from species was observed in the three-dimensional plot only (data not shown).
Liquid state NMR - aqueous extracts data
PCA analysis of the 1H NMR spectra of the standard samples
was carried out, as in the previous analysis, to verify the grouping of these samples. Once more, non-informative ranges of the spectra were excluded for this analysis (Figure 8S, supplementary material) and the data were also autoscaled during preprocessing.
Figure 3a shows the PCA results related to the data matrix that were obtained from the 1H NMR spectra of 5 standard samples of
Phyllanthus species prepared as “quebra-pedras tea” after the va-riable selection was reported. PC1 shows 37.3% of total variance, while PC2 shows 21.9%. The samples were grouped into 5 distinct clusters according to the different Phyllanthus species. The values of the principal components of the score plot were related to the values of the loading graph allowing the variables responsible for cluste-ring to be identified. However, it was not possible to relate them to the compounds in the samples, because none of them matched the compounds identified above.
The taxonomic differentiation of the Phyllanthus species was also
obtained from the Hierarchical Cluster Analysis. The incremental method and a similarity index equal to 0.510 were employed (Figure 9S, supplementary material).
Figure 2. PCA score plots of five standard samples of Phyllanthus species
(aerial parts) analyzed by 1H HR-MAS NMR
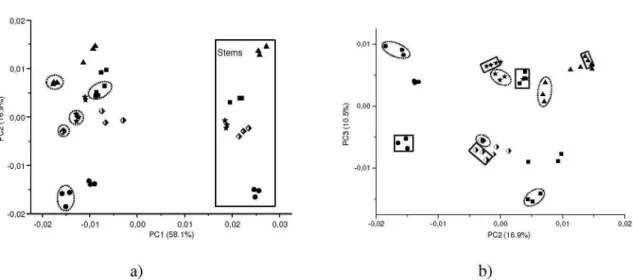
A further PCA analysis was carried out by adding data from the stems and leaves to the matrix. The PCA score plots (Figure 3b) exhibit 41.9% of the original variability information. In this Figure, a taxonomic differentiation trend of the plant is evident. According to the loadings graph, the regions responsible for discrimination, shown in Figure 3a, were also responsible for distinction, as shown in Figure 3b.
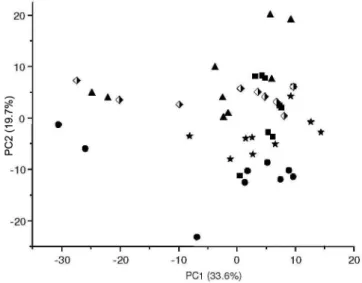
The results shown in Figures 3a and 3b were obtained from the standard samples furnished by the Multidisciplinary Center for Chemical, Biological and Agricultural Research - UNICAMP. However, 13 authentic samples from different locations and for diffe-rent collection dates were also analyzed using the liquid state NMR technique. In this study, factors related to seasonality and regionalism were also considered. In the score plot obtained from the Principal Component Analysis (Figure 3c), the samples relating to the P. niruri species differed from the others with negative values of PC2, while the tendency of separation from other species was observed in the three-dimensional plot (data not shown).
Liquid state NMR - ethanolic extracts data
Figure 4 shows the PCA result related to the data matrix obtained from the 1H NMR spectra of ethanolic extracts of the Phyllanthus
species after variable selection (Figure 10S, supplementary mate-rial). PC1 shows 33.2% of total variance, while PC2 shows 22.1%; the two PCs together show 55.3% of the original information. In this score plot, very low sample variability between replicates is confirmed by observing the close proximity of the observations, thus supporting both the strong reproducibility of the NMR me-thod and the sample homogeneity. The samples are grouped into 5 clearly distinct clusters according to chemotaxonomic origin: P. amarus, P. caroliniensis, P. niruri, P. tenellus and P. urinaria. This result corroborates those obtained using other analytical techniques presented in this paper.
The loading graph and spectra allowed the variables responsible for P. amarus samples discrimination to be identified. The variables with high positive values on PC1 are related to the phyllanthin signals. This compound was not found in the other samples.
Phyllanthus species classification by KNN, SIMCA and PLS-DA methods
FT-IR data
The test set (5 randomly selected samples) was projected into the
models to verify their classification ability. The prediction abilities of the three models was 100% for all classes.
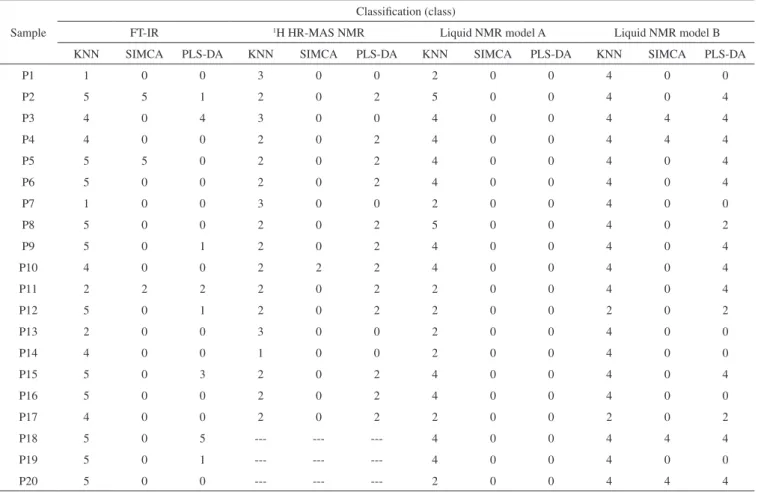
Table 1 shows a summary of classification results following the application of the three models to the set of commercial samples. The numbers corresponding to the Phyllanthus species are shown in Table 1 and “0” indicates that the sample was not classified into any class.
Only one commercial sample was classified equally by all models (P11). The classification obtained by three models was divergent for 20% of the samples analyzed. Moreover, the classification given by two models was the same for 75% of the samples analyzed. Although each chemometric model has its limitations, these results can be rela-ted to a mixture of different plant species in the commercial samples (Phyllanthus or otherwise).
Furthermore, it should be emphasized that no sample was classified as P. niruri species by any of the classification methods employed. However, the labels of the commercial samples specified that the material belonged to this species. Moreover, if the results of more than one classification method are considered, 55% of the samples were found not to belong to the Phyllanthus species studied. 1H HR-MAS NMR data
In the classification of the test set, the prediction ability of the KNN model was 100% versus 90% for the SIMCA and PLS-DA models. Table 1 shows the classification results following the appli-cation of three models to the commercial samples set.
Only one sample (P10) was equally classified by all models and, if the classification given by two models is considered, 5 samples were found not to belong to any class. It was also observed that 70.6% of the commercial samples were classified as belonging to the P. caroliniensis species, while by the FT-IR classification; only one sample was classified as such. This fact may be related to the information provided by the 1H HR-MAS NMR technique, since
only carbohydrate signals were observed in the spectra and, in the spectrum of P. caroliniensis, these signals were more intense than that for others species. Therefore, most of the commercial samples were classified as belonging to this species.
The KNN method must classify the unknown samples into a class, so the classification of samples P1, P7 and P13 should be disregarded. These samples showed a very different spectral profile to the others, and the visual analysis did not allow their classification as one of the species studied, as done by the SIMCA and PLS-DA methods.
Liquid state NMR - aqueous extracts data
KNN, SIMCA and PLS-DA models were built using the 1H NMR
spectra from aqueous extracts of aerial parts, leaves and stems of five authentic samples of Phyllanthus species.
For set A: the samples analyzed are shown in the PCA plot (Figure 3b). For set B: the PCA plot is shown in Figure 3c.
Finally, in the classification of the test set, the prediction ability of all models was 100% for sets A and B. The classification results are shown in Table 1.
The results obtained by applying the SIMCA and PLS-DA mo-dels to set A were identical and showed that none of the commercial samples belonged to the Phyllanthus species studied. Similar results were obtained for the FT-IR data, in which 55% of the commercial samples were classified as belonging to none of the classes.
One of the possible reasons for the classifications obtained is the small number of standard samples used in the construction of the models, which rendered them unrepresentative. Therefore, a larger number of standard samples was used to build new models (set B) the results of which are given in Table 1.
This addition of standard samples changed the classification of the commercial samples, and this became more consistent, taking
Table 1. Predicted class obtained by KNN, SIMCA and PLS-DA models applied to the prediction Phyllanthus data
Sample
Classification (class)
FT-IR 1H HR-MAS NMR Liquid NMR model A Liquid NMR model B
KNN SIMCA PLS-DA KNN SIMCA PLS-DA KNN SIMCA PLS-DA KNN SIMCA PLS-DA
P1 1 0 0 3 0 0 2 0 0 4 0 0
P2 5 5 1 2 0 2 5 0 0 4 0 4
P3 4 0 4 3 0 0 4 0 0 4 4 4
P4 4 0 0 2 0 2 4 0 0 4 4 4
P5 5 5 0 2 0 2 4 0 0 4 0 4
P6 5 0 0 2 0 2 4 0 0 4 0 4
P7 1 0 0 3 0 0 2 0 0 4 0 0
P8 5 0 0 2 0 2 5 0 0 4 0 2
P9 5 0 1 2 0 2 4 0 0 4 0 4
P10 4 0 0 2 2 2 4 0 0 4 0 4
P11 2 2 2 2 0 2 2 0 0 4 0 4
P12 5 0 1 2 0 2 2 0 0 2 0 2
P13 2 0 0 3 0 0 2 0 0 4 0 0
P14 4 0 0 1 0 0 2 0 0 4 0 0
P15 5 0 3 2 0 2 4 0 0 4 0 4
P16 5 0 0 2 0 2 4 0 0 4 0 0
P17 4 0 0 2 0 2 2 0 0 2 0 2
P18 5 0 5 --- --- --- 4 0 0 4 4 4
P19 5 0 1 --- --- --- 4 0 0 4 0 0
P20 5 0 0 --- --- --- 2 0 0 4 4 4
Classes: 1 - P. amarus; 2 - P. caroliniensis; 3 - P. niruri; 4 - P. tenellus; 5 - P. urinaria
into account the result given by at least two methods, where only six samples were not classified as belonging to the Phyllanthus species. Five of these (P1, P7, P13, P14 and P19) were, by simple visual analysis of their spectra, different from the others.
Moreover, the vast majority of commercial samples were clas-sified as P. tenellus species, which is a species recommended by the Brazilian Pharmacopoeia, although their labels bore the description of the P. niruri species.
Comparison of results obtained in classification of commercial samples using spectroscopic techniques and classification methods
All models showed good reliability, but the low reproducibility of the 1H HR-MAS NMR measurements rendered results inferior to
those produced by the other techniques. Although the classification given by the three spectroscopic techniques using the KNN, SIMCA and PLS-DA methods were in some cases divergent, most of them indicated that many of the commercial samples probably did not belong to any of the Phyllanthus species studied here.
However, the study by 1H NMR spectroscopy of aqueous extracts
performed with a greater number of standards showed that a large data set and their variability are essential to build the models, since factors such as seasonality and regionality should be considered, thereby increasing the representativeness of the analysis. Regardless of the spectroscopic technique used, the SIMCA model classified the commercial samples as belonging to any of the classes used, probably due to the way the models were built (hyperboxes).
When the 1H NMR spectra of the aqueous extract were used
and the number of standard samples increased, most samples were
classified as belonging to the P. tenellus species, which is a species recommended by the Brazilian Pharmacopoeia, although the sample labels bore the description of the P. niruri species.
CONCLUSIONS
Taxonomic distinction among the Phyllanthus species was suc-cessfully attained by PCA and HCA analysis of the data from the three techniques evaluated: FT-IR, 1H HR-MAS NMR and 1H NMR of
aqueous and ethanolic extracts. The 1H NMR of the aqueous extracts
technique showed the highest reproducibility because its replicates were more grouped.
Some substances in the aqueous extract could be identified, however, even with this information; the analysis of the loading graphs did not allow relating of these substances with the clusters observed. However, in the analysis of the 1H NMR of ethanolic
extract the phyllanthin signals were related to discrimination of the P. amarus sample.
NMR and FT-IR techniques show great potential for use in stu-dies of complex matrices such as the “quebra-pedras” herbal drug. However, the 1H NMR of the aqueous extracts was considered the
most adequate technique, because the spectra analysis showed the best results for the samples. Therefore, the sample preparation is simple, easy and quick. The data set can be representative if based on a high quantity of standard samples thereby considering factors such as seasonality and regionalism.
SUPPLEMENTARY MATERIAL
some figures and some tables are freely available on page http:// quimicanova.sbq.org.br, in file PDF format.
ACKNOWLEDGMENTS
This work was financially supported by CAPES, CNPq, FAPESP and FINEP.
REFERENCES
1. Brasil, Ministério da Saúde, Agência Nacional da Vigilância Sanitária;
Resolução RDC n° 48, 16/03/04.
2. Gilbert, B.; Ferreira, J. L. P.; Alves, L. F.; Monografias de Plantas
Medicinais Brasileiras e Aclimatadas, Sépia Editora e Gráfica Ltda:
Curitiba, 2005.
3. Brasil; Decreto nº 5.183, 22/06/2006.
4. Brasil, Ministério da Saúde, Agência Nacional da Vigilância Sanitária;
Resolução RDC n° 10, 10/03/10.
5. Takemori, N. K.; Alquini, Y.; Resumos do 51° Congresso Nacional de Botânica, Brasília, Brasil,2000.
6. Freitas, A. M.; Schor, N.; Boim, M. A.; Br. J. Urol. Int.2002, 89, 829. 7. Brasil, Ministério da Saúde, Agência Nacional da Vigilância Sanitária;
Resolução RDC n° 73, 13/04/04; Farmacopeia Brasileira, 1996, 4ª ed.,
fascículo 5, parte II; monografias 246 e 247.
8. Barroso, G. M.; Peixoto, A. L.; Ichaso, C. L. F.; Costa, C. G.; Guimarães, E. F.; Lima, H. C.; Sistemática de Angiospermas do Brasil, Ed. da UFV: Viçosa, 1984, vol. 2.
9. Lorenzi, H.; Matos, F. J. A.; Plantas Medicinais no Brasil, Instituto Plantarum de Estudos da Flora Ltda: Nova Odessa, 2002.
10. Holmes, E.; Tang, H.; Wang, Y.; Seger, C.; Planta Med. 2006, 72, 771. 11. Hibbert, D. B.; Minkkinen, P.; Faber, N. M.; Wise, B. M.; Anal. Chim.
Acta 2009, 642, 3.
12. Beebe, K.; Pell, R.; Seaholts, N. B.; Chemometric: A practical guide, Ed. John Wiley & Sons: New York, 1998.
13. Brereton, R. G.; CHEMOMETRICS: Data Analysis for the Laboratory and Chemical Plant, John Wiley & Sons: Chichester, 2002.
14. Brescia, M. A.; Di Martino, G.; Fares, C.; Di Fonzo, N.; Plantani, C.; Chelli, S.; Reniero, F.; Sacco, A.; Cereal Chem. 2002, 79, 238. 15. Pirouette®, User Guide, version 4.0 ; Infometrix Inc., 1985-2007. 16. Daolio C.; Beltrame, F. L.; Ferreira, A. G.; Cass, Q. B.; Cortez, D. A. G.;
Ferreira, M. M. C.; Phytochem. Anal. 2008, 19, 218; Ward, J. L.; Harris, C.; Lewis, J.; Beale, M. H.; Phytochemistry2003, 62, 949; Wang, Y. L.; Tang, H. R.; Nicholson, J. K.; Hylands, P. J.; Sampson, J.; Whitcombe, I.; Stewart, C. G.; Caiger, S.; Oru, I.; Holmes, E.; Planta Med. 2004, 70, 250; Rasmussen, B.; Cloarec, O.; Tang, H. R.; Staerk, D.; Jaroszewski, J. W.; Planta Med. 2006, 72, 556.
17. Wiberley, S. E.; Sprague, J. W.; Campbell, J. E. ; Anal. Chem. 1957, 29, 210.
18. Cazor, A.; Deborde, C.; Moing, A.; Rolin, D.; This, H.; J. Agric. Food Chem.2006, 54, 4681; Gall, G.; Puaud, M.; Colquhoun, I. J.; J. Agric.
Food Chem.2001, 49, 580; Sobolev, A. P.; Segre, A.; Lamanna, R.;
Magn. Reson. Chem.2003, 41, 237; Sobolev, A. P.; Brosio, E.; Gianferri, R.; Segre, A. L.; Magn. Reson. Chem.2005, 43, 625.
Supplementary Material
*e-mail: [email protected]
#Artigo em homenagem ao Prof. Otto R. Gottlieb (31/8/1920-19/6/2011)
AUTHENTICITY STUDY OF Phyllanthus SPECIES BY NMR AND FT-IR TECHNIQUES COUPLED WITH
CHEMOMETRIC METHODS#
Maiara S. Santos*, Edenir R. Pereira-Filho e Antonio G. Ferreira
Departamento de Química, Universidade Federal de São Carlos, CP 676, 13560-970 São Carlos – SP, Brasil Elisangela F. Boffo
Instituto de Química, Universidade Federal da Bahia, 40170-115 Salvador – BA, Brasil Glyn M. Figueira
Centro Pluridisciplinar de Pesquisas Químicas, Biológicas e Agrícolas, Universidade Estadual de Campinas, CP 6171, 13081-970 Campinas – SP, Brasil
MODELS OPTIMIZATION
FT-IR data
The parameters used in the models optimization were: - in the KNN model, K = 1 was selected because with this value
there are no prediction errors;
- in the SIMCA model, two PCs were selected for all categories because they obtained more than 85% of information from the data analyzed in all classes: 93.4% for P. amarus, 85.0% for P. caroliniensis, 88.4% for P.niruri, 87.7% for P. tenellus and91.6% for P. urinaria.
The PLS-DA loadings for the calibration models were similar to those observed in the PCA analysis. In this model, 5 PCs were used for the P. amarus, P. niruri, P. tenellus and P. urinaria classes,whereas 4 PCs were used for the P. caroliniensis with SEC, SEV and PRESS Val less than 0.153, 0,211 and 1.787, respectively, and R2 greater than
0.854. The calibration statistics indicated that the model developed could be acceptable to classify new samples.
1H HR-MAS NMR data
The parameters used in the models optimization were: - in the KNN method, seven prediction errors were obtained with K
= 1. These errors are due to the proximity between different classes; - in the SIMCA model, 5 PCs were selected for the P. amarus class
(96.5%), 4 PCs were usedfor the P. caroliniensis (95.6%) and P. niruri (86.8%) classes, whereas three PCs were used for the P. tenellus (84.3%) and P. urinaria (86.6%) classes.
Considering the PLS-DA model, 3 PCs were used for the P. amarus, 4 for the P. caroliniensis and P.niruri, whereas 6 PCs were used for P. tenellus and P. urinaria classes with SEC, SEV and PRESS Val less than 0.118, 0.151 and 1.202, respectively, and R2
greater than 0.756.
Liquid state NMR - aqueous extracts
The parameters used in the models optimization were: - in the KNN methods, K = 1 was selected because with this value
there are no prediction errors (sets A and B).
- in the SIMCA method from set A, 3 PCs were used for the P. amarus (85.3%), P. caroliniensis (86.0%)and P. tenellus (86.8%) classes and 2 PCs were usedfor the P. niruri (79.4%)and P. urinaria (78.2%) classes.
- for the SIMCA method from set B, 4 PCs were used for the P. amarus (78.3%)and P. tenellus (77.8%)classes, whereas for the P. caroliniensis (86.3%), P. niruri (76.6%)and P. urinaria (83.5%) classes 3 PCs were used.
Considering the PLS-DA model from set A, 3 PCs were used for the P. amarus class, 5 PCs were used for the P. caroliniensis and P. urinaria classesand 2 PCs were used for the P. tenellus and P. niruri classes with SEC, SEV and PRESS Val less than 0.072, 0.101 and 0.410, respectively, and R2 greater than 0.973.
In the PLS-DA model from set B, 4 PCs were used for the P. amarus, P. caroliniensis, P. tenellus and P. niruri classes and 6 PCs were usedfor the P. urinaria class with SEC, SEV and PRESS Val less than 0.081, 0.135 and 1.347, respectively, and R2 greater than 0.923.
RESULTS
Table 1S.1H and 13C NMR data for compounds in the Phyllanthus aqueous
extract
Compound δ13C δ1H (multiplicity, J in Hz)
α-Glucose (α-Glu)
C1H 95.0 5.24 (d, 3.7)
C2H 74.0 3.55 (m)
β-Glucose (β-Glu)
C1H 98.8 4.65 (d, 7.9)
C2H 77.1 3.25 (m)
C3H 72.1 3.50 (m)
C4H 72.6 3.41 (m)
Sucrose (Suc)
C1H 95.1 5.42 (d, 3.8)
C2H 74.1 3.57 (m)
C3H 75.5 3.78 (m)
C4H 72.5 3.48 (m)
C6H
2 63.0 3.86 (m)
C1’H
2 64.2 3.68 (m)
C2’H 106.6
---C3’H 79.3 4.22 (d, 8.7)
C4’H 75.3 4.07 (m)
C5H 84.3 3.90 (m)
Alanine
α-CH --- 3.79 (m)
β-CH3 19.1 1.48 (d, 7.2)
Valine
γ-CH3 --- 1.00 (d, 7.0)
γ’-CH3 19.3 1.05 (d, 7.0)
β-CH 35.4 2.28 (m)
Threonine
α-CH2 --- 3.52 (m)
γ-CH3 24.0 1.33 (d, 6.6)
β-CH --- 4.27 (m)
4-aminobutiric acid
γ-CH2 35.5 3.02 (t, 7.5)
α-CH2 26.7 2.32 (m)
β-CH2 42.6 1.94 (m)
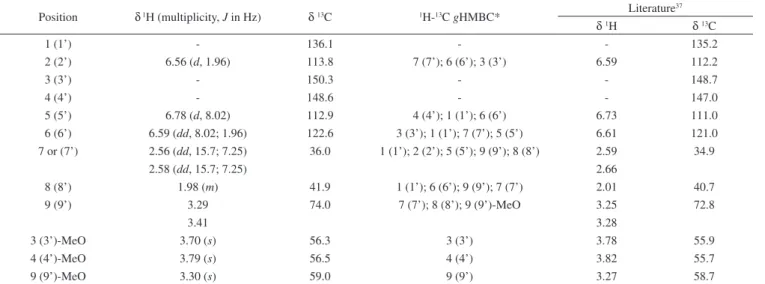
Table 2S.1H, 13C and gHMBC NMR data for phyllanthin
Position δ 1H (multiplicity, J in Hz) δ 13C 1H-13C gHMBC* Literature 37
δ 1H δ 13C
1 (1’) - 136.1 - - 135.2
2 (2’) 6.56 (d, 1.96) 113.8 7 (7’); 6 (6’); 3 (3’) 6.59 112.2
3 (3’) - 150.3 - - 148.7
4 (4’) - 148.6 - - 147.0
5 (5’) 6.78 (d, 8.02) 112.9 4 (4’); 1 (1’); 6 (6’) 6.73 111.0
6 (6’) 6.59 (dd, 8.02; 1.96) 122.6 3 (3’); 1 (1’); 7 (7’); 5 (5’) 6.61 121.0
7 or (7’) 2.56 (dd, 15.7; 7.25) 36.0 1 (1’); 2 (2’); 5 (5’); 9 (9’); 8 (8’) 2.59 34.9
2.58 (dd, 15.7; 7.25) 2.66
8 (8’) 1.98 (m) 41.9 1 (1’); 6 (6’); 9 (9’); 7 (7’) 2.01 40.7
9 (9’) 3.29 74.0 7 (7’); 8 (8’); 9 (9’)-MeO 3.25 72.8
3.41 3.28
3 (3’)-MeO 3.70 (s) 56.3 3 (3’) 3.78 55.9
4 (4’)-MeO 3.79 (s) 56.5 4 (4’) 3.82 55.7
9 (9’)-MeO 3.30 (s) 59.0 9 (9’) 3.27 58.7
Abbreviations: s – singlet, d –doublet, dd – doublet of doublet, m – multiplet. *gHMBC data set: the numbers correspond to the correlated carbons.
Figure 1S. Phyllanthin structure
Figure 4S. PCA score plots of five standard samples of Phyllanthus species (aerial parts, leaves and stems separately) analyzed by FT-IR: (a) PC1 x PC2 (b) PC2 x PC3. The samples composed of only leaves were circled with a dashed line and samples composed of only stems were circled with squares
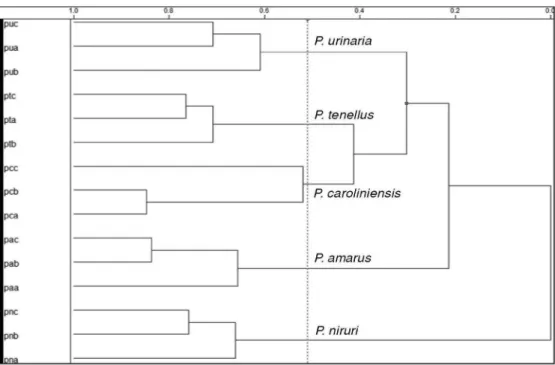
Figure 6S. HCA dendrogram obtained from 1H HR-MAS NMR data of five standard samples of Phyllanthus species (similarity index: 0.591)
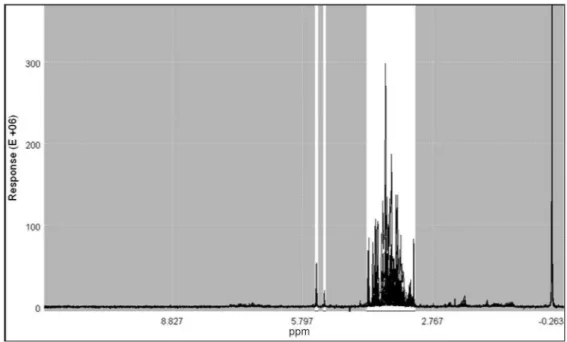
Figure 8S. 1H NMR spectra of all samples analyzed (aqueous extracts), showing the selected regions used in the statistical analyses (in white)
Figure 10S. 1H NMR spectra of all samples analyzed (ethanolic extracts), showing the selected regions used in the statistical analysis (in white)