Article
J. Braz. Chem. Soc., Vol. 26, No. 6, 1143-1151, 2015. Printed in Brazil - ©2015 Sociedade Brasileira de Química 0103 - 5053 $6.00+0.00
A
*e-mail: [email protected], [email protected]
Recovery Process Development for the Rare Earths from Permanent Magnet Scraps
Leach Liquors
Ho-Sung Yoon, Chul-Joo Kim, Kyeong W. Chung, Sung-Don Kim and Jyothi R. Kumar*
Extractive Metallurgy Department, Mineral Resources Research Division, Korea Institute of Geoscience and Mineral Resources (KIGAM), 124 Gwahang-no,
Yuseong-gu, 305-350 Daejeon, Republic of Korea
The current study deals with the recovery process development for the rare earths (REs), i.e., dysprosium (Dy) and neodymium (Nd), metals from permanent magnet scraps leach liquors. Its main objective is the recovery of the rare earths (Dy and Nd) from permanent magnet scraps (PMSs). Introdutory experiments were carried out to get leach liquor solution: oxidation/roasting, acid leaching, and precipitation methods implemented for PMSs dissolution. The obtained PMSs leach liquor was diluted ten times and used for present study. Di-2-ethylhexyl phosphoric acid (D2EHPA) was used as an extractant for recovery of the REs and kerosene as diluent system. The present study optimized the various experimental parameters such as the time influence on extraction process, influence of pH, extractant concentration, separation factors calculated, scrubbing, stripping, maximum loading capacity of the extractant, and various phase ratios as well as phase ratios influence on present metals separations. Loading capacity of D2EHPA and selective stripping process were developed for targeted metal ions by using various mineral acids such as hydrochloric, sulfuric and nitric acids. The metal content analysis in the aqueous samples was determined with inductively coupled plasma optical emission spectrometer (ICP OES) for sensitive and accurate data.
Keywords: recovery, dysprosium, neodymium, permanent magnets scraps, D2EHPA
Introduction
The field of the rare earths (REs) processing from their ores and secondary resources (spent matrices) is captivating. Important research and development to explore and establish forms and put the REs for use in various industrial fields remains globally explored. The REs have an ever growing variety of applications in contemporary science and technology fields. They provide many industries with crucial materials and they provide numerous customers with benefits. From these beginnings and over several decades, industrial applications of REs have developed in diverse sectors such as metallurgy, magnets, ceramics, electronics, chemical, optical, medical and nuclear technologies. Apart from applicability, the price of REs is also growing, based on demand as well as the fast comsumption of natural resources and the quick globally growing of human population and their needs.1
REs mining, processing and recycling cause environmental issues.2 Firstly, mining the REs from natural
resources will generate the overburden rock waste and sub-ore stockpile and, at the time of the REs processing, tailings and liquid waste will be generated.2 After utilized,
the REs products reach the end-life that will rise the landfill problems. All these three stages have various contaminants, i.e., radiologicals, acid mine, organics, metals, dust and associated pollutants will be generated and affect the human health.2
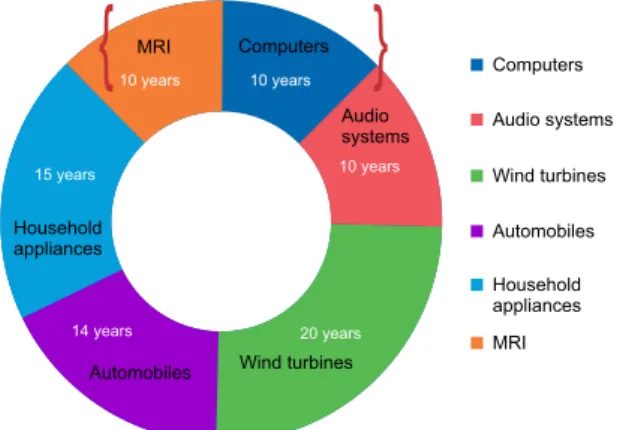
Permanent magnets (PMs) are the most critical parts in electrical, electronics and medical devices (EEMD) like NdFeB magnets, the most commonly used EEMDs. The life spans of end-use products of magnetic resonance imaging (MRI), computers, and audio systems is ten years (Figure 1).3
There are still other older devices such as cars (14 years), appliances (15 years) and wind turbines (20 years).1
and MRIs 3 Gg (lowest), Pr or Dy is used in computers that range between 5.3 and 0.8 Gg and Tb is used for computers from 1.1 to 0.2 Gg for the above mentioned applications.1
After utilization of the PMs in the above fields, they become scrap. Also, industries generate a certain amount of the scrap when manufacturing the goods, especially countries like Korea, which exports electrical and electronic goods globally (from SAMSUNG and LG companies). Korea is facing two major challenges: one is the limited natural resources, the other one is the generated scrap raises landfill problems. Chemical processes play vital roles in confronting both of the challenges. In the present study two processes, i.e., solvent extraction (liquid-liquid extraction) and selective stripping are implemented for being an economically feasible analytical method development and environmentally friendly approach. The main goal of the present study is to recover the two major REs, i.e., dysprosium and neodymium.
A past literature survey gives the impression that very limited reports are available and used various methods/ reagents. Di-nonyl phenyl phosphoric acid (DNPPA) is employed as an extractant system for dysprosium associated with other REs lanthanum (La) and yttrium (Y) extraction from hydrochloric acid solutions. The study reported that lower acidic conditions like 0.5 mol dm−3 are much more favorable for Dy and other REs, up to 99.99% extraction efficiency of 0.02 mol dm−3 of DNPPA.4 Solid-phase extractions reported on dysprosium(III) ion imprinted polymer particles based on copolymerization of styrene monomers and a crosslinking agent divinylbenzene.5
Almost 99% of extractions reported had pH between 6 to 9, whereas at pH 10, it was reached to 71%. Reported binding capacity of dysprosium(III) ion is 40.15 mg g−1. Selective precipitation striping process of the Dy-Nd pair was reported, and 15/20% H2SO4 was used for the selective
stripping with the addition of 5, 10, 15% sodium sulfate.6
The separation of neodymium(III) from other lanthanides by using hollow fiber supported liquid membrane and flat renewal supported liquid membrane was recently reported.7,8 Four organo-phosphorous extractants namely,
D2EHPA, PC 88A, Cyanex 272 and Cyanex 302, were utilized for neodymium extraction of additional associated elements such as lanthanum, cerium and praseodymium. These elements had the highest equilibrium constant (Kex)
38 reported for the neodymium with D2EHPA extractant system.9 Cyanex 272 proved to be a better extractant
system for Pr-Nd separation from La compared with other extractants such as D2EHPA, PC88A, and 301.8. Further 50% saponified (with NaOH) 2 mol dm−3 Cyanex 272 tested the three stage counter current extraction process and loaded organic phase contained 77 mg L−1 La, 230 mg L−1 Pr and 657 mg L−1 Nd was reported.10 Di(2-ethyl-hexyl) phosphoric acid (D2EHPA) dissolved in hexane for NdIII
distribution from nitrate aqueous media to organic phase was established and reported.11 The extractant system,
15 vol% solution of D2EHPA, dissolved in Shellsol AB was utilized for continuous counter current extraction (eight stages required for light rare earths: La, Ce, Pr, Nd), with 2 to 4 scrubbing stages with 1.0 mol dm−3 nitric acid solutions.12 D2EHPA was dissolved in hydrocarbon
diluent Amsco and utilized 1.0 mol dm−3 concentration for extraction of Nd and Sm from three acidic mediums such as chloride, perchlorate and nitrate solutions.13
The main target of the present study was to complete the method development for the extraction and separation of dysprosium and neodymium from permanent magnet scraps leach liquors without waste generation. The metal contents of the aqueous feed solutions were slightly varied based on the pH adjustment and the metal content of the feed solutions overall concentrations ranging from: Dy, 1500 to 1700 ± 20 mg dm−3 and Nd, 6900 to 7800 ± 30 mg dm−3.
Experimental
Reagents and apparatus
Aqueous solutions (feed, raffinate, strip liquors) of metal contents were analyzed by using an inductively coupled plasma optical emission spectrometer (ICP OES) (Thermo Scientific, USA model iCAP 6000 Series). REs were determined by the following wavelengths: dysprosium = 353.170 nm and neodymium = 430.358 nm. Orion Star A215 pH/conductivity meter (Theromo Scientific, Singapore) was used for the study of pH measurements. A shaking incubator (model: SI-300/300R/600/600R) was used for solvent extraction, stripping, McCabe-Thiele plot,
Computers
Audio systems
Wind turbines
Automobiles
Household appliances
MRI 15 years
10 years 10 years
10 years
20 years 14 years
Audio systems
Wind turbines Automobiles
Household appliances
MRI Computers
}
}
Figure 1. Life spans of end-use products of electrical, electronic and medical devices (adapted from reference 1).
Computers
Audio systems
Wind turbines
Automobiles
Household appliances
MRI 15 years
10 years 10 years
10 years
20 years 14 years
Audio systems
Wind turbines Automobiles
Household appliances
MRI Computers
}
water washings, scrubbing, and stripping experiments. Counter current extraction (CCE) studies were carried out using a beaker and magnetic pellet at room temperature (25 °C) by using a magnetic stirrer (Daihan Scientific Co. Ltd., Korea Model: MSH-50D) and each batch generated 100 mL of the loaded organic (LO) phase.
Kerosene (boiling point: 180-270 °C, density: 0.80 kg m–3) was used as a diluent for the present study
system. Other chemicals such as sulfuric acid and nitric acid (Junsei Chemicals Co. Ltd., Japan) and hydrochloric acid (Oriental Chemical Industries, Korea) were also utilized. The present study utilized the organo-phosphorus extractant D2EHPA supplied by Sinochem Limited, China.
Solid scrap was treated with several steps (Figure 2) then finally, acidic leach liquor of dysprosium and neodymium metals from permanent magnet scrap leach liquor was generated.
Analytical procedure
10 mL aliquots of the aqueous phase and organic phase solutions were used for the preliminary extraction experiments except phase ratio, McCabe-Thiele plots and CCE experiments. After shaking aqueous and organic phase solutions for 5 min for extraction and 30 min for stripping. The experiments were carried out in a glass stoppered separating funnel using a shaking incubator (at 25 ± 1 ºC temperature and 250 rpm speed of shaker). After extraction, scrubbing or stripping, the phases were allowed to settle, then two phases were separated for metal content analysis. Dysprosium and neodymium in the aqueous phases were determined by sensitive analytical technique, i.e., ICP OES. The distribution ratios of the metal from aqueous to the organic phase for extraction experiments and the reverse for the water washings of the LO or scrubbing or stripping experiments were determined on the basis of the mass balance. The distribution ratio (D) of the metals was defined as the ratio of the concentration of a metal ion in the organic
and aqueous phase (D = metal in organic phase/metal in the aqueous phase). Whereas, in water washings of the LO or scrubbing or stripping process, the metal distribution was reversed, i.e., metals travels from the loaded organic phase to the aqueous phase. The overall agreement between the distribution ratio values obtained was within 5% of the present study.
Results and Discussion
Effect of time
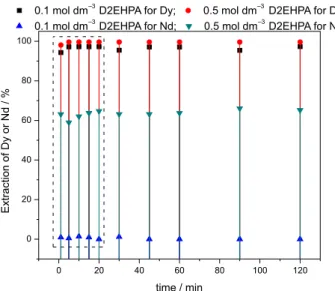
Kinetic study plays a key role in liquid-liquid extraction and stripping process of the metal ions. The kinetics of extraction or the stripping process will depend on the chemical reaction between the metal and extractant system, the surface areas and the rates of diffusion of the species on the surface of the liquids. Based on this fact, the first experiment studied in the present study is the effect of time on dysprosium and neodymium extraction and separation using the D2EHPA (diluted in kerosene) as an extractant. Two different initial pH conditions, 4.04 and 4.80 ± 0.10, were tested using extractant concentration of 0.1 and 0.5 mol dm−3 with phase ratio one at temperature 25 ± 1 °C. In the case of dysprosium, for the extraction (from aqueous to organic phase) of Dy was almost constant between 5 to 20 min, indicating that 5 min is more than enough to reach maximum extraction equilibrium (Figure 3). Whereas, the other metal neodymium requires 10 to 20 min of contact time with the higher concentration of the extractant (0.5 mol dm−3 D2EHPA). The extraction time was fixed
Figure 2. Flow sheet of the pretreatment procedure of permanent magnet scraps (PMS) to generate the leach liquor.
0 20 40 60 80 100 120
0 20 40 60 80 100
Extraction
o
f
D
y
o
r
N
d
/
%
time / min
0.1 mol dm–3D2EHPA for Dy; 0.5 mol dm–3D2EHPA for Dy 0.1 mol dm–3D2EHPA for Nd; 0.5 mol dm–3D2EHPA for Nd
Figure 3. Influence of time on extraction of dysprosium and neodymium using D2EHPA-kerosene as an extractant system. [By 0.1 mol dm−3
D2EHPA: initial pH is 4.80 (Dy, 1405 mg dm−3 and Nd, 6468 mg dm−3)
and about 0.5 mol dm−3 D2EHPA: initial pH is 4.04 (Dy, 1462 mg dm−3
and Nd, 6589 mg dm−3)].
0 20 40 60 80 100 120
0 20 40 60 80 100
Extraction
o
f
D
y
o
r
N
d
/
%
time / min
0.1 mol dm–3D2EHPA for Dy; 0.5 mol dm–3D2EHPA for Dy
at 5 min for further experiments because the entire work is going to be using 0.1 mol dm−3 extractant concentration and other possibilities of separation will increase with this optimum time condition.
Effect of pH and extractant concentration
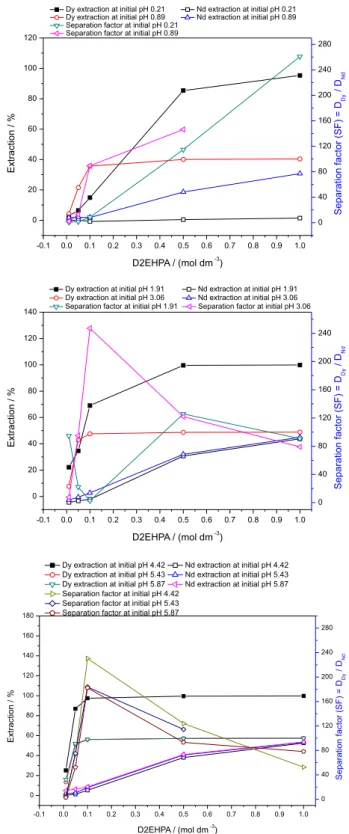
Extractants were liberating the hydrogen ions at the time of extraction processing of the metal from an aqueous phase to an organic phase. At a certain time, the process reaches equilibrium, and hydrogen ions released from this equilibrium can have influence on the metal extraction. Hence, the extraction system aqueous solutions, and the initial and equilibrium pH are therefore fundamentally significant in the separation and recovery process development of the metal ions. In this study of development of recovery method, the initial pH conditions varied from 0.21 to 5.87 ± 0.1. Extractant concentration ranged from 0.01 to 1.0 mol dm−3 and the phase ratio A/O was one at temperature 25 ± 1 °C. The feed aqueous solutions had the metal contents: Dy, 1562 to 1720 mg dm−3 and Nd, 6953 to 7830 mg dm−3. The variation of the metal concentration depending on pH adjustment; therefore the initial pH condition of the solution was measured for each experiment.
The acquired results are presented in Figure 4. A clear separation between the two phases was found over the entire pH study range. The general trend shows that increasing the extractant concentration led to the increase in percentage of metal ions extracted. At the lowest initial pH of 0.21 with 0.5 mol dm−3 D2EHPA was able to extract ca. 85% of Dy with ca. 5% of Nd and at initial pH 0.89 with 0.1 mol dm−3 D2EHPA was able to extract ca. 89% Dy with ca. 8% Nd.
In the pH range between 1.91 to 5.87, 0.1 mol dm−3 D2EHPA extracted ca. 70 to 98% of Dy and 13 to 20% of Nd. Particularly, the initial pH 1.91 is a condition much more favorable for Nd extraction (ca. 81% extracted). The pH study concluded that, for the separation of Dy and Nd metals, at 0.1 mol dm−3 extractant concentration, initial pH around 3.00 (equilibrium pH 1.5) is the optimal condition for the title metal ions extraction and possible separation.
Extraction mechanism
The present study utilized organo-phosphorus extractant, i.e., D2EHPA that is an acidic type extractant.14
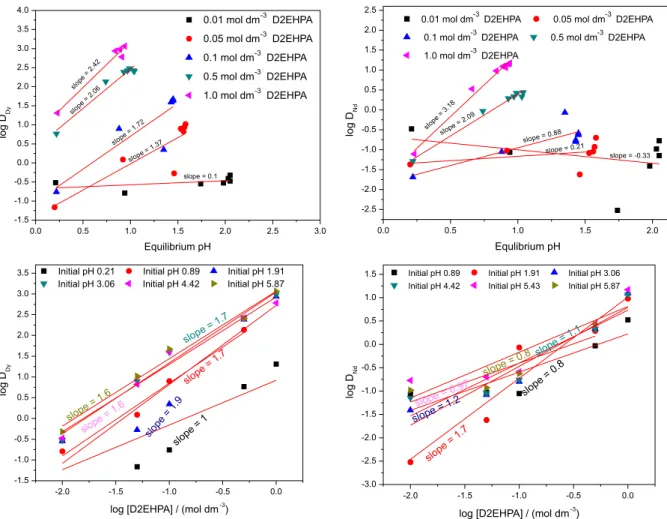
The present extraction systems of dysprosium and neodymium from chloride media follow an ion exchange mechanism; it is supported by the slope analysis method, where the slope of the plots of the logarithmic distribution ratio of the Dy or Nd versus equilibrium pH relates to
the number of hydrogen ions involved in the exchange reaction. The plots at different extractant concentrations are shown in Figure 5. The obtained experimental results calculated from the data show that the D2EHPA extractant system, one to two moles of the hydrogen ions and
-0.1 0.0 0.1 0.2 0.3 0.4 0.5 0.6 0.7 0.8 0.9 1.0 0 20 40 60 80 100 120
Dy extraction at initial pH 0.21 Nd extraction at initial pH 0.21 Dy extraction at initial pH 0.89 Nd extraction at initial pH 0.89 Separation factor at initial pH 0.21
Separation factor at initial pH 0.89
D2EHPA / (mol dm-3)
Extraction / % 0 40 80 120 160 200 240 280 S e p a ra ti o n facto r (SF ) = DD y / DN d
-0.1 0.0 0.1 0.2 0.3 0.4 0.5 0.6 0.7 0.8 0.9 1.0 0 20 40 60 80 100 120 140
Dy extraction at initial pH 1.91 Nd extraction at initial pH 1.91 Dy extraction at initial pH 3.06 Nd extraction at initial pH 3.06 Separation factor at initial pH 1.91 Separation factor at initial pH 3.06
D2EHPA / (mol dm-3)
Extraction / % 0 40 80 120 160 200 240 S e p a ra ti o n facto r (SF ) = DD y / DN d
-0.1 0.0 0.1 0.2 0.3 0.4 0.5 0.6 0.7 0.8 0.9 1.0
0 20 40 60 80 100 120 140 160 180
Dy extraction at initial pH 4.42 Nd extraction at initial pH 4.42 Dy extraction at initial pH 5.43 Nd extraction at initial pH 5.43 Dy extraction at initial pH 5.87 Nd extraction at initial pH 5.87 Separation factor at initial pH 4.42
Separation factor at initial pH 5.43 Separation factor at initial pH 5.87
D2EHPA / (mol dm-3)
E x tr a c ti o n / % 0 40 80 120 160 200 240 280 S e p a ra ti o n fa c to r (S F ) = DD y / DN d
Figure 4. Effect of pH and extractant concentrations on extraction of dysprosium and neodymium and separation factors between the metals using D2EHPA-kerosene as an extractant system.
-0.1 0.0 0.1 0.2 0.3 0.4 0.5 0.6 0.7 0.8 0.9 1.0
0 20 40 60 80 100 120
Dy extraction at initial pH 0.21 Nd extraction at initial pH 0.21
Dy extraction at initial pH 0.89 Nd extraction at initial pH 0.89
Separation factor at initial pH 0.21 Separation factor at initial pH 0.89
D2EHPA / (mol dm-3)
Extraction / % 0 40 80 120 160 200 240 280 S e p a ra ti o n facto r (SF ) = DD y / DN d
-0.1 0.0 0.1 0.2 0.3 0.4 0.5 0.6 0.7 0.8 0.9 1.0
0 20 40 60 80 100 120 140
Dy extraction at initial pH 1.91 Nd extraction at initial pH 1.91
Dy extraction at initial pH 3.06 Nd extraction at initial pH 3.06
Separation factor at initial pH 1.91 Separation factor at initial pH 3.06
D2EHPA / (mol dm-3)
Extraction / % 0 40 80 120 160 200 240 S e p a ra ti o n facto r (SF ) = DD y / DN d
-0.1 0.0 0.1 0.2 0.3 0.4 0.5 0.6 0.7 0.8 0.9 1.0
0 20 40 60 80 100 120 140 160 180
Dy extraction at initial pH 4.42 Nd extraction at initial pH 4.42
Dy extraction at initial pH 5.43 Nd extraction at initial pH 5.43
Dy extraction at initial pH 5.87 Nd extraction at initial pH 5.87
Separation factor at initial pH 4.42 Separation factor at initial pH 5.43 Separation factor at initial pH 5.87
D2EHPA / (mol dm-3)
extractant are associated with dysprosium and neodymium extraction processing.
Mn+
(aq) + n(HA)2 (org) MAn (HA)n(org) + n H +
(aq)
where, M = Dy or Nd, (HA)2 = D2EHPA, n = 1, 2, 3, …, n,
(aq) = aqueous phase, (org) = organic phase
Discussion on separation factors between dysprosium and neodymium
The separation factor will give a primary indication of possible separation between principal metal from other metal ions. The following formula was applied to get the separation factors data: separation factor (SF) = distribution ratio of Dy (DDy)/distribution ratio of Nd (DNd). The
calculated separation factors show that, at 0.1 mol dm−3 D2EHPA, the highest possible separation factor is at lower pH (0.2 to 1.00) conditions. With this condition, complete extraction of Dy metal ion requires more number of extraction stages. When more number of extraction stages are carried out, it will consume more
extractant and diluent in a continuous extraction system, causing expenditure. Based on these considerations, better extraction efficiency with moderate separation factors will occur with 0.1 mol dm−3 D2EHPA at initial pH around 3.00 (equilibrium pH is around 1.5). The SF between Dy and Nd with 0.1 mol dm−3 D2EHPA at initial pH 3.06 is ca. 247.2.
Phase ratio influence
Plentiful phase ratios from 0.2 to 10 (O/A) were subject to the increasing percentage of extraction of dysprosium with an increase in the phase ratio. The SF between Dy and Nd, were calculated at O/A= 1.5, where SF = 410 for D2EHPA (Figure 6). So, it was concluded that, the 1.5 phase ratio is preferred for separating the title metals, with good extraction capability of the individual extractant system.
Maximum loading capacity of the 0.1 mol dm−3 D2EHPA
The maximum loading capacity of 0.1 mol dm−3 D2EHPA was subjected to contact with the extractant a number of times with fresh feed solution. The experimental
0.0 0.5 1.0 1.5 2.0 2.5 3.0
-1.5 -1.0 -0.5 0.0 0.5 1.0 1.5 2.0 2.5 3.0 3.5 4.0
slop
e=
2.42
slop e=
2.06
slope
=1.
72
slope
= 1.37
0.01 mol dm-3 D2EHPA 0.05 mol dm-3 D2EHPA 0.1 mol dm-3 D2EHPA 0.5 mol dm-3 D2EHPA 1.0 mol dm-3 D2EHPA
lo
g
DD
y
Equilibrium pH
slope = 0.1
0.0 0.5 1.0 1.5 2.0
-2.5 -2.0 -1.5 -1.0 -0.5 0.0 0.5 1.0 1.5 2.0 2.5
slop
e=
3.18
slope = 2.09
slope =0.21
slope= 0.8 8
0.01 mol dm-3D2EHPA 0.05 mol dm-3D2EHPA
0.1 mol dm-3D2EHPA 0.5 mol dm-3D2EHPA
1.0 mol dm-3D2EHPA
lo
g
DN
d
Equlibrium pH
slope = -0.33
-2.0 -1.5 -1.0 -0.5 0.0
-1.5 -1.0 -0.5 0.0 0.5 1.0 1.5 2.0 2.5 3.0 3.5
slope = 1.6
slope = 1.6
slope = 1.7
slop
e=
1.9
slope
=1.7
Initial pH 0.21 Initial pH 0.89 Initial pH 1.91
Initial pH 3.06 Initial pH 4.42 Initial pH 5.87
lo
g
DD
y
log [D2EHPA] / (mol dm-3)
slope =1
-2.0 -1.5 -1.0 -0.5 0.0
-3.0 -2.5 -2.0 -1.5 -1.0 -0.5 0.0 0.5 1.0 1.5
slope = 0.8
slope = 0.97
slope = 1.1
slope = 1.2
slope =1.
7
Initial pH 0.89 Initial pH 1.91 Initial pH 3.06 Initial pH 4.42 Initial pH 5.43 Initial pH 5.87
lo
g
DN
d
log [D2EHPA] / (mol dm-3)
slope =0.
8
Figure 5. Logarithmic values of equilibrium pH or extractant (D2EHPA) concentration versus logarithmic values of distribution ratios (log D) on extraction of dysprosium and neodymium using D2EHPA-kerosene as an extractant system.
0.0 0.5 1.0 1.5 2.0 2.5 3.0
-1.5 -1.0 -0.5 0.0 0.5 1.0 1.5 2.0 2.5 3.0 3.5 4.0
slop e=
2.42
slop e=
2.06
slope =1.
72
slope = 1.37
0.01 mol dm-3 D2EHPA
0.05 mol dm-3 D2EHPA
0.1 mol dm-3 D2EHPA
0.5 mol dm-3 D2EHPA
1.0 mol dm-3 D2EHPA
lo
g
DD
y
Equilibrium pH slope = 0.1
0.0 0.5 1.0 1.5 2.0
-2.5 -2.0 -1.5 -1.0 -0.5 0.0 0.5 1.0 1.5 2.0 2.5
slop e=
3.18
slope = 2.09
slope =0.21
slope= 0.8 8
0.01 mol dm-3D2EHPA 0.05 mol dm-3D2EHPA
0.1 mol dm-3D2EHPA 0.5 mol dm-3D2EHPA
1.0 mol dm-3D2EHPA
lo
g
DN
d
Equlibrium pH
slope = -0.33
-2.0 -1.5 -1.0 -0.5 0.0
-1.5 -1.0 -0.5 0.0 0.5 1.0 1.5 2.0 2.5 3.0 3.5
slope = 1.6
slope = 1.6
slope = 1.7
slop e=
1.9 slope
=1.7
Initial pH 0.21 Initial pH 0.89 Initial pH 1.91 Initial pH 3.06 Initial pH 4.42 Initial pH 5.87
lo
g
DD
y
log [D2EHPA] / (mol dm-3) slope
=1
-2.0 -1.5 -1.0 -0.5 0.0
-3.0 -2.5 -2.0 -1.5 -1.0 -0.5 0.0 0.5 1.0 1.5
slope = 0.8
slope = 0.97
slope = 1.1
slope = 1.2
slope =1.
7
Initial pH 0.89 Initial pH 1.91 Initial pH 3.06 Initial pH 4.42 Initial pH 5.43 Initial pH 5.87
lo
g
DN
d
log [D2EHPA] / (mol dm-3) slope
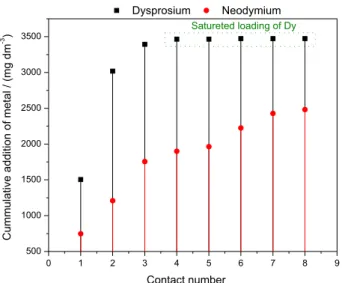
conditions are as follows: the aqueous feed was adjusted to pH 3.06 and each extraction time was 5 min with phase ratio one at 25 °C temperature. The obtained data (Figure 7) showed that, for D2EHPA extractant, four contacts were needed in order to achieve a saturation loading of Dy, and eight contacts for Nd. The D2EHPA-kerosene system, maximum load was 3473 mg dm−3 Dy and 2481 mg dm−3 Nd.
McCabe-Thiele diagrams for extraction isotherms of dysprosium using D2EHPA
McCabe-Thiele diagrams will set the information about the number of extraction stages required for targeted metal ions complete extraction with as maximum as separation of other associated elements by theoretically. Further, these studies will be confirmed with the CCE processing.15
In the present study, the feed solutions was composed of dysprosium, 1539 mg dm−3, and neodimium, 6912 mg dm−3 metal ion concentrations. The present study tested with 0.1 mol dm−3 D2EHPA dissolved in kerosene and other experimental parameters such as extraction equilibrium time 5 min, initial pH of feed solution 3.0 ± 0.2 and maintained equilibrium pH 1.5 ± 0.2 at temperature 25 °C. The obtained experimental results are presented in Figure 8.
The results indicate that to extract almost completely dysprosium metal at A/O phase ratio of 1, two extraction stages are required, and at A/O ratios of 1.5 and 2.0 require three and four extraction stages, respectively.
Counter current extraction of dysprosium and neodymium by using 0.1 mol dm−3 D2EHPA
CCE of metal ions is a fundamental process in industrial solvent extraction processing.16 Considering this, D2EHPA
was tested for CCE capabilities as well as to provide the LO. Based on the McCabe-Thiele extraction isotherm data from Figure 8, the LO was generated at 1.0 and 1.5 A/O phase ratios by using 0.1 mol dm−3 D2EHPA-kerosene system.
Two stages of CCE process was carried out with A/O 1 for 0.1 mol dm−3 D2EHPA at room temperature (25 °C) using beaker and magnetic stirrer. After two continuous extraction stages, LO is generated and found 1602 mg dm−3 Dy and 1803 mg dm−3 Nd. It is given the impression that if A/O increases more, Dy metal can load instead of Nd. Based on this assumption, phase ratio (A/O) increases to 1.5 and carried out the CCE process.
The three stages of CCE process for 0.1 mol dm−3 D2EHPA was tested and after three continuous counter current extraction stages the loaded organic generated had
0 1 2 3 4 5 6 7 8 9 10
0 20 40 60 80 100 120 140 160 180 200 220 240
Phase ratio (organic phase/aqueous phase) Incresing trend
DDy = Dysprosium in organic phase / Dysprosium in aqueous phase DNd = Neodymium in organic phase / Neodymium in aqueous phase SF D is tr ib u ti o n ra ti o o f D y (or) N d 0 100 200 300 400 S e p a ra ti o n facto r (SF ) = DD y / DN d
Figure 6. Phase ratio impact on dysprosium and neodymium distribution ratios and separation factors using 0.1 mol dm−3 D2EHPA at initial
pH 3.06.
0 1 2 3 4 5 6 7 8 9
500 1000 1500 2000 2500 3000 3500
Satureted loading of Dy
Dysprosium Neodymium Contact number C u m m u la ti v e a d d it io n o f m e ta l / (m g d m -3 )
Figure 7. Maximum loading capacity of 0.1 mol dm−3 D2EHPA for
dysprosium and neodymium at initial pH of 3.06.
0 200 400 600 800 1000 1200 1400 1600
0 200 400 600 800 1000 1200 1400 1600 1800 2000 2200 2400 2600 2800 3000 3200 3400 Oper ating line (aq: org) =2.
0: 1 .0
St 3 & St 4 St 2 St 1 St 3 St 2 St 1 Opera tingline (aq:or g)= 1
.5: 1 .0
St 2
[Dysprosium
]org
/
(mg
d
m
-3 )
[Dysprosium]aq/ (mg dm-3)
F eed: D y = 1539 m g dm -3 St 1 Operatin g line (a
q:org) = 1:1
Figure 8. McCabe-Thiele diagram for extraction isotherm of dysprosium using 0.1 mol dm−3 D2EHPA-kerosene system.
0 1 2 3 4 5 6 7 8 9 10
0 20 40 60 80 100 120 140 160 180 200 220 240
Phase ratio (organic phase/aqueous phase)
Incresing trend
DDy = Dysprosium in organic phase / Dysprosium in aqueous phase DNd = Neodymium in organic phase / Neodymium in aqueous phase SF D is tr ib u ti o n ra ti o o f D y (or) N d 0 100 200 300 400 S e p a ra ti o n facto r (SF ) = DD y / DN d
0 1 2 3 4 5 6 7 8 9
500 1000 1500 2000 2500 3000 3500
Satureted loading of Dy
Dysprosium Neodymium Contact number C u m m u la ti v e a d d it io n o f m e ta l / (m g d m -3 )
0 200 400 600 800 1000 1200 1400 1600
0 200 400 600 800 1000 1200 1400 1600 1800 2000 2200 2400 2600 2800 3000 3200 3400 Oper ating line (aq: org) =2.
0: 1 .0
St 3 & St 4
St 2 St 1 St 3 St 2 St 1 Opera tingline (aq:or g)= 1
.5: 1 .0
St 2
[Dysprosium
]org
/
(mg
d
m
-3 )
[Dysprosium]aq/ (mg dm-3)
F eed: D y = 1539 m g dm -3 St 1 Operatin g line (a
the metal ion concentration 2.328 g L−1 of dysprosium and 2.559 g L−1 of neodymium. The raffinate solutions had negligible amount of dysprosium (0.012 g L−1) and 5.267 g L−1 neodymium.
Loaded organic phase was further treated by water washing to remove any weakly bounded impurities before the scrubbing process. The present LO from the 0.1 mol dm−3 D2EHPA of the phase ratio 1.5 was washed with double distilled water. It was found that there was no Dy in the water washing raffinates, whereas a very insignificant amount of Nd (below 1.5 mg dm−3) was washed out.
Scrubbing process
The removal of co-extracted metal ions from the loaded organic phase is known as the ‘scrubbing process’. The present LO in 0.1 mol dm−3 of D2EHPA after water washing was treated with aqueous solutions with different pH of water acidified with dilute hydrochloric acid and found that pH 1.6 water solutions are optimum for the maximum removal of co-extracted Nd metal. The 1.5 phase ratio generated LO’s treated with water solution pH 1.6 ± 0.1, for D2EHPA up to 122.3 mg dm−3 of Nd, was able to be removed with very little (ca. 1 mg dm−3) Dy loss.
Stripping studies
After the water washing and scrubbing process, the LO phases were treated by the stripping process (back extraction of the metal from the organic phase to the aqueous phase). From the 1:1 phase ratio LO of 0.1 mol dm−3 of D2EHPA was tested with 0.1 mol dm−3 hydrochloric acid solution with the variation of time 1 to 120 min (Figure 9). The attained experimental results clearly demonstrate that 90 min is a suitable condition for as much as Nd stripping (1102 mg dm−3) with the loss of ca. 25.4 mg dm−3 Dy. Then, after Nd recovery in 2nd round of stripping, Dy can be stripped from LO within 15 to 20 min of stripping time. This study gave prime indication of selective stripping of Nd from LO and it is a good sign for Dy and Nd selective separation.
The selective stripping process was put in place to the LO of D2EHPA generated from 1.5:1.0 A/O ratio using 0.1 mol dm−3 of hydrochloric acid. Based on the above stripping kinetics results, in the first contact, 1173 mg dm−3 of Nd was stripped and in the concurrent second contact, 111 mg dm−3 of Nd was stripped from the LO with 92 mg dm−3 Dy losses. The remaining LO containing 2236 mg dm−3 of Dy and 1152 mg dm−3 of Nd was used for further Dy recovery studies.
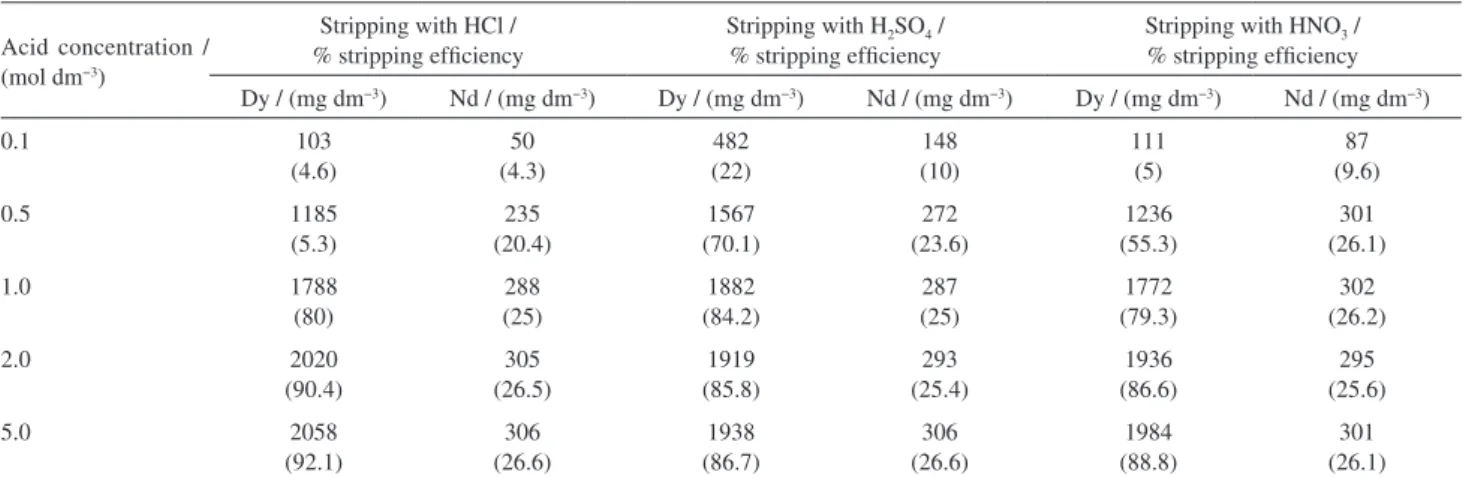
LO of D2EHPA (generated from A/O 1.5) was further treated by the stripping process for Dy recovery utilizing hydrochloric, sulfuric and nitric acids after water washing, scrubbing and selective stripping. Established conditions are as follows: stripping time 15 min and stripping phase ratio (LO/A) 1:1 at 25 °C. The results are shown in Table 1.
Based on the obtained stripping results, HCl is the best selective stripping reagent at high concentrations (2 and 5 mol dm−3) but lower acidic concentrations ranging from 0.1 to 1.0 mol dm−3 sulfuric acid is able to strip 70 to 84% Dy, while 272 to 306 mg dm−3 of Nd was co-stripped with Dy. The detailed distribution ratio’s and separation factors for selective stripping process are presented in Figure 10 and the obtained data has given indication that the order of the best striping reagent was as follows: HCl > HNO3 > H2SO4.
The summary and comparisons was made in between two types of phase ratios, i.e., 1.0 and 1.5 (A/O) for dysprosium and neodymium recovery process. Phase ratio (A/O) 1.0 to 1.5 metals loading was increased and it reached 2.328 g L−1 of dysprosium and 2.559 g L−1 of neodymium. The metals recovery process established the selective stripping process stripped up to 55% neodymium, after that, 85 to 90% of dysprosium was stripped by single stage stripping with any 2.0 mol dm−3 mineral acid (hydrochloric or sulfuric or nitric acids). The following remarks are noted from the present study: (i) feed having ca. 1564 mg dm−3 Dy, ca. 7214 mg dm−3 Nd; (ii) after 3 stages of CCE process, LO having 2328 mg dm−3 of Dy and 2559 mg dm−3 Nd; (iii) selective stripping process can strip 1173 + 111 = 1284 mg dm−3 of Nd with the loss of 92 mg dm−3 Dy; (iv) up to 2058 mg dm−3 Dy recovered with ca. 306 mg dm−3 Nd; (v) the present method is able to recover up to 88% of Dy.
0 20 40 60 80 100 120
0 200 400 600 800 1000 1200
Consistent trend for Dy
Decresing trend for Nd Consistent trend for Nd
Incresing trend for Nd
S
tr
ip
p
e
d
so
lu
ti
o
n
/
(m
g
d
m
-3 )
time / min Dy Nd
Figure 9. Effect of time on stripping process of 0.1 mol dm−3 D2EHPA
LO generated from two stage CCE process at A/O = 1 with 0.1 mol dm−3
hydrochloric acid as stripping reagent.
0 20 40 60 80 100 120
0 200 400 600 800 1000 1200
Consistent trend for Dy
Decresing trend for Nd Consistent trend for Nd
Incresing trend for Nd
S
tr
ip
p
e
d
so
lu
ti
o
n
/
(m
g
d
m
-3 )
time / min
The present developed chemical process will prevent environmental pollution as well as avoiding the depletion of resources for REs. At the same time, recycling of the PMSs and recovery of the REs, like Dy and Nd metals, will partially reach the Korean national demand. The total scientific approach causes the execution of reduce, recycle and reuse (R3) policy.
Conclusions
The following conclusions can be made concerning the extraction, separation and selective stripping process of dysprosium and neodymium from permanent magnet scraps leach liquors. The first experiment concludes that 5 min is required for complete extraction and initial pH around 3.00 ± 0.3 (equilibrium pH 1.5 ± 0.1) is the most suitable for best extraction as well as maximum separation of dysprosium and neodymium using 0.1 mol dm−3 D2EHPA.
Both metals, dysprosium and neodymium, follow the ion-exchange extraction mechanism. The best separation factors between dysprosium and neodymium by using 0.1 mol dm−3 D2EHPA is ca. 247.2 and at 1:1 phase ratio, whereas at 1.5:1.0 A/O ratio, SF = 410. Maximum loading capacity studies showed that D2EHPA can load 3.473 g L−1 dysprosium and 2.481 g L−1 neodymium. Finally, 0.1 mol dm−3 hydrochloric acid will selectively strip the ca. 55% of neodymium; further stripping studies showed that any of the mineral acids at about 2.0 mol dm−3 were suitable for dysprosium recovery (up to 88%).
Future studies will focus on improvement of selective stripping rate up to 99% of neodymium as well as up to 99% of dysprosium in single stage stripping process.
Acknowledgments
This study was supported by the R&D Center for Valuable Recycling (Global-Top Environmental Technology Development Program) funded by the Ministry of Environment, Korea (Project No. 11-A10-MR) and authors express sincere gratitude to the authorities of the R&D Center for Valuable Recycling Center & KIGAM.
References
1. Gupta, C. K.; Krishnamurthy, N.; Extractive Metallurgy of Rare Earths, 1st ed.; CRC Press: Boca Raton, 2004.
2. Unites States Environmental Protection Agency (US EPA); Rare Earth Elements: A Review of Production, Processing, Recycling
and Associated Environmental Issues; Office of Research and
Development: Cincinnati, December, 2012. 3. Du, X.; Graedel, T. E.; J. Ind. Ecol.2011, 15, 836.
4. Anitha, M.; Kotekar, M. K.; Singh, D. K.; Vijayalakshmi, R.; Table 1. Results of stripping studies (back extraction of the metal from the loaded organic phase) or recovery studies with mineral acids
Acid concentration / (mol dm−3)
Stripping with HCl / % stripping efficiency
Stripping with H2SO4 / % stripping efficiency
Stripping with HNO3 / % stripping efficiency
Dy / (mg dm−3) Nd / (mg dm−3) Dy / (mg dm−3) Nd / (mg dm−3) Dy / (mg dm−3) Nd / (mg dm−3)
0.1 103 (4.6) 50 (4.3) 482 (22) 148 (10) 111 (5) 87 (9.6) 0.5 1185 (5.3) 235 (20.4) 1567 (70.1) 272 (23.6) 1236 (55.3) 301 (26.1) 1.0 1788 (80) 288 (25) 1882 (84.2) 287 (25) 1772 (79.3) 302 (26.2) 2.0 2020 (90.4) 305 (26.5) 1919 (85.8) 293 (25.4) 1936 (86.6) 295 (25.6) 5.0 2058 (92.1) 306 (26.6) 1938 (86.7) 306 (26.6) 1984 (88.8) 301 (26.1)
LO of D2EHPA generated from 1.5:1.0 phase ratio (A/O ratio) (after pretreatments like water washing, scrubbing followed by selective stripping of Nd and LO contains 2236 mg dm−3 Dy and 1152 mg dm−3 Nd); the values within the brackets represent the % of stripping efficiency.
0 1 2 3 4 5 6
0 2 4 6 8 10 12 14 D is tr ib u ti o n o f me ta ls in st ri p p in g p ro c e s s ( Ds ) = M e ta l in strip s o lu ti o n / Me ta l in s p e n t o rg a n
ic Ds Dy with HCl Ds Nd with HCl
Ds Dy with H2SO4 Ds Nd with H2SO4
Ds Dy with HNO3 Ds Nd with HNO3
SF for HCl SF for H2SO4 SF for HNO3
Mineral acid (HCl or H2SO4or HNO3concentration / (mol dm-3
) 0 4 8 12 16 20 24 28 32 36 40 S e p a ra ti o n facto r fo r s tr ip p in g (S F s )= D sD y / D sN d
Figure 10. Stripping of dysprosium and neodymium by using mineral acids namely hydrochloric, sulfuric and nitric acids (stripping process of 0.1 mol dm−3 D2EHPA LO (1.5:1.0 A/O ratio) LO contains: 2236 mg dm−3
of Dy and 1152 mg dm−3 of Nd).
0 1 2 3 4 5 6
0 2 4 6 8 10 12 14 D is tr ib u ti o n o f me ta ls in st ri p p in g p ro c e s s ( Ds ) = M e ta l in strip s o lu ti o n / Me ta l in s p e n t o rg a n
ic Ds Dy with HCl Ds Nd with HCl
Ds Dy with H2SO4 Ds Nd with H2SO4 Ds Dy with HNO3 Ds Nd with HNO3 SF for HCl SF for H2SO4 SF for HNO3
Singh, H.; Hydrometallurgy2014, 146, 128.
5. Biju, V. M.; Gladis, J. M.; Rao, T. P.; Anal. Chim. Acta 2003,
478, 43.
6. Zielinski, S.; Szczepanik, A.; Hydrometallurgy1993, 33, 219. 7. Wannachod, T.; Leepipatpiboon, N.; Pancharoen, U.;
Nootong, K.; J. Ind. Eng. Chem. 2014, 20, 4152. 8. Pei, L.; Wang, L.; Yu, G.; J. Rare Earths2012, 30, 63. 9. Basualto, C.; Valenzuela, F.; Molina, L.; Munoz, J. P.;
Fuentesand, E.; Sapag, J.; J. Chil. Chem. Soc. 2013, 58, 1785. 10. Raju, B.; Jeon, H. S.; Lee, M. S.; Hydrometallurgy2012, 121,
74.
11. Sánchez, J. M.; Hidalgo, M.; Salvadó, V.; Valiente, M.; Solvent Extr. Ion Exch.1999, 17, 455.
12. Preston, J. S.; du Preez, A. C.; Cole, P. M.; Fox, M. H.;
Hydrometallurgy1996, 42, 131.
13. Lenz, T. G.; Smutz, M.; J. Inorg. Nucl. Chem.1968, 30, 621. 14. Douglas, S. F.; J. Organomet. Chem.2005, 690, 2426. 15. Lee, J. Y.; Kumar, J. R.; Liquid-Liquid Extraction of Tetravalent
Platinum, VDM Publishers: Saarbrücken, Germany, 2010.
16. Luis, L. J.; Diego, J.; Solvent Extr. Ion Exch.2001, 19, 659.
Submitted: February 6, 2015