A
rti
g
o
*e-mail: [email protected]
DETERMINATION OF TRIAMTERENE IN HUMAN PLASMA AND URINE AFTER ITS CLOUD POINT EXTRACTION
Ahad Bavili Tabrizia,b,*, Sana Nainic, Kosar Parnianc, Samin Mohammadic, Fayeze Emami zadc, Samira Pourtaghi Anvarianc
and Ali Abdollahib
aBiotechnology Research Center, Tabriz University of Medical Sciences, Tabriz, Iran
bDepartment of Medicinal Chemistry, Faculty of Pharmacy, Tabriz University of Medical Sciences, Tabriz, Iran cStudents’ Research Committee, Tabriz University of Medical Sciences, Tabriz, Iran
Recebido em 21/01/2014; aceito em 22/04/2014; publicado na web em 15/07/2014
A new analytical approach was developed involving cloud point extraction (CPE) and spectrofluorimetric determination of triamterene (TM) in biological fluids. A urine or plasma sample was prepared and adjusted to pH 7, then TM was quickly extracted using CPE, using 0.05% (w/v) of Triton X-114 as the extractant. The main factors that affected the extraction efficiency (the pH of the sample, the Triton X-114 concentration, the addition of salt, the extraction time and temperature, and the centrifugation time and speed) were studied and optimized. The method gave calibration curves for TM with good linearities and correlation coefficients (r) higher than 0.99. The method showed good precision and accuracy, with intra- and inter-assay precisions of less than 8.50% at all concentrations. Standard addition recovery tests were carried out, and the recoveries ranged from 94.7% to 114%. The limits of detection and quantification were 3.90 and 11.7 µg L−1, respectively, for urine and 5.80 and 18.0 µg L−1, respectively, for plasma. The newly developed, environmentally friendly method was successfully used to extract and determine TM in human urine samples. Keywords: cloud point extraction; triamterene; biological fluids; spectrofluorimetry.
INTRODUCTION
6-Phenyl-2,4,7-pteridinotriamine (triamterene; TM) is a mild diuretic that belongs to the potassium-sparing family of diuretics and acts directly on distal tubular cells to decrease the release of potassium ions and, as a result, avoid the reabsorption of chloride ions. By itself, TM is a relatively inefficient hypertensive, so it is usually used with another, more potent diuretic (e.g., a thiazide or anthranilic acid derivative). This gives a synergistic effect in which the diuretic and hypotensive actions of the two components are mutually enhanced.1 Using a potassium-sparing diuretic and an angiotensin II receptor blocker may increase the risk of severe hyperkalemia. This is most important for patients with diabetes, heart failure, dehydra-tion, or renal insufficiency, or patients taking more than 25 mg d−1 of spironolactone, because these patients may have an increased risk of developing severe hyperkalemia.2 Determining TM in biological fluids is necessary to gather enough information to diagnose hyperkalemia. After oral administration, TM is absorbed at a rate of about 80%, and it is metabolized by hydroxylation followed immediately by conjugation, giving its main metabolite, hydroxyltriamterene sulfate (HTMS). HTMS is pharmacologically active, and therefore, contri-butes to the pharmacological profile of TA, so it is as important to determine HTMS as to determine TM.3 The concentration of HTMS is typically between four and 13 times higher than the concentration of TA in urine. The metabolism of TA takes place in the liver, so pa-tients with liver cirrhosis and ascites have impaired abilities to form and excrete HTMS, and the rate of excretion of unmetabolized TA is enhanced in such patients. It has been proposed that the HTMS/ TA ratio in plasma and urine can be used as a simple diagnostic test for hepatic function.4
Diuretics have, in recent times, been abused by sportspeople with two main objectives, to rapidly lower the bodyweight and to decrease the concentration of medical drugs in the urine by diluting
the urine (to make it difficult to detect doping substances in the urine). There are no medical reasons justifying the rapid loss of weight for participants of any sport, and, in fact, abusing drugs that are used to achieve rapid weight loss can pose serious health risks because of adverse secondary effects. Therefore, TM is included in the list of substances forbidden by the International Olympic Committee.5,6
Several methods have been reported for the determination of TM and its metabolites in biological fluids, including high perfor-mance liquid chromatography (HPLC),7-12 gas chromatography mass spectrometry (GC-MS),13 isopotential fluorometry,5 fluorescence spectrometry using solid supports,3 fluorimetry or spectrophotometry in combination with multivariate calibration methods,1,6,14 capillary zone electrophoresis (CZE) using fluorescence detection,4 and square--wave voltammetry.2 These are reliable methods for determining TM concentrations in biological fluids, but they are often time-consuming and technically demanding, and require the use of costly, highly specialized instruments such as HPLC, GC-MS, and CZE. Some of the methods involve sample pretreatment and lengthy extraction procedures before the analyte can finally be analyzed. These metho-ds, therefore, require large amounts of organic solvents, which are harmful to humans and the environment.
The principles, advantages, and applications of CPE have been the subjects of several review articles,16-19 and the analytical potential of CPE has been demonstrated in many studies of its use extracting and preconcentrating both organic15,20-29 and inorganic compounds.30-38 All of these studies have indicated that CPE has great potential for use as an effective extraction and enrichment method, but relati-vely few reports can be found of its use for extracting drugs from urine or plasma samples in clinical and biomedical studies.15,23-26 Furthermore, no reports of the CPE of TM from biological fluids have been published. Therefore, in this work, a CPE method combined with spectrofluorimetric detection was developed for extracting and determining TM in human urine samples. Spectrofluorimetry was the preferred detection system because it offers high selectivity and sensitivity, and is a relatively low cost and rapid detection method. The newly developed environmentally friendly analytical method was successfully used for extracting and determining TM in human urine. The proposed method offers several advantages over alternative methods, including its lack of hazards, simplicity, rapidity, and low cost, and it is particularly attractive if more sophisticated techniques, such as HPLC, GC-MS, or CZE, are not available.
EXPERIMENTAL
Apparatus
All fluorescence measurements were made using a Shimadzu RF-5301 PC spectrofluorophotometer (Shimadzu, Kyoto, Japan) equipped with a 150 W xenon lamp and a quartz micro-cell with a volume of 700 µL. The excitation and emission slits were both adjusted to 5 nm. A centrifuge (EBA 20, Andreas Hettich GmbH & Co. KG, Tuttlingen, Germany) with 15 mL calibrated centrifuge tubes (EM Techcolor; Hirschmann Laborgeräte GmbH & Co. KG, Eberstadt, Germany) was used to accelerate the phase separation pro-cess. A thermostated water bath (636; Friedberg/Hessen, Germany) was used throughout the work. A pH meter (model M120; Halstead, Essex, England) with a glass combined electrode was used to make pH measurements.
Materials
All reagents were of analytical reagent grade unless otherwise indicated. Chemicals, including ethanol (EtOH), methanol (MeOH), sodium chloride (NaCl), trichloroacetic acid, hydrochloric acid (HCl), sodium hydroxide (NaOH), sodium acetate trihydrate, acetic acid, and diammonium hydrogen phosphate were obtained from Merck (Darmstadt, Germany). Ammonium dihydrogen phosphate was purchased from Panreac (Barcelona, Spain).
The non-ionic surfactant Triton X-114 was obtained from Sigma (St. Louis, MO, USA) and was used without further purification. A 1% (v/v) solution of Triton X-114 was prepared by dissolving 1 mL of the reagent in 5 mL of EtOH and diluting that solution to 100 mL with deionized water. A stock solution of 400 µg mL−1 of TM was prepared by dissolving an appropriate amount of the pure drug (obtained from Sobhan, Rasht, Iran) in MeOH, and this solution was stored in the dark in a refrigerator when it was not in use. Working solutions were prepared daily by diluting this stock solution with ultrapure water.
The acetic acid/acetate buffer (1 mol L−1, pH 4.5) was prepared from sodium acetate trihydrate and acetic acid, and the phosphate buffer (1.0 mol L−1, pH 7) was prepared from diammonium hydrogen phosphate and ammonium dihydrogen phosphate. Solutions at the desired pH values were prepared by adding dilute solutions of HCl or NaOH to these stock buffer solutions. A 20% (w/v) solution of NaCl was also prepared.
The water used in the sample preparation procedures was deioni-zed and purified using a Milli-Q system (Advantage A 10; Millipore, France). The pipettes and vessels used for the trace analysis were soaked in dilute nitric acid overnight (or for longer) and were washed three times with distilled water before use.
Methods
Procedure for biological samples
Urine samples were obtained from a healthy male volunteer who took a single oral dose of a commercially available tablet (Irandaru) containing 50 mg TM and 25 mg hydrochlorothiazide (HCT). The urine samples were collected over specified time intervals (0–1, 1–2, 2–3, 3–4, 4–6, 6–10, 10–14, and 14–24 h) after the oral administration of the tablet, and the samples were stored at −4 °C until they were analyzed. The samples were centrifuged for 15 min at 4000 rpm (i.e., 0.8 kg dm−3). Afterwards, 0.5 mL of the clear supernatant was transferred to another centrifuge tube and the general procedure described below was followed. Blank urine was collected from the same volunteer directly before the tablet was administered.
Drug-free plasma samples were obtained from the Blood Transfusion Organization in Tabriz, Iran, and stored at −20 °C until they were analyzed. A frozen plasma sample was thawed at room temperature and a 3 mL aliquot was transferred into a 15 mL centri-fuge tube, then 3 mL of trichloroacetic acid (1 mol L−1) was added to the sample to precipitate the proteins. The contents of the tube were mixed and centrifuged for 10 min at 4000 rpm, then 0.5 mL of the clear supernatant was transferred to another centrifuge tube, and the general procedure described below was followed.
General procedure for calibration
A 0.5 mL aliquot of a prepared urine or plasma sample was placed in a 15 mL graduated centrifuge tube and spiked with TM, to give a concentration in the range 5–800 µg L−1 for urine or10–800 µg L−1 for plasma. The sample was then mixed with 0.5 mL of the phosphate buffer (1.0 mol L−1, pH 7.0), 1.25 mL of 20% (w/v) NaCl, and 0.5 mL of 1.0% (v/v) Triton X-114. The volume of the mixture was then made up to 10 mL with ultra-pure water, and the tube was placed in a thermostated bath at 40 °C for 10 min. The mixture was centrifuged for 5 min at 3800 rpm (0.76 kg dm−3) to completely se-parate the surfactant-rich (SR) phase from the dilute aqueous phase, and the supernatant aqueous phase was removed easily using a Pasteur pipette. The remaining SR phase was diluted to 700 µL with a 2:1 (v/v) mixture of EtOH and water, and the fluorescence intensity at 438 ± 3 nm was measured using an excitation wavelength of 370 ± 3 nm. RESULTS AND DISCUSSION
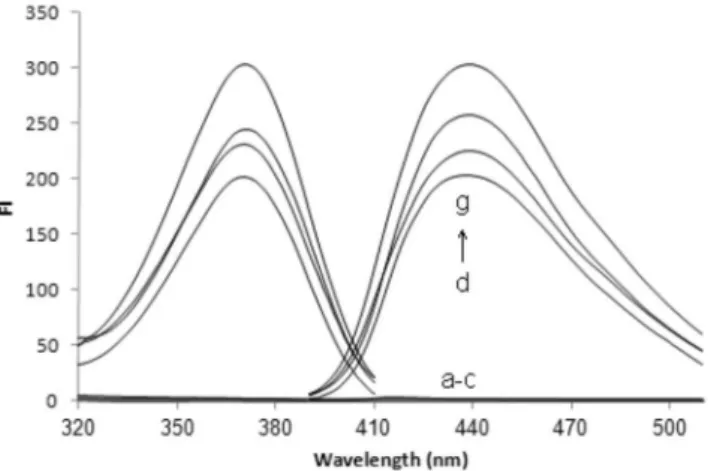
A method involving CPE combined with spectrofluorimetry was developed and optimized for determining TM in biological samples. The influences of different factors on the extraction conditions (the pH of the sample solution, the Triton X-114 concentration, the addition of salt, the extraction time and temperature, and the centrifugation time and speed) were studied and optimized so that a high extrac-tion efficiency could be achieved. Figure 1 shows the excitaextrac-tion and emission spectra for TM extracted from aqueous and biological samples using the optimized CPE conditions that were established. The excitation and emission maxima were found at 370 ± 3 and 438 ± 3 nm, respectively.
Effect of pH
because it affects the state of the analyte and its extraction efficiency. The effect of the sample pH on the extraction of TM was tested at pH values between 2 and 12. The solution was adjusted to pH 2 and pH 12 using dilute HCl and NaOH, respectively. The solution was adjusted to between pH 4 and 6 using acetate buffer and to between pH 7 and 10 using phosphate buffer. As is shown in Figure 2, the TM signal intensity increased as the pH was increased from 2.0 to 7.0, and then remained approximately constant at the maximum intensity at pH values of 7.0–8.0. The molecule must be in its neutral form for it to be adequately extracted by nonionic micelles in a CPE system. It seems that this was achieved for TM at pH values of 7.0–8.0, so the solutions in later tests were adjusted to pH 7.0 by adding 1.0 mol L−1 phosphate buffer. The analytical signal decreased at pH values higher than 8.0, although the mechanism that caused this is not clear.
Effect of the Triton X–114 concentration
The influence of the Triton X-114 concentration on the TM signal was examined by adding different volumes, between 0.25 and 1.5 mL, of 1% (v/v) Triton X-114. It can be seen from Figure 3 that the highest (and consistent) fluorescence intensities were found when 0.5–0.75 mL of Triton X-114 was used. Therefore, 0.5 mL of Triton
X-114 (corresponding to a final concentration of 0.05%) was selected as the optimum for use in later tests.
Effect of adding salt
The effect of adding salt on the analysis was determined by adding different amounts, from 0% to 10% (w/v), of NaCl while keeping the other experimental conditions constant. Increasing the ionic strength caused the TM signal to increase in size when the NaCl concentration was between 0% and 2.5%, and the signal gradually decreased in size as the salt concentration was increased further (see Figure 4). Therefore, a NaCl concentration of 2.5% (w/v) was selected as the optimum for the CPE procedure.
Effects of other experimental factors
It is necessary to use the optimal incubation time and equilibration temperature to allow the phases to be separated easily and to ensure the complete extraction of the analyte is achieved. Extractions were carried out at different temperatures (ranging from 25 to 60 °C) in a thermostated water bath, for periods ranging from 10 to 30 min. The strongest (and consistent) TM signals were obtained at 35-40 °C (see Figure 5) after 10 min. Using higher temperatures led to a slight decrease in the size of the analytical signal, which was probably caused by the instability of the target analyte at such temperatures. A centrifuge time of 5 min at a speed of 3800 rpm was found to be optimal to separate the phases.
Finally, the effect of the diluting agent used was studied by adding different solvents at different ratios to the SR phase. The results (shown in Figure 6) showed that using a 1:2 (v/v) mixture of water
Figure 1. Excitation and emission spectra for triamterene (TM) after cloud point extraction (CPE) of (a) a reagent blank, (b) a urine blank, (c) a plasma blank, (d) a plasma sample spiked with 450 µg L−1 TM, (e) a TM standard solution (450 µg L−1), (f) a urine sample from 10–14 h after TM was admi-nistered to a volunteer, and (g) the same sample (as described in f) spiked with 75 µg L−1 TM. Conditions: 0.5 mL of urine or plasma sample; 0.05 mol L−1 phosphate buffer (pH 7.0); 2.5% (w/v) NaCl; 0.05% (v/v) Triton X-114; 40 °C for 10 min; 5 min centrifugation at 3800 rpm; surfactant-rich phase diluted to 700 µL with a 2:1 (v/v) mixture of EtOH and water
Figure 2. The effect of the pH on the analytical signal for 300 µg L−1 TM. The conditions were the same as shown for Figure 1
Figure 3. The effect of the Triton X-114 concentration on the analytical sig-nal for 300 µg L−1 TM. The conditions were the same as shown for Figure 1
and EtOH gave the highest (and consistent) analytical signals, so this solvent mixture was used in the rest of the work presented here.
Calibration and validation
The linearity of the method was evaluated using 0.5 mL aliquots of urine and plasma samples spiked with different concentrations of TM, as specified in Table 1. The equations for the plots of fluorescence intensity (FI) against the TM concentration (C, in micrograms per liter) were FI = 0.5721 C − 12.62 (n = 6) and FI = 0.4894 C − 9.258 (n = 6) for the urine and plasma, respectively, and the linear regression coefficients (r) were 0.9986 and 0.9993, respectively. The limit of detection (LOD) and the limit of quan-tification (LOQ) were 3.90 and 11.7 µg L−1, respectively, for urine and 5.80 and 18.0 µg L−1, respectively, for plasma. The LOD and LOQ were defined as 3Sb/m and 10Sb/m, respectively, where Sb is the standard deviation of the blank measurements and m is the slope of the calibration line. The parameters for the proposed method are summarized in Table 1.
The precision of the method was determined by analyzing three samples on the same day (intra-day precision) and on different days (inter-day precision), and expressed as the relative standard deviation (RSD). The intra-day precision was lower than 5.60% and the inter--day precision was lower than 8.20%. The accuracy, expressed as the relative error (%), was always lower than 7.0% (13.4% at the LOQ). These results (summarized in Table 2), indicate that the method met the requirements of a bioassay and was suitable for our purposes.4,39,40
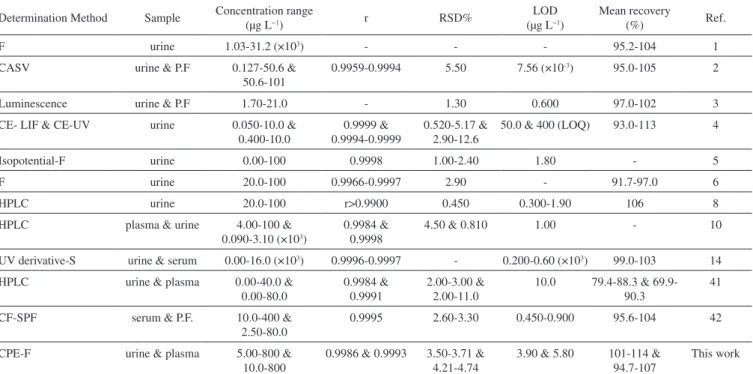
The performance of the proposed method was compared with the performances of other methods to highlight the advantages of the proposed method. The distinct features of the methods that were assessed are summarized in Table 1. Compared with methods in which CE or HPLC are used to determine the target analyte,4,8,10,41 the proposed method does not require high levels of financial in-vestment or involve high instrument maintenance costs. It is also evident that the precision and recoveries achieved using the proposed method are comparable to those achieved using other methods. The other significant feature of the proposed method is that it has a re-latively large dynamic linear range compared to the ranges of other methods.
Figure 5. The effect of the equilibration temperature on the analytical signal for 300 µg L−1 TM. The conditions were the same as shown for Figure 1
Figure 6. The effect of the diluting solvent on the analytical signal for
300 µg L−1 TM. The conditions were the same as shown for Figure 1.
(W = water)
Table 1. Analytical characteristics of different methods used to determine triamterene
Determination Method Sample Concentration range
(µg L−1) r RSD%
LOD (µg L−1)
Mean recovery
(%) Ref.
F urine 1.03-31.2 (×103) - - - 95.2-104 1
CASV urine & P.F 0.127-50.6 & 50.6-101
0.9959-0.9994 5.50 7.56 (×10-3) 95.0-105 2
Luminescence urine & P.F 1.70-21.0 - 1.30 0.600 97.0-102 3
CE- LIF & CE-UV urine 0.050-10.0 & 0.400-10.0
0.9999 & 0.9994-0.9999
0.520-5.17 & 2.90-12.6
50.0 & 400 (LOQ) 93.0-113 4
Isopotential-F urine 0.00-100 0.9998 1.00-2.40 1.80 - 5
F urine 20.0-100 0.9966-0.9997 2.90 - 91.7-97.0 6
HPLC urine 20.0-100 r>0.9900 0.450 0.300-1.90 106 8
HPLC plasma & urine 4.00-100 & 0.090-3.10 (×103)
0.9984 & 0.9998
4.50 & 0.810 1.00 - 10
UV derivative-S urine & serum 0.00-16.0 (×103) 0.9996-0.9997 - 0.200-0.60 (×103) 99.0-103 14 HPLC urine & plasma 0.00-40.0 &
0.00-80.0
0.9984 & 0.9991
2.00-3.00 & 2.00-11.0
10.0 79.4-88.3 & 69.9-90.3
41
CF-SPF serum & P.F. 10.0-400 & 2.50-80.0
0.9995 2.60-3.30 0.450-0.900 95.6-104 42
CPE-F urine & plasma 5.00-800 & 10.0-800
0.9986 & 0.9993 3.50-3.71 & 4.21-4.74
3.90 & 5.80 101-114 & 94.7-107
This work
Recovery experiments and interference study
The TM recoveries achieved using the proposed method were de-termined at three concentrations. Drug-free urine and plasma samples were obtained for this purpose from the healthy volunteer and from the Blood Transfusion Organization in Tabriz, Iran, respectively. The samples were treated as described in the “Procedure for biological samples” section. Aliquots (0.5 mL) of clear supernatant solutions of each test sample were transferred to clean centrifuge tubes and spiked with TM at the three test concentrations and then analyzed following the optimized procedure. The recoveries ranged from 94.7 to 114%, as shown in Table 3, and were satisfactory.
Typical spectra for a TM standard solution, blank urine and plas-ma samples, a urine sample from a volunteer, and the urine sample spiked with TM are shown in Figure 1. No additional peaks caused by interfering compounds were observed at the emission wavelength that was used. Therefore, the similarities in the excitation and emis-sion spectra found in each of the sample types and the reasonable recoveries that were found indicated that there were no significant matrix effects on the proposed method.
Potential interferences by species that commonly accompany TM in pharmaceuticals were also studied. The proposed method showed a high degree of tolerance for other species that are frequently found with TM. The specificity of the assay was also investigated by analyzing samples containing TM in the absence and presence of HCT at concentrations found in pharmaceutical preparations, to ensure that co-administered HCT did not interfere with the assay. No significant
differences were observed in the analytical signals for TM between when HCT was present and when it was absent.
Application to real samples
The proposed method was successfully used to determine TM in human urine. The urine for this purpose was collected at speci-fied time intervals after TM had been ingested, and the volume of urine produced was measured directly after each collection time. The TM concentrations in the urine samples collected after TM had been ingested are summarized in Table 4. The presence of the main metabolite of TM (i.e., HTMS) should be taken into account when TM is determined in biological samples. This is important not only because of the intrinsic pharmacological activity of HTMS, but also because TA and HTMS signals strongly overlap in certain methods, such as fluorimetric methods.3,4 However, the HTMS metabolite can-not interfere with the TM determination using the proposed method, and this may be attributed to the dissociation constant of the sulfuric group in HTMS, which was predicted to be 2.04 using MarvinSketch software (ver.6, 2013). This metabolite will, therefore, mainly be in the ionized form at the pH values used in the proposed method, and the HTMS will not be extracted in the CPE procedure. The concen-trations presented in Table 4 are, therefore, for the parent TM only. The cumulative amount of TM excreted in the volunteer’s urine is presented in Figure 7. About 5.72% (2.86 mg) of the TM dose was excreted as the unmetabolized drug in the urine within 24 h, and this agrees with the results of other studies.7-9
Figure 7. Cumulative amount of TM excreted in urine after an oral dose of 50 mg TM
Table 3. Recoveries of TMfrom spiked urine and plasma samples
Sample (µg LAdded −1)
Found ± SD (n = 3) (µg L−1)
Recovery (%)
Urine 75.0 85.2 ± 3.20 114
5.00×10² 505 ± 18.4 101 7.50×10² 819 ± 33.6 109
Plasma 75.0 71.0 ± 3.80 94.7
5.00×10² 488 ± 26.2 97.6 7.50×10² 801 ± 47.1 107 SD = standard deviation.
Table 2. Intra-day and inter-day precision and accuracy of the TMmethod
Sample Nominal C(µg L−1) a
Precision (RSD%) (n = 3) Accuracy (R.E%)
Intra-day Inter-day Intra-day Inter-day
Urine 75.0 3.50 4.21 +2.90 +4.40
4.00×10² 3.71 4.65 +3.20 +5.10
7.50×10² 3.63 4.74 +4.00 +4.50
Plasma 75.0 5.20 7.74 -6.00 -6.90
4.00×10² 5.59 6.95 -4.50 -5.30
7.50×10² 5.59 8.20 -3.00 -4.30
aC = concentration, R.E = relative error.
Table 4. Concentrations of triamterene (TM) in human urine after oral administration of 50 mg TM (results obtained using the cloud point
extraction-spectro-fluorimetric method)
Time interval (h) 0-1 1-2 2-3 3-4 4-6 6-10 10-14 14-24
Volume collected (mL) 145 185 195 145 192 385 175 320
CONCLUSIONS
A method involving CPE and spectrofluorimetric detection was developed for the extraction and determination of TM in human urine samples, and it was found to be a promising approach for monitoring drugs for pharmaceutical and clinical purposes. The method was vali-dated using spiked real samples, and the method was demonstrated to allow trace quantities of TM to be detected with adequate degrees of accuracy and precision. The method was found to be sensitive enough for TM to be determined in a variety of biological samples, so it could be used for screening purposes in doping control procedures. The proposed method offers several advantages over alternative methods, including being safe, simple, and rapid, and involving relatively low costs, and it is especially useful if more sophisticated techniques, such as HPLC, GC-MS, or CZE, are not available.
ACKNOWLEDGMENTS
The authors are grateful to the Research Office of the Tabriz University of Medical Sciences for financial support and to Prof. H. Valizadeh for kindly preparing the MarvinSketch software. REFERENCES
1. Luis, M. L.; Fraga, J. M. G.; Jiménez, A. I.; Jiménez, F.; Hernández O.; Arias, J. J.; Talanta2004, 62, 307.
2. Ensafi, A. A.; Hajian, R.; Anal. Sci.2008, 24, 1449.
3. Ibãnez, G. A.; Escandar, G. M.; Espinosa Mansilla, A.; Mũnoz de la Pẽna, A.; Anal. Chim. Acta2005, 538, 77.
4. Horstkötter, C.; Kober, S.; Spahn-Langguth, H.; Mutschler, E.; Blaschke, G.; J. Chromatogr. B2002, 769, 107.
5. Murillo Pulgarín, J. A.; Alãnón Molina, A.; Fernández López, P.; Anal. Biochem.2001, 292, 59.
6. Murillo Pulgarín, J. A.; Alãnón Molina, A.; Fernández López, P.; Anal. Chim. Acta2001, 449, 179.
7. Youssef, Eman; I. El-Kimary, M.; Hassan, E. M.; Barary, M. A.; J. Pharm. Biomed. Anal. 2012, 61, 78.
8. Carda-Broch, S.; Esteve-Romero, J. S.; García-Alvarez-Coque, M. C.;
Anal. Chim. Acta1998, 375, 143.
9. Blume, C. D.; Williams, R. L.; Upton, R. A.; Lin, E. T.; Benet, L. Z.;
Am. J. Med.1984, 59.
10. Swart, K. J.; Botha, H.; J. Chromatogr. B1987, 413, 315.
11. Sörgel, F.; Lin, E. T.; Hasegawa, J.; Benet, L. Z.; J. Pharm. Sci.1984,
73, 831.
12. Yakatan, G. J.; Cruz, J. E.; J. Pharm. Sci.1981, 70, 949.
13. Brunelli, C.; Bicchi, C.; Di Stilo, A.; Salomone, A.; Vincenti, M.; J. Sep. Sci.2006, 29, 2765.
14. Duran Merás, I.; Espinosa Mansilla, A.; Salinas López, F.; Rodríguez Gómez, M. J.; J. Pharm. Biomed. Anal.2002, 27, 81.
15. Bavili Tabrizi, A.; Harasi, M.; Drug Test. Anal.2012, 4, 145. 16. Bosch Ojeda, C.; Sánchez Rojas, F.; Microchim. Acta2012, 177, 1. 17. Xie, S.; Chin Paau, M.; Fai Li, C.; Xiao, D.; Choi, M. M. F.; J.
Chro-matogr. A2010, 1217, 2306.
18. Fernanda Silva, M.; Soledad Cerutti, E.; Martinez, L. D.; Microchim. Acta2006, 155, 349.
19. Sosa Ferrera, Z.; Padron Sanz, C.; Mahugo Santana, C.; Santana Rodriguez, J. J.; TrAC, Trends Anal. Chem.2004, 23, 469.
20. Dadfarnia, S.; Hajishabani, A. M.; Fazeli Rad, H.; J. Chin. Chem. Soc.
2011, 58, 503.
21. Wu, H.; Zhao, G.-Y.; Du, L.-M.; Spectrochim. Acta A2010, 75, 1624. 22. H. Filik, Şener, I.; Cekiç, S. D.; Kiliç, E.; Apak, R.; Chem. Pharm. Bull.
2006, 54, 891-896.
23. Bavili Tabrizi, A.; B. Korean Chem. Soc.2006, 27, 1604. 24. Bavili Tabrizi, A.; Chem. Anal. (Warsaw)2007, 52, 823. 25. Bavili Tabrizi, A.; Bull. Korean Chem. Soc.2006, 27, 1780.
26. Yang Qin, X.; Meng, J.; Ye Li, X.; Zhou, J.; Li Sun, X.; Dong Wen, A.;
J. Chromatogr. B2008, 872, 38.
27. Wang, C.; Wang, L.; Zhao, Q.; Chen, J.; Zheng, L.; Zheng, M.; Zhang, R.; Wang, Z.; Anal. Methods2013, 5, 3688.
28. Yu, F.; Liu, C.; Guo, Y.; Yang, Y.; Anal. Methods2013, 5, 3920. 29. Caballero-Díaz, E.; Simonet, B. M.; Valcárcel, M.; Anal. Methods2013,
5, 3864.
30. Bahram, M.; Khezri, S.; Khezri, S.; Curr. Chem. Lett.2013, 2, 49. 31. Wang, S.; Meng, S.; Guo, Y.; J. S p e c t ro s c . 2 0 1 3, doi:
10.1155/2013.735702.
32. Gürkan, R.; Altunay, N.; Quim. Nova2013, 36, 1146.
33. Soylak, M.; Yilmaz, E.; Ghaedi, M.; Montazerozohori, M.; Sheibani, M.;
J. AOAC Int.2012, 95, 1797.
34. Duran, C.; Özdeș, D.; Kaya, E. Ç.; Kantekın, H.V.; Bulut, N.; Tüfekçı, M.; Turk. J. Chem.2012, 36, 445.
35. Shokrollahi, A.; Ghaedi, M.; Gharaghani, S.; Fathi, M. R.; Soylak, M.;
Quim. Nova2008, 31, 70.
36. Bavili Tabrizi, A.; Food Chem.2007, 100, 1698. 37. Bavili Tabrizi, A.; J. Hazard. Mater. B2007, 139, 260. 38. Bavili Tabrizi, A.; Pharm. Sci. 2005, 45.
39. U.S. Department of Health and Human Services, Food and Drug Ad-ministration Center for Drug Evaluation and Research (CDER), Center for Veterinary Medicine (CVM), Guidance for Industry Bioanalytical Method Validation, Biopharmaceutics, 2013.
40. Zamani-Kalajahi, M.; Fazeli-Bakhtiyari, R.; Amiri, M.; A.; Golmoham-madi, Afrasiabi, A.; Khoubnasabjafari, M.; Jouyban, A.; Bioanalysis
2013, 5, 437.
41. Brodie, R-R.; Chasseaud, L. F.; Taylor, T.; Walmsley, L. M.; J. Chro-matogr. Biomed. Appl.1979, 164, 527.