A
r
ti
c
le
*e-mail: [email protected]
Determination of Catechin in Green Tea using a Catechol Oxidase Biomimetic Sensor
Suellen C. Fernandes, Renata El-Hage M. de Barros Osório, Ademir dos Anjos, Ademir Neves, Gustavo Amadeu Micke and Iolanda C. Vieira*
Departamento de Química, Universidade Federal de Santa Catarina, 88040-900 Florianópolis-SC, Brazil
Um sensor biomimético catecol oxidase, baseado em um novo complexo cobre(II) foi desenvolvido para determinação de catequina em chá verde e os resultados comparados com os obtidos por eletroforese capilar. O complexo dinuclear de cobre(II) [Cu2(HL)(µ-CH3COO)] (ClO4), contendo o ligante N,N-[bis-(2-piridilmetil)]-N’,N’-[(2-hidroxibenzil)(2-hidroxi-3,5-di-tert-butilbenzil)]-1,3-propanodiamino-2-ol (H3L), foi sintetizado e caracterizado por IV, 1H
RMN e análise elementar. As melhores condições para otimização do sensor biomimético foram estabelecidas por voltametria de onda quadrada. O melhor desempenho desse sensor foi obtido em 75:15:10% (m/m/m) de pó de grafite:nujol:complexo de cobre(II), tampão fosfato 0,05 mol L-1
(pH 7,5) e freqüência, amplitude de potencial, incremento em 30 Hz, 80 mV, 3,3 mV, respectivamente. A curva analítica foi linear na faixa de concentração 4,95×10⁻⁶ a 3,27×10⁻⁵ mol L-1
(r=0,9993) com limite de detecção de 2,8×10⁻⁷ mol L-1. Esse sensor biomimético demonstrou
longo tempo de estabilidade (9 meses; 800 determinações) e reprodutibilidade com um desvio padrão relativo de 3,5%. A recuperação da catequina em amostras de chá verde variou de 93,8 a 106,9% e a determinação, comparada com a obtida usando eletroforese capilar, mostrou-se aceitável a um nível de confiança de 95%.
A catechol oxidase biomimetic sensor, based on a novel copper(II) complex, was developed for the determination of catechin in green tea and the results were compared with those obtained by capillary electrophoresis. The dinuclear copper(II) complex, [Cu2(HL)(µ-CH3COO)](ClO4), containing the ligand N,N-[bis-(2-pyridylmethyl)]-N’,N’-[(2-hydroxybenzyl)(2-hydroxy-3,5-di-tert-butylbenzyl)]-1,3-propanediamine-2-ol (H3L), was synthesized and characterized by IR, 1H NMR and elemental analysis. The best conditions for the optimization of the biomimetic sensor were established by square wave voltammetry. The best performance for this sensor was obtained in 75:15:10% (m/m/m) of the graphite powder:nujol:copper(II) complex, 0.05 mol L-1 phosphate
buffer solution (pH 7.5) and frequency, pulse amplitude, scan increment at 30 Hz, 80 mV, 3.3 mV, respectively. The analytical curve was linear in the concentration range 4.95×10⁻⁶ to
3.27×10⁻⁵ mol L-1 (r = 0.9993) with a detection limit of 2.8×10⁻⁷ mol L-1. This biomimetic sensor
demonstrated long-term stability (9 months; 800 determinations) and reproducibility with a relative standard deviation of 3.5%. The recovery of catechin from green tea samples ranged from 93.8 to 106.9% and the determination, compared with that obtained using capillary electrophoresis, was found to be acceptable at the 95% confidence level.
Keywords: catechin, green tea, biomimetic sensor, square wave voltammetry
Introduction
Tea is one of the most consumed beverages in the world and was firstly used in China for its medicinal properties 5000 years ago. Recent epidemiological studies have shown that the consumption of tea may help to prevent cancers in humans because the tea leaf contains abundant groups of polyphenols. The beneficial effects (e.g. anti-inflammatory,
anti-obesity, reduced incidence of a variety of cancers and cardiovascular diseases) of consuming green tea have been
demonstrated.1-4 These have been attributed to caffeine,
phenolic compounds and anti-oxidative components. The most common polyphenols in green tea are catechins, which may reach concentration levels of 30% (by mass) of
dry material.4 Catechins are believed to act as antioxidants
Many methods for the determination of tea catechin have
been published.1-9 High-performance liquid chromatography
and capillary electrophoresis with ultraviolet detection are the most cited techniques for separation, identification and quantitation. However, mass spectrometry, and electrochemical, fluorescence and chemiluminescence detection are also used in cases where more sensitive or selective detection is needed. Analytical techniques, such as gas chromatography, spectrophotometry, nuclear magnetic resonance spectroscopy and biosensors have also been used
for the determination of catechin.1-9
The development of functional models of metalloenzymes for catalyst oxidation reactions is a subject of great
interest.10-16 Neves et al.17-25 have extensively synthesized
and characterized model complexes to mimic the active site of the different enzymes (e.g., catechol oxidase, peroxidase, galactose oxidase, catalase, purple acid phosphatase). The
majority of O2-reactive copper models have been based
on the binuclear-Cu catechol oxidase. This enzyme has a coupled binuclear copper center in its active site and catalyzes the oxidation of diphenols by molecular oxygen
with the production of o-quinones. The nature, number and
geometric arrangement of ligand atoms define the type(s)
of Cu:O2 species formed. Amine, pyridyl, pyrazolyl and
imidazole nitrogen-type donor ligands with bi-, tri- and tetradentate ligands have been successfully used to stabilize
Cu:O2 intermediates at low temperature and in aprotic
solvents.10,16-20
Many biomimetic catalysts of catechol oxidase
have been reported in the literature.10,16-20 However,
very few report their uses in biomimetic sensors.12,13,26
Biomimetic catechol oxidase catalysts have been shown to be efficient catalysts for the oxidation of phenolic
substrates to quinones.12,13 Sotomayor et al.12 employed
[CuDipyCl2] as a biomimetic catalyst in the construction
of an amperometric enzymeless biosensor for phenol determination. This sensor was prepared modifying a glass
carbon electrode with a Nafion@ membrane doped with
[CuDipyCl2] and a linear response range between 4.0×
10-5 to 6.0×10⁻⁴ mol L-1 was obtained. In addition, the
authors13 used a tris (2,2`-bipyridyl) copper(II) chloride
complex as a biomimetic catalyst in the construction of an amperometric sensor for dopamine. This sensor gave a rectilinear analytical curve for dopamine concentration
from 9 to 230 µmol L-1 and a detection limit of
4.8 µmol L-1. Recently, a dinuclear copper(II) complex
was synthesized, characterized and successfully used in the construction of a biomimetic sensor for determining
hydroquinone in cosmetics.26 This sensor showed better
general performance compared with biosensors employing
enzymes obtained from vegetable tissue.27-30
Metallophthalocyanines are a class of macrocyclic
compounds, possessing a system of conjugated π-electrons,
which are very versatile catalysts for several electrochemical reactions and have been successfully employed in the development of chemical sensors. Nyokong and coworkers have used Co(II), Fe(II), Ni(II) and Mn(III)
tetrakis benzylmercapto and dodecylmercapto31 or tetrakis
(dodecylmercapto),32 nickel(II) tetrakis benzylmercapto
and dodecylmercapto33, benzyl- and dodecyl-mercapto
tetra substituted cobalt, iron, manganese, nickel and
zinc34 metallophthalocyanine complexes as biomimetic
catalysts. These complexes were deposited on the surface of gold electrodes by the self-assembled monolayer technique and used to investigate the oxidation of sulphite, nitrite and 4-chlorophenols. The catalytic activity of Co(II) tetra ethoxythiophene and Co(II) tetra phenoxypyrrole phthalocyanine complexes towards oxidation of 2-mercaptoethanol, L-cysteine and reduced
glutatione has been reported by this group.35
This paper describes the determination of catechin in green tea using a novel biomimetic sensor constructed with
the copper complex [Cu2(HL)(µ-CH3COO)](ClO4) containing
a novel ligand
N,N-[bis-(2-pyridylmethyl)]-N’,N’-[(2-hydroxybenzyl)(2-hydroxy-3,5-di-tert
-butylbenzyl)]-1,3-propanediamine-2-ol (H3L). This copper complex was
synthesized, characterized and used as a catechol oxidase catalyst. The influence of different experimental parameters on the performance of the biomimetic sensor, such as graphite paste complex composition, pH, buffer concentration, frequency, pulse amplitude and scan increment, were investigated using square wave voltammetry. The results obtained for catechin determination in green tea samples using the biomimetic sensor and capillary electrophoresis methods are in good agreement.
Experimental
Chemicals and solutions
All chemicals were of analytical grade and all solutions were prepared with water from a Millipore (Bedford, MA, USA) Milli-Q system (model UV Plus Ultra-Low Organic Water). Caffeine, catechin, epicatechin, epigallocatechin, epicatechin gallate, epigallocatechin gallate, gallic acid, guaiacol, ferulic acid, p-coumaric acid, syringic acid, vanilic acid, sucrose, glucose, fructose, benzoic acid, citric acid, tartaric acid, fumaric acid, dichloromethane and tetrabutylammonium hexafluorphosphate were acquired from Sigma. Sodium dodecylsulfate (SDS) and triethylamine (TEA) were obtained from Merck. Catechin
solution was prepared daily in 0.05 mol L-1 phosphate buffer
solution at pH 7.5. Reference solutions from 4.95 × 10⁻⁶ to
3.27 × 10⁻⁵ mol L-1 were prepared from the stock solution
by appropriate dilution with the same buffer solution.
Phosphate buffer (0.05 mol L-1, pH 7.5) solution was used as
the supporting electrolyte. For the capillary electrophoresis analysis a stock solution of SDS and TEA was prepared at
1.0 mol L-1, and the internal standard (propylparaben) was
prepared in methanol at 120 mg L-1.
Apparatus
Elemental analysis was performed with a Carlo Erba E1110 analyzer. IR spectra were measured in the range
4000-400 cm-1 with KBr pellets, using a Perkin-Elmer
781 spectrometer. 1H NMR analysis of the ligand was
carried out with a Bruker 200 MHz spectrometer in CDCl3
chloroform, at 25 oC. Chemical shifts were referenced to
tetramethylsilane (TMS).
Electrochemical instrumentation
Square wave voltammetry measurements were performed using an Autolab PGSTAT12 potentiostat/ galvanostat (Eco Chemie, Utrecht, The Netherlands). A three-electrode assembly was used in which a biomimetic
sensor, and Ag/AgCl (3.0 mol L-1 KCl) and
platinum-wire electrodes, served as the working, reference and auxiliary electrodes, respectively. A cyclic voltammetry measurement of the copper(II) complex was performed with an EG&G PAR, model 273A, potentiostat/ galvanostat. Cyclic voltammograms were obtained in dichloromethane containing the copper(II) complex and
0.1 mol L-1 tetrabutylammonium hexafluorphosphate as
the supporting electrolyte under an argon atmosphere. The electrochemical cell employed was of a standard three-electrode configuration: platinum (working), Ag/AgCl (reference) and platinum wire (auxiliary)
electrodes. The redox couple (Fc+/Fc) of ferrocene
(+0.40 V vs. NHE) was used as the internal standard. The
system was monitored with a personal computer for data
acquisition and subsequent analysis. All measurements
were carried out at room temperature (25.0 ± 0.5 oC).
Capillary electrophoresis equipment
The validation of the proposed analytical method was
carried out using an Agilent Technologies HP3DCE capillary
electrophoresis automated apparatus (Palo Alto, CA, USA), equipped with a diode array detector. The measurements were performed at 25 °C on an uncoated fused-silica
capillary (48.5 cm × 50 µm I.D. × 375 µm O.D, 40 cm of
effective length) obtained from Polymicro Technologies (Phoenix, AZ, USA). The acquisition software for data
treatment was HP Chemstation®.
Synthesis of the ligand (H
3L) and of the complex [Cu2(HL) (µ-CH3COO)](ClO4)
The reaction scheme for preparation of the H3L
ligand is shown in Figure 1. The products N,N-[bis-
(2-pyridylmethyl)]-N’-[(2-hydroxybenzyl)]-1,3-propanediamine-2-ol (1)20 and 3,5-di-tert
-butyl-2-hydroxybenzyl chloride (2)21,22 were synthesized according
to the methods described in the literature. 1H NMR (CDCl
3,
dppm) for product 120: 2.6-2.7 (4H), 3.8-4.0 (7H), 6.7-6.8
(2H), 7.0-7.2 (6H), 7.5 (2H), 8.5 (2H). 1H NMR (CDCl
3, d
ppm) for product 2:21,22 1.33 (9H), 1.43 (9H), 4.7 (2H), 7.0
(1H), 7.3 (1H). Melting point for product 222: 61-62 oC.
Synthesis of the H3L ligand: to a CH2Cl2 solution
containing 2.0×10⁻² mol L-1 of 1 and 3.0×10⁻² mol L-1 of
triethylamine, 3.0×10⁻² mol L-1 of 2 was added dropwise
at room temperature. After 24 h under stirring at 40 oC,
the resulting solution was washed five times with 50 mL of sodium bicarbonate solution. The organic phase was
dried over anhydrous Na2SO4 and the solvent was removed
under reduced pressure to give a yellow oil corresponding
to the H3L ligand. Yield: 14.2 g (75% based on product A,
MM = 596.81 g mol-1). The H
3L ligand was confirmed
through 1H NMR (CDCl
3), d(ppm): 1.2 (9H), 1.4 (9H),
2.6 (4H), 3.6-4.2 (9H), 6.8-7.1 (10H), 7.5 (2H), 8.5 (2H); the phenolic protons were not observed.
Synthesis of the complex[Cu2(HL)(µ-CH3COO)](ClO4):
a 20 mL aliquot of a methanol solution of 1.0 × 10⁻³ mol L-1
H3L ligand was added to 20 mL of a methanol solution of 2.0
× 10-3 mol L-1 Cu(CH
3COO)2·H2O under stirring. The dark
green solution was heated to 50 °C, 2.0 × 10⁻³ mol L-1 sodium
perchlorate was then added and the solution was concentrated to around 20 mL. After cooling the solution to room temperature, a stable green microcrystalline precipitate was formed, which was filtered off and washed with cold isopropanol and ethyl
ether. Yield: 50% (based on H3L ligand). The dinuclear
copper(II) complex was confirmed and characterized through
IR, CHN and X-ray crystallographic analysis.24 Anal. Calc.
for Cu2C42H59ClN4O11 (MM = 958.46 g mol-1): C: 52.63%; H:
6.20%; N: 5.85%. Found: C: 51.07%; H: 5.71%; N: 5.87%.
IR (KBr) νmax/cm-1: (OH, alcohol) 3438s; (CH, t-butyl) 2956s;
(COO–, acetate)
asymm 1572s; (COO–, acetate)symm 1436s; (CO)
1284m; (ClO–, perchlorate) 1092s.
Preparation of the biomimetic sensor
The biomimetic sensor was prepared as previously
described by our group:26-30 firstly, the graphite powder
(375 mg; 75% m/m) and the copper complex powder (50 mg; 10% m/m) were mixed and homogenized in a mortar for 20 min to ensure uniform dispersion. Subsequently, Nujol (75 mg; 15% m/m) was added and the mixture was mixed for additional 20 min to produce the final paste. The resulting modified carbon paste was packed firmly into the cavity (3.0 mm diameter) of a plastic syringe and the external electrical contact was established through a silver wire.
Electrochemical measurement
Square wave voltammetry measurements were performed in an unstirred, non de-aerated phosphate buffer solution
(pH 7.5) at 25.0 ± 0.5 oC and all potentials were measured
and reported vs. Ag/AgCl (3.0 mol L-1 KCl). In a typical run,
a 10 mL of the supporting electrolyte was transferred into a clean, dry cell and the required volume of the catechin or sample solutions was added by micropipette. After a stirring period of 60 s in order to homogenize the solution, a square wave or cyclic voltammogram was recorded. The square wave voltammetry measurements were performed applying a sweep potential between + 0.29 and 0 V, at a pulse amplitude of 10 to 100 mV, frequency of 10 to 100 Hz and scan increment of 0.3 to 3.6 mV, after successive additions of catechin.
Capillary electrophoresis measurement
Electropherograms were recorded as described: standard solutions and samples were injected hydrodynamically at
50 mbar for 3 s and the applied separation voltage was 25 kV, negative polarity. The detector wavelength was fixed at 206 nm. The background electrolyte (BGE) consisted
of a mixture of 50.0 × 10⁻³ mol L-1 sodium dodecylsulfate,
10.0 × 10⁻³ mol L-1 triethylamine and pH 2.5 adjusted with
phosphoric acid. At the start of each new working session, the capillary was conditioned at 25 °C and flushed with
1.0 mol L-1 sodium hydroxide for 10 min, followed by
deionized water for 5 min and finally with the BGE for 10 min. Between runs with the same buffer, the capillary was rinsed for 2 min with BGE. At the end of the analysis,
the capillary was rinsed for 5 min with 1.0 mol L-1 sodium
hydroxide and 10 min with deionized water.
Preparation of green tea samples and measurement
Three types of green tea samples (A, B and C) were selected and purchased in Florianópolis, SC, Brazil. The samples were prepared by extracting 2.0 g of the tea
with 40 mL of the 0.1 mol L-1 phosphate buffer solution
(pH 7.5) at 35 oC, incubating for 20 min, shaking for 2 min,
filtering and centrifuging. An aliquot of 10 mL of the green tea extract was transferred to an electrochemical cell and analyzed after successive additions of the reference catechin solution. After each addition, square wave voltammograms were recorded by scanning the potential from + 0.29 and 0 V, at a pulse amplitude of 80 mV, a frequency of 30 Hz and a scan increment of 3.3 mV. All measurements were performed in triplicate.
A capillary electrophoresis system was also used for the determination of catechin in the green tea samples. These samples were diluted, 1:4:1 (v/v/v) sample:distilled water:internal standard, before injection. For the quantitation, the calibration curve with concentrations
of the catechin between 15 and 60 mg L-1 and a constant
internal standard concentration (20 mg L-1), were used.
Each concentration was prepared in triplicate and injected in triplicate.
Results and Discussion
Synthesis and characterization of the ligand and the dinuclear copper(II) complex
The known products
N,N-[bis-(2-pyridylmethyl)]-N’-[(2-hydroxybenzyl)]-1,3-propanediamine-2-ol (1) and
3,5-di-tert-butyl-2-hydroxybenzyl chloride (2) were prepared
in good yield and the characterization was unambiguously established by NMR spectroscopy and melting point
techniques, as reported in the literature.21-22 The ligand
(2-hydroxy-3,5-di-tert-butylbenzyl)]-1,3-propanediamine-2-ol (H3L) was obtained in good yield using epichlorohydrin,
which is widely used as a convenient precursor for the synthesis of unsymmetric ligands containing the central
skeleton 1,3-diaminopropan-2-ol.20,21,24 The H
3L ligand’s
structure was confirmed through 1H NMR spectroscopy
and prepared in order to synthesize dinuclear copper(II) complexes in which the molecular spacer alkoxo oxygen atom holds the two metal centers in close proximity and the fifth and sixth coordination positions are available for the coordination of exogenous ligands.
The H3L ligand reacts in methanolic solution with
Cu(CH3COO)2.H2O (stoichiometry 1:2) and addition
of NaClO4 results in the formation of the dinuclear
complex [Cu2II(HL)(µ-CH
3COO)](ClO4). This complex
was confirmed and characterized through IR, elemental and X-ray crystallographic analysis. The IR spectrum
of the complex shows νasymm(COO–) and ν
symm(COO–) at
1572 and 1436 cm-1, respectively. The splitting between
νasymm(COO–) and ν
symm(COO–) is 136 cm-1, indicating
that the carboxylate group bridges the two Cu(II) ions. In
addition, stretching vibrations of the uncoordinated ClO4–
are located at 1092 cm-1, confirming the cationic character
of this complex according to the stoichiometry determined
from elemental analysis. The asymmetry of the H3L ligand
leads to non-equivalent environments of both copper centers in the complex. In the asymmetric unit both copper(II) centers are pentacoordinated with one Cu being in a square pyramidal geometry and the other one in a distorted trigonal bipyramidal geometry. The structure of the complex (inset Figure 2) reveals that the two copper centers are 3.48 Å apart and are bridged by an alkoxide oxygen atom of the
H3L ligand and by an additional bidentate acetate, to form a
double-bridged binuclear core. The structure shows distinct coordination modes of the phenol groups around the Cu center in a square-pyramidal geometry, thus resulting in significantly different Cu-O bond distances: one terminal
phenol oxygen atom (containing tert-butyl groups) is
protonated in the apical position (Cu-Ophenol = 2.45 Å), while
the other is coordinated as a phenolate and occupies the
basal plane (Cu-Ophenolate = 1.90 Å). Therefore, the complex
can be regarded as a structural model for the active site of
the met form of catechol oxidase.
Cyclic voltammetry of the dinuclear copper(II) complex
Figure 2 shows the cyclic voltammogram for
5.0 × 10⁻⁴ mol L-1 dinuclear copper(II) complex in
dichloromethane and 0.1 mol L-1 tetrabutylammonium
hexafluorphosphate performed by scanning the potential
between + 0.8 and – 1.2 V vs. Ag/AgCl at a scan rate
of 100 mV s-1. The inset shows a schematic diagram of
the [Cu2(HL)(CH3COO)]+ cation. It can be seen that the
complex shows a quasi-reversible process at Epc = - 0.37
mV, corresponding to the redox couple CuIICuII/CuIICuI,
and an irreversible process at Epc = - 0.72 V relating to
the CuIICuI/CuICuI process. A tendency toward negative
reduction potentials was observed for copper complexes with an alkoxide bridge and phenolic ligands, due to the electronegativity and hardness of the oxygen atoms of the bridge and of the ligands.
Optimal conditions of the biomimetic sensor response
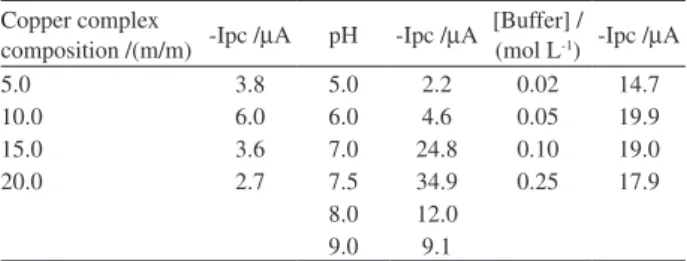
For the catechin determination using the biomimetic sensor with the highest sensitivity, the graphite paste complex composition, pH and buffer concentration were investigated to obtain optimal conditions. The results of the optimization studies are shown in Table 1.
In the past few years, we have reported the use and composition of carbon paste in the construction of a biosensor and biomimetic sensor and the best composition
was 75:25 (%, m/m) graphite powder:Nujol.26-30 Therefore,
this carbon paste composition was used in this study in
Figure 2. Cyclic voltammogram for 5.0×10⁻⁴ mol L-1 dinuclear copper (II) complex in dichloromethane and 0.1 mol L-1 tetrabutylammonium hexafluorphosphate performed by scanning the potential between + 0.8 and – 1.2 vs. Ag/AgCl at a scan rate of 100 mV s-1. Inset: the dinuclear copper(II) cation [Cu2(HL)(CH3COO)]+ containing the H
3L ligand.
Table 1. Optimization of biomimetic sensor parameters
Copper complex
composition /(m/m) -Ipc /µA pH -Ipc /µA
[Buffer] / (mol L-1) -Ipc /µA
5.0 3.8 5.0 2.2 0.02 14.7
10.0 6.0 6.0 4.6 0.05 19.9
15.0 3.6 7.0 24.8 0.10 19.0
20.0 2.7 7.5 34.9 0.25 17.9
the construction of the biomimetic sensor. The effect of varying the Cu(II) complex composition from 5.0 to 20.0% (m/m) in a fixed amount of graphite powder:Nujol of 75:15 (%, m/m) was investigated. The analytical
response (cathodic peak currents) for 1.0 × 10⁻⁵ mol L-1
catechin increased with the Cu(II) complex percentage used up to 10%. Thus, a composition of 75:15:10 (%, m/m) graphite:Nujol:Cu(II) complex was used in the construction of the proposed biomimetic sensor.
The effect of pH in the range of 5.0 to 9.0 of a
1.0 × 10⁻⁵ mol L-1 catechin solution was studied. The
analytical response (cathodic peak current) increased with an increase in the pH up to 7.5. Consequently, this pH was used as the working pH.
The effect of varying the phosphate buffer (pH
7.5) concentration from 0.02 to 0.25 mol L-1 of a
1.0 × 10⁻⁵ mol L-1 catechin solution on the biomimetic
sensor response was also investigated. The best response
was obtained for a concentration of 0.05 mol L-1, which
was subsequently used in this study.
Square wave voltammetry parameters were also investigated and in Table 2 the values of the biomimetic sensor response for frequency, pulse amplitude and scan increment, respectively, can be observed.
The effects of frequency (10 to 100 Hz), pulse amplitude (10 to 100 mV) and scan increment (0.3 to 3.6 mV) on the
biomimetic sensor response to 1.0 ×10⁻⁵ mol L-1 catechin
solutions were studied. The highest analytical signal was obtained at 30 Hz, thus this frequency was selected. The analytical response of this biomimetic sensor increased with an increase in the pulse amplitude used up to 10 to 80 mV and then staying constant between 80 and 100 mV. Consequently, the pulse amplitude of 80 mV was used in this study. The sensor showed good response and linearity up to a scan increment of 3.3 mV, after which the response value remained constant; thus, the scan increment 3.3 mV was selected.
Reproducibility, repeatability and stability of the biomimetic sensor
Reproducibility was investigated considering three electrodes, prepared independently, and an acceptable reproducibility with a relative standard deviation of 4.2%
for the response to 1.0 × 10⁻⁵ mol L-1 catechin solution (pH
7.5) was obtained.
The repeatability of the biomimetic sensor performance
was studied for solutions containing 1.0×10⁻⁵ mol L-1
catechin solution (pH 7.5). The relative standard deviation was 3.4% for 12 successive assays.
To clean the electrode surface cyclic voltammetry was performed applying a sweep potential between + 1.0 and – 1.0 V so it could be used without removing the surface. When not in use, the sensor was stored at room temperature.
Long-time stability is considered an important factor of the electrode performance. The stability of the biomimetic sensor was tested by repeated measurements without surface renewal over a 270-day period (at least 800 determinations)
using a 1.0 × 10⁻⁵ mol L-1 catechin solution in 0.1 mol L-1
phosphate buffer solution (pH 7.5). When the sensor was stored at room temperature and measured every 1-2 days, no obvious change was found in the response.
The good reproducibility, repeatability and long-term stability can be attributed to the excellent ability of this Cu(II) complex to mimic the active site of the catechol oxidase enzyme and its successful use in the construction of the biomimetic sensor.
Selectivity and recovery study
The selectivity of the optimized method for the determination of catechin was examined in the presence of some substances such as caffeine, epicatechin, epigallocatechin, epicatechin gallate, epigallocatechin
gallate, gallic acid, guaiacol, ferulic acid, p-coumaric
acid, syringic acid, vanilic acid, sucrose, glucose, fructose, benzoic acid, citric acid, tartaric acid and fumaric acid. The ratios of the concentration of catechin to that of each substance were fixed at 0.1, 1.0 and 10.0. None of these substances interfered with the proposed procedure, that is, the biomimetic sensor was able to determine the amount of catechin in the presence of these substances and can therefore be considered selective.
In order to evaluate the effect of the presence of potential interferences on the proposed sensor, the standard additions method was applied. Analytical recovery measurements were obtained by adding different amounts of catechin
(29.0 to 238.1 mg L-1) to three samples of green tea (A, B
Table 2. Optimization of square wave voltammetry parameters
Frenquency/
Hz -Ipc/µA
Pulse amplitude/
mV
-Ipc/µA
Scan increment/
mV
-Ipc/µA
10 16.8 10 1.7 0.3 3.2
20 20.0 20 3.5 1.0 6.2
30 20.2 30 4.3 1.1 8.2
40 15.0 40 5.5 1.4 9.1
50 12.3 50 6.8 1.7 9.9
60 10.1 60 7.5 2.4 10.3
70 8.2 70 7.9 2.7 10.9
80 6.9 80 10.2 3.0 11.4
90 5.5 90 10.3 3.3 11.6
and C). The percentage recovery values were calculated by comparing the concentration obtained from the samples with and without the addition of known concentrations of the catechin standard solution. The recoveries of 93.8 to 106.9% obtained for these samples are shown in Table 3. It can be clearly observed that the recovery results obtained suggest an absence of matrix effects in these determinations.
Square wave voltammetry and analytical curve
Figure 3 shows a scheme of the reaction between catechin and the Cu(II) complex used to mimic the active site of the catechol oxidase incorporated into the carbon paste. In the presence of this complex the catechin is
oxidized to o-quinone and subsequently the o-quinone
produced at the electrode surface is electrochemically reduced to catechin at a potential of + 0.13V.
The electrocatalytic behavior of the carbon paste electrode and biomimetic sensor in relation to the
electrochemical reduction of the o-quinone was investigated
using square wave voltammetry under the optimum conditions established. Figure 4 shows the square wave voltammograms obtained using a carbon paste electrode (b) and biomimetic sensor (a and c) in an unstirred 0.05
mol L-1 phosphate buffer solution (pH 7.5) without catechin
(a) and with 2.38×10⁻⁵ mol L-1 of catechin (b and c).
As can be seen, the carbon paste electrode showed an
electrochemical reduction of o-quinone to catechin at a peak
potential of + 0.11 V under these experimental conditions. When the biomimetic sensor was used (voltammogram c; cathodic peak potential + 0.13 V) there was an increase in the sensor response, as expected, due to the presence the copper complex.
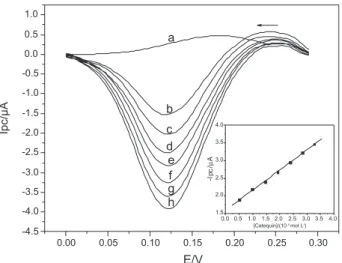
The cathodic peak currents obtained in the square wave voltammetry were proportional the catechin concentrations
of 4.95 × 10⁻⁶ to 3.27 × 10⁻⁵ mol L-1 and the regression
equation was found to be Ipc = 1.599 + 5.697 × 10⁴
[catechin]; r = 0.9993, where Ipc is the cathodic peak current in µA and [catechin] is the catechin concentration in
mol L-1. Figure 5 shows these voltammograms and inset is the
analytical curve. The detection limit (three times the signal blank/slope) and quantification limit (ten times the signal blank/slope) were calculated using this calibration curve,
and found to be 2.8 × 10⁻⁷ mol L-1 and 3.5 × 10⁻⁷ mol L-1,
respectively.
Determination of catechin in green tea using the biomimetic sensor and capillary electrophoresis
In order to evaluate the applicability of the biomimetic sensor the three samples of green tea were used in the
Table 3. Results for recoveries of catechin standard solution from green tea using the proposed biomimetic sensor
Sample Catechin/(mg L
-1)
Recovery/(%)
Added Found
A
29.0 56.9 84.2
31.0±0.1 53.4±0.1 85.9±0.2
106.9 93.8 102.0
B
56.9 84.2 110.1
55.7±0.1 80.7±0.2 113.1±0.1
97.9 95.8 102.7
C
189.2 215.0 238.1
178.2±0.1 218.1±0.1 242.0±0.1
94.2 101.4 101.6
n = 3.
Figure 3. Schematic representation of the reaction between catechin and the copper(II) complex used to mimic the catechol oxidase catalyst at the biomimetic sensor surface.
Figure 5. Square wave voltammograms obtained using the proposed biomimetic sensor for (a) blank in phosphate buffer solution, and catechin solutions at the following concentrations: (b) 4.95 × 10⁻⁶; (c) 9.80×10⁻⁶; (d) 1.45×10⁻⁵; (e) 1.92×10⁻⁵; (f) 2.38×10⁻⁵; (g) 2.83×10⁻⁵; (h) 3.27×10⁻⁵ mol L-1, at pulse amplitude 80 mV, frequency 30 Hz and increment 3.3 mV. Inset: the analytical curve of the biomimetic sensor.
Figure 6. (A) Electropherogram of sample. (B) Electropherogram of standard solution. Conditions: 50.0×10⁻³ mol L-1 sodium dodecylsulfate, 10.0 × 10⁻³ mol L-1 triethylamine, pH 2.5 adjusted with phosphoric acid, 25 °C, uncoated fused-silica capillary (48.5 cm × 50 µm I.D. ×
375 µm O.D, 40 cm of effective length), injected hydrodynamically at 50 mbar for 3 s, applied separation voltage 25 kV, negative polarity. The detector wavelength was 206 nm. Peak identification: 1 - Catechin and 2 - Caffeine.
Table 4. Determination of catechin in green tea using the biomimetic sensor and capillary electrophoresis
Sample Catechin/(mg L-1) Relative error/(%) Biomimetic sensor Capillary electrophoresis
A 160.0±0.1 159.2±0.1 – 0.50
A 155.2±0.2 159.1±0.1 + 2.45
B 81.3±0.2 93.0±0.1 + 12.6
C 80.1±0.1 88.2±0.1 + 9.18
*n=4; confidence level of 95. Re= biomimetic sensor vs capillary
electrophoresis.
quantitative determination of catechin applying the standard additions method to overcome the matrix effects. Dalluge
and Nelson1 have reported catechin content in a green
tea infusion of 9 to 117 mg g-1 (tea leaves). The results
obtained using the proposed biomimetic sensor were close to those obtained by the capillary electrophoresis method (Table 4). Figure 6A shows the electropherogram of the green tea sample and Figure 6B the electropherogram of standard solution together with the internal standard. As can be seen from the data, the results are in agreement at a 95% confidence level, within an acceptable range of error, and it can thus be concluded that the biomimetic sensor is suitable for this application.
Conclusions
This study demonstrated that the novel dinuclear copper(II) complex was successfully employed to mimic the active site of the catechol oxidase enzyme and that the proposed biomimetic sensor is a feasible alternative for the
analytical determination of catechin. This sensor showed excellent electrochemical characteristics and analytical performance. In addition, it has the benefits of low cost and simplicity of construction.
Acknowledgments
Financial support from CNPq (Process 472169/2004-1 and 472541/2006-4), MCT/CNPq/PADCT, FAPESC and also scholarships granted by CNPq to SCF and REMBO are gratefully acknowledged.
References
1. Dalluge, J. J.; Nelson, B. C.; J. Chromatogr. A 2000, 881,
411.
2. Wang, H.; Provan, G. J.; Helliwell, K.; Food Chem. 2003, 81,
307.
3. Nishitani, E.; Sagesaka, Y. M.; J. Food Compos. Anal.2004,
17, 675.
4. Schulz, H.; Engelhardt, U.H.; Wegent, A.; Drews, H. H.; Lapczynski, S.; J. Agric. Food Chem. 1999, 47, 5064. 5. Lee, B-L.; Ong, C.; J. Chromatogr., A 2000, 881, 439.
6. Wang, H.; Helliwell, K.; You, X.; Food Chem.2000, 68, 115. 7. Khokhar, S.; Venema, D.; Hollman, P. C. H.; Dekker, M.;
Jongen, W.; Cancer Lett.1997, 114, 171.
8. Arce, L.; Ríos, A.; Valcárcel, M.; J.Chromatogr. A1998, 827,
9. Weiss, D. J.; Austria, E. J.; Anderton, C. R.; Hompesch, R.; Jander, A.; J. Chromatogr. A2006, 1117, 103.
10. Selmeczi, K.; Réglier, M.; Giorgi, M.; Speier, G.; Coord. Chem. Rev.2003, 245, 191.
11. Mahadevan, V.; Gebbink, R. J. M. K.; Stack, T. D. P.; Curr. Opin. Chem. Biol.2000, 4, 228.
12. Sotomayor, M. D. P. T.; Tanaka, A. A.; Kubota, L. T.; J. Electroanal. Chem.2002, 536, 71.
13. Sotomayor, M. D. P. T.; Tanaka, A. A.; Kubota, L. T.;
Electrochim. Acta2003, 48, 855.
14. Ebavia, B. S.; Carbanilla, S.; Sevilla III, F.; Talanta2005, 66, 145.
15. Than, R.; Feldmann, A.; Krebs, B.; Coord. Chem. Rev. 1999,
182, 211.
16. Belle, C.; Pierre, J.-; Eur. J. Inorg. Chem. 2003, 23, 4137. 17. Fernandes, C.; Neves, A.; Bortoluzzi, A. J.; Mangrich, A. S.;
Rentschler, E.; Szpoganicz, B.; Schwingel, E.; Inorg. Chim. Acta. 2001,320, 12.
18. Neves, A.; Rossi, L. M.; Bortoluzzi, A. J.; Mangrich, A. S.; Haase, W.; Werner, R.; J. Braz. Chem. Soc.2001,12, 747.
19. Neves, A.; Rossi, L. M.; Bortoluzzi, A. J.; Szpoganicz, B.; Wiezbicki, C.; Schwingel, E.; Inorg. Chem.2002,41, 1788.
20. Rossi, L. M.; Neves, A.; Bortoluzzi, A. J.; Hörner, R.; Szpoganicz, B.; Terenzi, H.; Mangrich, A. S.; Maia, E. P.; Castellano, E. E.; Haase, W.; Inorg. Chim. Acta2005,358, 1807.
21. dos Anjos, A.; Bortoluzzi, A. J.; Osório, R. E-H. M. B.; Peralta, R. A.; Friedermann, G. R.; Mangrich, A. S.; Neves, A.; Inorg. Chem. Comm.2005,8, 249.
22. dos Anjos, A.; Bortoluzzi, A. J.; Szpoganicz, B.; Caro, M. S. B.; Friedermann, G. R.; Mangrich, A. S.; Neves, A.; Inorg. Chim. Acta2005, 358, 3106.
23. Osório, R. E-H. M. B.; dos Anjos, A.; Bortoluzzi, A. J.; Mangrich, A. S.; Neves, A.; unpublished results (2008). 24. Neves, A.; dos Anjos, A.; Bortoluzzi, A. J.; Szpoganicz, B.;
Schwingel, E. W.; Mangrich, A. S.; Inorg. Chim. Acta2003,
356, 41.
25. Neves, A.; Erthal, S. M. D.; Drago, V.; Griesar, K.; Haase, W.;
Inorg. Chim. Acta 1992, 197, 121.
26. Oliveira, I. R. W. Z.; Osório, R. E-H. M. B.; Neves, A.; Vieira, I. C.; Sens. Actuators, B2007, 122, 89.
27. Oliveira, I. R. W. Z.; Fernandes, S. C.; Vieira, I. C.; J. Pharm. Biomedical. Anal.2006, 41, 366.
28. Fernandes, S. C.; Oliveira, I. R. W. Z.; Vieira, I. C.; Enzyme Microb. Technol.2007, 40, 661.
29. Oliveira, I. R. W. Z.; Vieira, I. C.; Quim. Nova2006, 29, 932. 30. Oliveira, I. R. W. Z.; Vieira, I. C.; Enzyme Microb. Technol.
2006, 38, 449.
31. Agboola, B.; Nyokong, T.; Talanta2007, 72, 691.
32. Agboola, B.; Nyokong, T.; Anal. Chim. Acta2007, 587, 116. 33. Agboola, B.; Nyokong, T.; Electrochim. Acta2007, 52, 5039.
34. Agboola, B.; Westbroek, P; Ozoemena, K. I.; Nyokong, T.;
Electrochem. Comm.2007, 9, 310.
35. Sephlotho, N.; Nyokong, T.; Zagal, J. H.; Bedioui, F.;
Electrochim. Acta2006, 51, 5125.
Received: April 30, 2007
![Figure 1. Synthesis of the ligand N,N-[bis-(2-pyridylmethyl)]-N’,N’-[(2-hydroxybenzyl)(2-hydroxy-3,5-di-tert-butylbenzyl)]-1,3-propanediamine-2-ol (H 3 L)](https://thumb-eu.123doks.com/thumbv2/123dok_br/18992647.461184/3.892.154.766.940.1069/figure-synthesis-ligand-pyridylmethyl-hydroxybenzyl-hydroxy-butylbenzyl-propanediamine.webp)