Article
J. Braz. Chem. Soc., Vol. 26, No. 7, 1321-1330, 2015. Printed in Brazil - ©2015 Sociedade Brasileira de Química 0103 - 5053 $6.00+0.00
A
*e-mail: [email protected]
Ethanolysis Optimisation of Jupati (
Raphia taedigera Mart.
) Oil to Biodiesel Using
Response Surface Methodology
Leyvison R. V. da Conceição,a Carlos E. F. da Costa,a Geraldo N. da Rocha Filho,a
Edenir R. Pereira-Filhob and José R. Zamian*,a
aLaboratório de Catálise e Oleoquímica, Programa de Pós-Graduação em Química, Universidade Federal do Pará, 66075-110 Belém-PA, Brazil
bGrupo de Análise Instrumental Aplicada, Departamento de Química, Universidade Federal de São Carlos, P.O. Box 676, 13565-905 São Carlos-SP, Brazil
In this work, the transesterification of jupati (Raphia taedigera Mart.) oil using ethanol and
acid catalyst was examined. The production of biodiesel was performed using a central composite design (CCD). A range of values for catalyst concentration (1 to 4.21%), temperature (70-80 °C), and the molar ratio of alcohol to oil (6:1-13.83:1) were tested, and ester content, viscosity, and yield were the response variables. The synthesis process was optimised using response surface methodology (RSM), resulting in the following optimal conditions for the production of jupati ethyl esters: a catalyst concentration of 3.85% at 80 °C and an alcohol-to-oil molar ratio of 10:1.
Keywords: biodiesel, jupati oil, ethanolysis, optimisation, response surface methodology
Introduction
The gradual reduction in world oil reserves and the emission of greenhouse gases into the environment may result in energy insecurity and ecological imbalances in
the near future.1 Biodiesel is an environmentally friendly
alternative fuel that is easily available, non-inflammable
and non-toxic.2
Biodiesel is a mixture of fatty acid alkyl esters in which the esters are derived from renewable sources, such as vegetable oils or animal fats. Biodiesel can be directly used in compression-ignition engines (i.e., diesel engines) and can be obtained through a transesterification reaction (i.e., an alcoholysis reaction) of the raw materials in the presence of primary alcohols. This reaction is promoted by an acid or base catalyst, requiring an excess of alcohol
due to the reaction’s reversibility.3
Currently, edible oils provide the raw material for approximately 95% of manufactured biodiesel. Thus, compared with petroleum-based fuels, biodiesel is not
economically viable.4 In Brazil, soybean, palm kernel,
and sunflower oils represent the primary raw materials for
biodiesel.3 To decrease the competition between food and
fuel uses, oils that are not produced for dietary purposes
can be used as raw materials for biodiesel production.5
One possible solution to this problem would be the sustainable management of forests for the production of
oils from native non-commercial oilseed plants.6 In this
context, the investigation of alternative oil sources derived from Amazonian species is relevant.
Jupati (Raphia taedigera Mart.) is a typical Amazonian
oil seed. The plant is a palm tree that grows in flooded and swampy areas in the Brazilian Amazon, especially in Pará State. The ovoid-oblong jupati fruits are coated by
rhomboids, reddish-brown scaly-shaped structures.7
and also generate an increased quantity of waste. Thus, as acid catalysis do not form soaps they were used to produce the biodiesel. In order to produce a totally renewable fuel, ethanol was used, since it is completely renewable and substantially less toxic and harmful to the environment. However, the joint use of low-quality vegetable oil, ethanol, and acid catalysis hinders the production of biodiesel of good quality and with high yields. Thus, the large-scale biodiesel production generally uses good-quality raw material,
methanol, and alkaline catalysis.8,9
Response surface methodology (RSM) has been used to optimise various processes, including the transesterification
of vegetable oils.10 For example, the conversion of different
vegetable oils to biodiesel has been optimised by this
method.11-14 In all cases, only processes involving low
acidity vegetable oils, alkaline catalysts, and methanol have been studied.
Given these aspects, the experimental design and RSM were used to establish the best conditions for biodiesel synthesis through acid-catalysed transesterification of low-quality vegetable oil (coming from sustainable forest management) and ethanol.
Experimental
Reagents
Jupati oil was produced by the Multi-Product Cooperative of Santo Antônio (Cooperativa Multi-Produtos de Santo Antônio, CMSA), which is located in the municipality of Breves, Marajó Island, Pará, Brazil.
Anhydrous ethanol, anhydrous sodium sulfate, and sodium bicarbonate were purchased from specialised local stores. Methanesulfonic acid was donated by Agropalma S.A. Reagents were used without further purification.
Reagents and chromatographic standards, including
the fatty acid methyl ester (C4:0-C24:0), N
-methyl-N-trimethylsilyl-trifluoroacetamide (MSTFA), methyl
heptadecanoate (C17:0, 99.9%), tricaprin, and butanetriol, were purchased from Aldrich. Heptane was purchased from VETEC. All reagents were of analytical grade.
Physicochemical characterisation of jupati oil
The fatty acid composition of the jupati oil was determined by gas chromatography in accordance with the American Oil Chemists’ Society (AOCS) official method
Ce 1-62, as detailed in Conceição et al.3
The acid value, peroxide value, saponification value, unsaponifiable matter value, and the calculated iodine value were obtained according to AOCS official methods Cd
3d-63, Cd 8-53, Tl 1a-64, Ca 6b-53, and Cd 1c-85, respectively. The moisture was determined using AOCS official method Ca 38-2b. The density at 20 °C and the kinematic viscosity at 40 °C were determined using ASTM standards methods,
as mentioned in Conceição et al.3
Experimental design
The effects of the independent variables on the response variables were evaluated using RSM. The independent
variables were the catalyst concentration (X1) (in relation
to oil mass), reaction temperature (X2), and the molar ratio
of alcohol to oil (X3). The response variables were the ester
content (Y1), the viscosity (Y2), and the yield (Y3) of the
jupati biodiesel. The selection of factorial levels was based on the literature and the properties of the oil and the alcohol
used as raw materials.3 The Statistica software package
(Statsoft, v. 7) was used to analyse the results.
Two experimental designs were used (see details in Table 1) and a single model was obtained by combining the two experimental designs. In this case, the variables were normalised between −1 and +1, and the pure error was calculated with four degrees of freedom (experiments 9-11 and 16-18). The first set of experiments was configured
as a 23 design (experiments 1-11) with three replicates
of the central point (experiments 9-11), in which the transesterification of the jupati oil was carried out using catalyst concentrations of 1 (−1) or 2% (−0.38), reaction temperatures of 70 (−1) or 80 °C (1) and alcohol-to-oil molar ratios of 6:1 (level −1) or 9:1 (level –0.24). In the second design of experiments (experiments 12-22), we
used a central composite design (CCD) of 22 (experiments
12-15) with four axial points (experiments 19-22) and three replicates of the central point (experiments 16-18), thereby generating a second-order model in which the catalyst concentrations were 3 (0.25) or 4% (0.87), the reaction temperature was maintained at 80 °C (1) and the alcohol-to-oil molar ratios were 10:1 (0.02) or 12:1 (0.53).
Biodiesel production process
A heating mantle with stirring capability, a condenser, and a 500 mL round-bottom flask were used for the transesterification reactions.
Initially, 100 g of jupati oil were transferred into the flask and heated to 40 °C. Next, alcohol and catalyst, in quantities determined by the experimental design (Table 1), were transferred into the flask, and the reaction mixture was stirred at the desired temperature for 10 h.
upper phase) from the glycerol (the lower phase), which was discarded.
The biodiesel was washed with 50 mL of distilled water and 50 mL of a 5% solution of sodium bicarbonate to remove impurities, such as alcohol, catalyst, and residual glycerol. Then, the biodiesel was dried with anhydrous sodium sulfate (10% relative to the oil mass) and filtered through a sintered-glass frit. After the products were washed and dried, the stoichiometric yield of the reaction was determined, and the biodiesel was analysed.
Statistical analysis
RSM is a set of mathematical and statistical techniques that are useful to model and analyse problems when the goal is to optimise a response of interest that is influenced by
several variables.15,16 The first step of the RSM was to obtain
a mathematical model that describes the response variables
(Y1, Y2, and Y3) as a function of the independent variables
(X1, X2, and X3). The equation obtained from RSM considers
only the significant coefficients, as shown in equation 1:
2 0
1 1 1
k k k
i i ii i ij i j
i i i
Y β β X β X β X X e
= = <
= +
∑
+∑
+∑
+ (1)where Xi and Xj are the coded variables; β0 (intercept),
βi (linear coefficients), βii (quadratic coefficients), and
βij (interaction coefficients) are the model coefficients,
and e is the error. The model obtained from regression analysis was used to generate the response surface and contour plots. For the selection of the significant terms from the model, the significance level was set at 95% and
p < 0.05.
The second step was to determine the quality of the model, which was assessed by analysis of variance
(ANOVA) using an F-test.17
Physicochemical characterisation of the synthesised jupati ethyl biodiesel
The measured properties of the jupati ethyl biodiesel synthesised using the optimised experimental conditions are described below.
Table 1. Experimental design for the jupati oil ethanolysis
Experiment Variable Response
X1 / wt.% X2 / °C X3 Ester / % Viscosity / (mm2 s −1) Yield / %
1 1 −1 70 −1 6 −1 83.6 7.10 72.0
2 2 −0.38 70 −1 6 −1 87.0 6.50 74.9
3 1 −1 80 1 6 −1 85.0 6.30 75.8
4 2 −0.38 80 1 6 −1 95.0 5.30 79.6
5 1 −1 70 −1 9 −0.24 92.0 5.80 73.9
6 2 −0.38 70 −1 9 −0.24 88.0 5.90 83.4
7 1 −1 80 1 9 −0.24 94.0 5.80 84.4
8 2 −0.38 80 1 9 −0.24 99.4 4.50 86.3
9 1.5 −0.69 75 0 7.5 −0.62 98.2 4.90 85.5
10 1.5 −0.69 75 0 7.5 −0.62 97.7 4.60 86.5
11 1.5 −0.69 75 0 7.5 −0.62 97.9 4.80 85.1
12 3 0.25 80 1 10 0.02 98.5 4.60 91.2
13 4 0.87 80 1 10 0.02 99.8 4.10 93.3
14 3 0.25 80 1 12 0.53 99.2 4.20 92.4
15 4 0.87 80 1 12 0.53 98.7 4.20 91.4
16 3.5 0.56 80 1 11 0.28 98.5 4.50 89.5
17 3.5 0.56 80 1 11 0.28 98.6 4.50 90.6
18 3.5 0.56 80 1 11 0.28 98.8 4.20 91.1
19 2.79 0.12 80 1 11 0.28 98.9 4.10 90.5
20 4.21 1 80 1 11 0.28 99.1 4.30 91.9
21 3.5 0.56 80 1 8.16 −0.45 99.4 4.10 92.4
22 3.5 0.56 80 1 13.83 1 98.6 4.60 89.2
The reaction yield was calculated on the basis of the stoichiometry of the reaction using the average molar mass of the esters and the mass of biodiesel produced.
The ester content was determined by gas chromatography according to standard method EN 14103. The samples were analysed on a Varian CP 3800 chromatograph equipped with an auto injector and a flame ionisation detector (FID). A CP WAX 52 CB capillary column was used with the following features: 30 m length, 0.32 mm internal diameter, and 0.25 µm film thickness. Helium gas was
used as the mobile phase at a flow rate of 1.0 mL min−1.
The temperature program was T1 = 170 °C for 1 min,
R1 = 20 °C min−1, and T2 = 250 °C for 5 min.
The microcarbon residue was determined according to standard method ASTM D 4530 with an ALCOR microcarbon residue tester. The corrosiveness to copper was determined using ASTM D 130 with a Koehler copper corrosion test bath. The kinematic viscosity at 40 °C was determined according to ASTM D 445 using an ISL automatic viscometer (model VH1). The acid value was determined according to standard method EN 14104.
The contents of free glycerine, total glycerine, and mono-, di-, and triglycerides were determined by gas chromatography according to standard method ASTM D 6584 on a Varian CP 3800 chromatograph equipped with an auto injector and an FID. A Varian CP 9079 capillary column was used with the following features: 15 m length, 0.32 mm internal diameter, and 10 µm film thickness. Helium gas was used as the mobile phase at a flow rate of
1.0 mL min−1. The temperature program was T
1 = 50 °C
for 1 min, R1 = 15 °C min−1, T2 = 180 °C, R2 = 7 °C min−1,
T3 = 230 °C, R3 = 30 °C min
−1, and T
4 = 380 °C for 10 min.
The sulfated ash content was determined according to standard method ASTM D 874 using a Linn-Electro Therm muffle furnace.
The flash point was determined according to standard method ASTM D 93 using a Tanaka automated Pensky-Martens closed-cup flash-point tester (model APM 7). The density at 20 °C was determined according to ASTM D 4052 using a KEM automated density meter (model DA-500).
Results and Discussion
Physicochemical characterisation of jupati oil
Jupati oil has three major fatty acids: C18:1 oleic (47.5%), C16:0 palmitic (32.0%), and C18:2 linoleic (19.0%). The high concentration of unsaturated fatty acids (approximately 67%) facilitates the oxidation, which explains the high
peroxide value determined for the oil (16.0 mEq O2 kg−1).
The measured acid value of 10.0 mg KOH g−1 indicated
that acid catalysis should be used because the employment of a basic catalyst would require an additional step for oil
neutralisation.18 Therefore, base catalysis was not adopted
because our goal was to develop an alternative approach in which the oil could be used under the same conditions under which it is produced in the cooperative, without further treatment.
The measurement results of the other important properties
were as follows: saponification value (193.0 mg KOH g−1),
unsaponifiable matter (2.7%), moisture (1%) and iodine value (75.0).
Optimisation of reaction conditions by RSM
In this study, the relationship between the response variables (yield, viscosity, and ester content) and the
independent variables (catalyst concentration (X1),
temperature (X2), and molar ratio (X3)) was determined
using RSM. The results of each experiment of experimental design are shown in Table 1.
Regression analysis was used to fit the empirical model
to the data from the response variables.19 The response
variables were correlated with the three independent variables using the polynomial equation shown in equation 1. The fitted models obtained for the ester content
(Y1), the viscosity (Y2), and the yield (Y3) as functions of
the significant independent variables are shown in equations 2, 3, and 4, respectively.
Y1 = 101.04 – 2.65X1 + 5.75X2 – 7.96X22 + 2.19X3 +
1.64X3
2 + 4.18X
1X2 – 9.45X1X3 + 0.56X2X3 (2)
Y2 = 3.98 – 0.66X2 + 1.1X2
2 – 0.41X
3 – 0.57X1X2 (3)
Y3 = 93.36 + 5.4X1 + 2.55X2 – 6.23X2
2 – 3.47X
3 (4)
The goodness-of-fit of models Y1, Y2, and Y3 were
verified by the coefficients of determination R2
(Y1) = 0.9645,
R2
(Y2) = 0.9656, and R
2
(Y3) = 0.9643 and the adjusted
coefficients of determination Adj R2
(Y1) = 0.9380,
Adj R2
(Y2) = 0.9398 and Adj R
2
(Y3) = 0.9375. These R
2 values
indicate that 96.45, 96.56, and 96.43% of the variability in the response variables, respectively, is explained by these models. Less than 4% of the total variability is not explained by the models. The data in Table 2 demonstrate that the models can be considered statistically significant according to the F-test at a 95% confidence level. The F-values (ratios
between mean squares of regression and residue) of Y1,
Y2, and Y3 are 36.2, 35.6, and 36.0, respectively, and are
For the calculated coefficients to be statistically
significant, their corresponding p values should be less
than 0.05 at a 95% confidence level. Pareto charts obtained from the experimental design are shown in Figures 1a-c for the ester, the viscosity, and the yield, respectively. The effects of the variables and their interactions are increasingly significant as they move further right of the dashed vertical line.
According to Figure 1a, the variables X2(Q) and X2(L)
displayed the greatest effect on the ester content of the biodiesel. Their respective values, −53.4 and 33.2, were the highest among the determined values. Notably, increasing the temperature from the lowest level to the highest level yielded an average increase in the ester content of 11.5%.
The interactions X1X3 and X1X2 and the variables X1(L)
and X3(L) were found to have a significant effect on the
ester content of the biodiesel. Their values were −23.8, 20.2, −12.5, and 11.8, respectively. An increase in variable
X3(L) caused an average increase of 4.39% in the ester
content of the biodiesel. The interaction X2X3 had little
effect, and the variable X1(Q) was not significant at a 95%
significance level.
In Figure 1b, only the variables X2(Q) and X2(L) and
the interaction X1X2 were found to be significant for the
viscosity of the biodiesel. Their values were 9.4, −4.9, and −3.5, respectively. Variation of the temperature produced a 2.2% decrease in viscosity. Figure 1c shows that only
the variables X2(Q), X1(L), X2(L), and X3(Q), with values
of −11.3, 6.9, 4.0, and −3.5, respectively, were found to have a significant effect on biodiesel yield. Two values stood out: an average increase of 10.8% in yield when the catalyst concentration was changed and an average increase of 5.10% in yield when the temperature was increased.
Figures 2a, 2b, and 2c show the values that were
obtained experimentally vs. the values that were predicted
by the models shown in equations 2, 3, and 4, respectively.
Their respective correlations of R2 = 0.9645, 0.9656, and
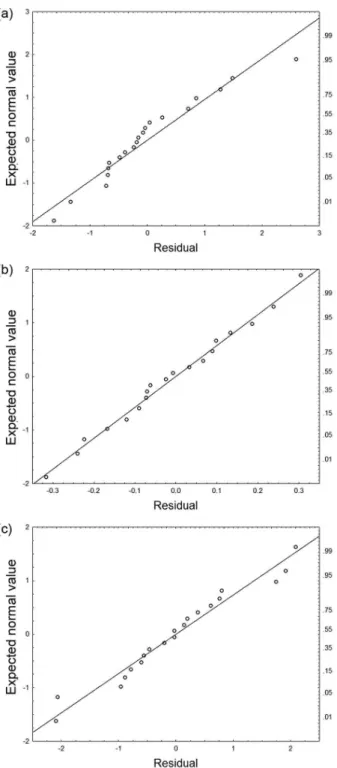
0.9643 demonstrate that the regression models accurately describe the experimental data in the study intervals. Figures 3a-c show that the residuals are distributed normally along the lines and have positive and negative deviations in the same proportion, which indicate that the
errors are not biased and are negligible.20
Figure 4 shows the response surface and contour plots for the effects of the catalyst concentration and temperature on the ester content, viscosity, and yield. Figures 4a and 4b show response surface and contour plots for the response variables ester content and viscosity, respectively. The ester and the viscosity exhibited the same behavior, and any catalyst concentration can be effectively used. However, the temperature must be greater than 72 °C to obtain high ester content (region 95-100%, bounded by the darker
region in Figure 4a) and low viscosity (region 3-5 mm2 s−1,
bounded by the dark central region in Figure 4b). As shown Table 2. Analysis of variance (ANOVA) for the quadratic model
Source Sum of squares Degree of freedom Mean square F-value F0.05
Ester model
Regression 537.61 9 59.73 36.2 2.8
Residual 19.77 12 1.65 – –
Lack-of-fit 19.60 8 2.45 61.25 6.04
Pure error 0.17 4 0.04 – –
Totals 557.38 21 – – –
Viscosity model
Regression 16.03 9 1.78 35.6 2.8
Residual 0.57 12 0.05 – –
Lack-of-fit 0.46 8 0.06 2.0 6.04
Pure error 0.11 4 0.03 – –
Totals 16.60 21 – – –
Yield model
Regression 903.93 9 100.44 36.0 2.8
Residual 33.48 12 2.79 – –
Lack-of-fit 31.10 8 3.89 6.48 6.04
Pure error 2.38 4 0.60 – –
in Figure 4c, increases in the catalyst concentration and temperature result in high yields. The highest yields (greater than 95%) are observed when the catalyst concentration is greater than 3.2% and the temperature is 75 °C. The darker region denotes where higher yields can be obtained. A
similar trend was also observed by Bouaid et al.21 in their
study on the production of ethyl esters from vegetable oils. The combined effect of the independent variables catalyst concentration and molar ratio on the ester content,
the viscosity, and the yield (i.e., the response variables) is illustrated in Figures 5a, 5b, and 5c, respectively. Figure 5a shows that a high ester content (greater than 99%) is obtained when a molar ratio greater than 9:1 is used in conjunction with catalyst concentrations greater than 2%. Moreover, the ester content increases with increasing catalyst concentration and decreases (to values less than 95%) when the maximum and minimum values of the molar ratio and catalyst concentration are used. The Figure 1. Pareto charts for (a) the ester content; (b) the viscosity; (c) the
yield. X1: Catalyst concentration, X2: reaction temperature, X3: molar ratio of alcohol to oil, Q: quadratic and L: linear.
effect of the catalyst concentration and molar ratio on the viscosity displays the same trend as their effect on the ester content. The best viscosity values were obtained when catalyst concentrations between 3.4 and 4.2% and molar ratios between 11:1 and 13.8:1 were used (Figure 5b). Figure 5c shows that higher yields were obtained with
increasing molar ratios. Similarly, Cavalcante et al.22
found that the best yields for the production of ethyl esters of castor oil were obtained when the molar ratio
was increased. This same trend was also found for the catalyst concentration. Therefore, high yields (greater than 90%) are obtained when the catalyst concentration exceeds 3% and when the molar ratio is greater than 10:1. Lower values for these variables result in lower and less desirable yields.
Figure 6 shows the combined effects of the temperature and the molar ratio on the response variables. Figure 6a shows that any molar ratio value can be used to obtain a high ester content (greater than 99%) if the reaction temperature is between 74 and 80 °C. The ester content increases with increasing temperature. However, a decrease in the ester content is observed at temperatures greater than 80 °C. This, perhaps, is due to the fact that Figure 3. Normal probability plots of the residuals for (a) the ester content;
(b) the viscosity; and (c) the yield.
Figure 6. Response surface and contour plots for (a) the ester content; (b) the viscosity; and (c) the yield vs. the temperature and the molar ratio.
Figure 5. Response surface and contour plots for (a) the ester content; (b) the viscosity; and (c) the yield vs. the catalyst concentration and the molar ratio.
the transesterification reaction is reversible. Higher temperatures would increase the amount of ethanol in the gas phase, favoring the ester hydrolysis. Figure 6a shows an optimum effect when the reaction temperature is 77 °C and the molar ratio is greater than 10:1. As shown in Figure 6b, viscosity decreases with increasing temperature. The optimum viscosity is reached at a reaction temperature between 74 and 78 °C and at molar ratios greater than 11:1. The curvature of the surface plot (Figure 6c) reveals a significant interaction between the temperature and the molar ratio and their effect on the yield. High yields (greater than 90%) are obtained in the
central region of the plot, where the temperature is 76 °C and the molar ratio is 11:1.
Two experiments were performed to test the predictive ability of the proposed models. Table 3 shows the reaction conditions of the experiments, the responses obtained, and the relative error values between the real and predicted responses. The reaction conditions selected for use in the validation experiment are close to the optimal conditions.
Table 3. Model validation results
Experiment
Condition Result
X1 X2 X3
Ester / % Viscosity / (mm2 s−1) Yield / %
a b c a b c a b c
1 3.7 80 10.17 99.5 99.62 0.12 4.1 4.0 −2.5 92.1 93.1 1.11
2 3.8 80 11.05 98.8 98.84 0.04 4.2 3.9 −7.7 91.0 92.7 1.83
X1: Catalyst concentration (%); X2: reaction temperature (°C); X3: molar ratio of alcohol to oil; a: obtained values; b: predicted values by the models (equations 2-4); c: relative errors (%).
Physicochemical properties of the synthesised jupati biodiesel
The properties of jupati biodiesel were determined to assess the fuel’s quality, and the biodiesel was produced using the optimal conditions predicted by the model: a catalyst concentration of 3.85%, a temperature of 80 °C, and a molar ratio of 10:1. The jupati biodiesel production process exhibited an excellent yield (93.5%). The ester content was 99.75%, which indicates a high level of product purity. Other important properties that demonstrate the quality of the synthesised fuel are the contents of free glycerine (0.011% mass) and total glycerine (0.103% mass), monoglycerides (0.309% mass), diglycerides (0.071% mass), and triglycerides (0.011% mass).
The acid value (0.44 mg KOH g−1), corrosiveness
to copper (1), and microcarbon residue (0.01% mass) results are satisfactory, which is important because acid catalysis was used in this study and could negatively affect these properties. Additionally, the kinematic viscosity
(4.0 mm2 s−1), density (870.1 kg m−3), and flash point
(182 °C) demonstrate the excellent quality of the biodiesel produced.
Conclusions
The results obtained in this study using RSM to determine the effects of three reaction variables - the catalyst concentration, temperature, and molar ratio - on the ester content, viscosity, and yield of jupati biodiesel using ethanolysis indicate that the biodiesel produced had excellent fuel properties. The optimal conditions for the selected transesterification variables, as predicted by the statistical model, were a catalyst amount of 3.85 wt.%, a temperature of 80 °C, and a molar ratio of 10:1, with an actual jupati biodiesel ester content of 99.75%, a viscosity
of 4.0 mm2 s−1, and a yield of 93.5%. Therefore, this study
supports the use of RSM in optimising the production of biodiesel and shows that satisfactory and feasible production conditions can be achieved even when the acid catalysis, ethanol, and low-quality vegetable oil are used.
Supplementary Information
Supplementary data (ester content and glycerol chromatograms) are available free of charge at http://jbcs.sbq.org.br as PDF file.
Acknowledgements
The authors would like to thank the Chemistry Graduate Program of the Federal University of Pará, the Catalyst and Oleo-Chemistry Laboratory (LCO), the Fuel Research and Analysis Laboratory (LAPAC), Centrais Elétricas Brasileiras (ELETROBRAS), and the Brazilian agency Coordenação de Aperfeiçoamento de Pessoal de Nível Superior (CAPES) for financial support.
References
1. Knothe, G.; Prog. Energy Combust. Sci.2010, 6, 364. 2. Fadhil, A. B.; Abdulahad, W. S.; Energy Convers. Manage.
2014, 77, 495.
3. Conceição, L. R. V.; Costa, C. E. F.; Rocha Filho, G. N.; Zamian, J. R.; Fuel2011, 90, 2945.
4. Meher, L. C.; Vidya, S. D.; Naik, S. N.; Renewable Sustainable Energy Rev. 2006, 10, 248.
5. Helwani, Z.; Aziz, N.; Bakar, M. Z. A.; Mukhtar, H.; Kim, J.; Othman, M. R.; Energy Convers. Manage.2013, 73, 128. 6. Balat, M.; Energy Convers. Manage.2011, 52, 1479.
7. Pesce, C.; Oleaginosas da Amazônia, 2ª ed.;Museu Paraense Emílio Goeldi: Belém, 2009, p. 147.
8. Stamenković, O. S.; Veličković, A. V.; Veljkovic, V. B.; Fuel
2011, 90, 3141.
9. Monteiro, M. R.; Ambrozina, A. R. P.; Lião, L. M.; Ferreira, A. G.; Talanta2008,77, 593.
10. Tiwari, A. K.; Kumar, A.; Raheman, H.; Biomass Bioenergy
2007, 31, 569.
11. Rashid, U.; Anwar, F.; Ashraf, M.; Saleem, M.; Yusup, S.;
Energy Convers. Manage.2011, 52, 3034.
12. Kiliç, M.; Uzun, B. B.; Pütün, E.; Pütün, A. E.; Fuel Process. Technol. 2013, 111, 105.
14. Ahmad, J.; Yusup, S.; Bokhari, A.; Kamil, R. N. M.; Energy Convers. Manage.2014, 78, 266.
15. Montgomery, D. C.; Design and Analysis of Experiments, 5th ed.;
Wiley: New York, 1997.
16. Hameed, B. H.; Lai, L. F.; Chin, L. H.; Fuel Process. Technol.
2009, 90, 606.
17. Box, G. E. P.; Hunter, W. G.; Hunter, J. S.; Statistic for Experimenters: An Introduction to Design, Data Analysis and Model Building; Wiley: New York, 1978.
18. Leung, D. Y. C.; Guo, Y.; Fuel Process. Technol. 2006, 87, 883. 19. Mason, R. L.; Gunst, R. F.; Hess, J. L.; Statistics Design and
Analysis of Experiments: With Applications to Engineering and Science; Wiley: New York, 1989.
20. Lee, H. V.; Yunus, R.; Juan, J. C.; Taufiq-Yap, Y. H.; Fuel Process. Technol. 2011, 92, 2420.
21. Bouaid, A.; Martinez, M.; Aracil, J.; Chem. Eng. J. 2007, 134, 93.
22. Cavalcante, K. S. B.; Penha, M. N. C.; Mendonça, K. K. M.; Louzeiro, H. C.; Vasconcelos, A. C. S.; Maciel, A. P.; Souza, A. G.; Silva, F. C.; Fuel2010, 89, 1172.
Submitted: December 17, 2014 Published online: April 24, 2015