Article
Printed in Brazil - ©2016 Sociedade Brasileira de Química0103 - 5053 $6.00+0.00*e-mail: [email protected]
Novel Non Enzymatic TBHQ Modified Electrochemical Sensor for Hydrogen
Peroxide Determination in Different Beverage Samples
Navid Nasirizadeh,*,a,b Masoud Ghaani,c Zahra Shekaria and Mohammad Shateri-Khalilabadb
aScientific Society of Nanotechnology, bDepartment of Textile and Polymer Engineering and cDepartment of Food Science and Technology, Yazd Branch, Islamic Azad University, Yazd, Iran
A nanosensor was developed for hydrogen peroxide determination based on nafion/graphene oxide/silver nanoparticles/tertiary butylhydroquinone (TBHQ) modified glassy carbon electrode (N-GO/AgNPs/TBHQ/GCE). Cyclic voltammetry was used to investigate the electrochemical behavior of this modified electrode and differential pulse voltammetry was used for the reduction of H2O2. The limit of detection was 0.46 µmol L-1 and three linear calibration ranges were obtained
for H2O2 determination from 1.52-9.79 µmol L
-1 for first linear segment, 9.79-231.0µmol L-1 for
second linear segment and 231.0-8330.0 µmol L-1 for third linear segment. Finally, the reliability
of the nanosensor was confirmed in the real sample analysis in different beverages with satisfactory results.
Keywords: hydrogen peroxide, tertiary butylhydroquinone (TBHQ), graphene oxide, silver nanoparticle, electrocatalytic reduction
Introduction
tert-Butylhydroquinone (TBHQ) is a well-known
food-grade antioxidant, which has been applied as an efficient preservative for unsaturated vegetable oils, abundant meat products and edible animal fats at low
concentrations (less than 0.02%).1 The presence of
TBHQ does not change the flavor, odor and color of
the material which it is added to.2 This compound is a
derivative of hydroquinone by substitution of tert-butyl group. Numerous surface modified electrodes with compounds containing a hydroquinone moiety have been studied. Modified electrodes with hydroquinone can be used in the studying of electrocatalytical oxidation or reduction of different materials such as hydrogen peroxide (H2O2).
H2O2 forms during catalyzed reactions by different
oxidase in many biological and environmental processes.3
This compound regards as an elemental key in many different applications such as clinical, chemical, biological, food production and also it is widely used in pulp and paper bleaching, sterilization and many other industries.4
Especially in food industry, H2O2 is used for sterilizing
and cleaning equipments applied for mixing, transporting
and packing.3 The other aspect of H
2O2 importance is in
diary industry. This compound is known as an antibacterial agent in milk and it should be removed by the use of some catalase before milk to cheese microbiological
transformation.5 Also, H
2O2 is often produced as a
by-product of some enzyme reactions, hence knowledge about reaction forward is up to determine the amount of produced H2O2.6 Thus determination of this compound has
a great point of interest. Many methods have been used for determination of H2O2 such as chemiluminescence,7
chromatography,8 fluorimetric9 and spectrophotometric.10
However electrochemical sensors based on chemically modified electrodes were known as more reliable, selective and sensitive method with lower cost and ease of use and fast response time.11
From the analytical point of view direct reduction
of H2O2 at bare electrode is not working properly
because of low kinetic and high over potential necessary for H2O2 reduction on different electrode materials.12
Applying modified electrodes equipped with appropriate electrocatalyst such as hydroquinone derivative, is one way to deal with this problem and decrease the over-potential for H2O2 reduction reaction.4 In addition, various enzymes
are widely used for H2O2 determination because of its
good sensitivity and selectivity.13 But most of them are not
consequence, number of studies were done on the use of non-enzymatic sensors to decrease their limit of detection and extend their respond range.15
Recently, noble nanomaterials have been widely used in analytical electrochemistry due to their high surface area, excellent biocompatibility, good conductivity and adsorption ability.16 Silver nanoparticles (AgNPs) is one
of these nanomaterials that used as catalyst in different reactions.17 Graphene oxide (GO) is another nanomaterial
that applied for modification of electrode surfaces because of its large surface area, perfect conductivity, excellent chemical stability and easy fabrication.18
In this paper an enzyme free electrochemical sensor was fabricated based on the immobilization of TBHQ on silver nanoparticles deposited on graphene oxide and used for determination of H2O2 concentration. The
electrochemical behavior of nafion/graphene oxide/silver nanoparticles/TBHQ modified glassy carbon electrode (N-GO/AgNPs/TBHQ/GCE) is investigated. Moreover, the electrochemical properties of this modified electrode for determination of H2O2 is studied. Finally, this sensor
has been used for the determination of the H2O2 amount
in different real samples.
Experimental
Reagents and apparatus
H2O2 solution (30%), nafion, H2SO4 (98%), KMnO4,
HCl (37%), silver nitrate (99.8%), TBHQ and the other chemical reagents used for preparation of the buffer solutions were purchased from Merck and used as received. The phosphate buffer solutions (0.1 mol L-1) were prepared
with phosphoric acid and NaOH. GO was synthesized by the improved Hummers method.19-21 Transmission electron
microscopy (TEM) characterization of the graphene oxide nanosheets was performed using a microscope LEO 912AB. A droplet of graphene oxide dispersion was cast onto a TEM copper grid and the solvent was evaporated overnight at room temperature.
Electrochemical experiments were performed with a µ-Autolab potentiostat (Eco Chemie Utrecht) with GPES 4.9 software. The cell was equipped with a N-GO/AgNPs/TBHQ/GCE as a working electrode, a platinum electrode as an auxiliary electrode and a
Ag/AgCl/3 mol L-1 KCl as a reference electrode. The
pH measurement was performed with a Metrohm model 691 pH/mV meter. The morphological features and surface characteristics of the GO/AgNPs/TBHQ were studied using a scanning electron microscope (SEM) unit (HITACHI-3000 SH Model).
Preparation of modified electrodes
The working electrodes were prepared as following procedure. At first, GCE was carefully polished mechanically with 0.05 µm of Al2O3 slurry on a polishing cloth and then
rinsed with doubly distilled water. After cleaning, it was immersed in a 0.1 mol L-1 sodium bicarbonate solution and
was activated by a continuous potential cycling from −1.45 to 1.7 V at a sweep rate of 100 mV s-1. According to the
literature, during activation of the GCE surface, carboxyl and hydroxyl active groups are formed on the GCE surface.22,23
Therefore, the existence of electronegative active atoms such as fluorine and oxygen on nafion, as well as the presence of carboxyl and hydroxyl groups on the GO, suggests that activation on the electrode surface result in formation of suitable interactions in order to better immobilize two compounds (GO and nafion) on the electrode surface.
For preparation of nafion-graphene oxide modified glassy carbon electrode (N-GO/GCE) 2 µL of a homogenized nafion-graphene oxide mixture (1 mg per 5 mL) was placed directly on to the activated GCE surface and dried at room temperature to form a graphene film at the GCE surface. Then, the N-GO/GCE was modified by a continuous potential cycling from −0.7 to 1.9 V at a sweep rate of 80 mV s-1 for 8 cycles in a solution containing 1 mmol L-1
AgNO3 and 100 mmol L-1 nitric acid. As a final point, the
modified electrode was rinsed with doubly distilled water and dried in air to give a silver nanoparticles modified
N-GO/GCE (N-GO/AgNPs/GCE).24 For the fabrication
of N-GO/AgNPs/TBHQ/GCE, the N-GO/AgNPs/GCE was rinsed with doubly distilled water and was modified by 8 cycles of potential sweep between −230 and 70 mV
at 20 mV s-1 in a 1.0 mmol L-1 solution of TBHQ in a
0.1 mol L-1 phosphate buffer solution (pH 7.0) (Scheme 1).
The AgNPs/TBHQ/GCE was prepared by the same procedure for N-GO/AgNPs/TBHQ/GCE without graphene oxide. Moreover, TBHQ modified GCE (TBHQ/GCE) and N-GO/TBHQ/GCE were prepared by same procedure as N-GO/AgNPs/TBHQ/GCE preparation, but without graphene oxide and silver nanoparticles, and without silver nanoparticles, respectively. Before every cyclic voltammetry (CV) experiments, the elimination of oxygen was performed via nitrogen purge based on previously published protocol.25
Results and Discussion
TEM imaging results
sheet was several micrometers in dimension with the wrinkled (rough) surface texture. High-resolution TEM micrograph clearly illustrated the amorphous nature of the graphene oxide nanosheet.
Electrochemical behavior of N-GO/AgNPs/TBHQ/GCE
The cyclic voltammograms obtained for N-GO/TBHQ/ GCE (Figure 2a), AgNPs/TBHQ/GCE (Figure 2b), and
N-GO/AgNPs/TBHQ/GCE (Figure 2c), at 20 mV s-1, in
0.1 mol L-1 phosphate buffer solution (pH 7.0) containing
no deliberately added electroactive materials, are depicted in Figure 2. As it can be seen, for N-GO/TBHQ/GCE (Figure 2a) and AgNPs/TBHQ/GCE (Figure 2b), with low peak currents, relatively high peak separations, low capacitance currents and for N-GO/AgNPs/TBHQ/GCE a pair of well-defined redox couple of TBHQ (Figure 2c) with high peak response, low peak potential separation and relatively high capacitance currents are observed, suggesting that the reversibility of TBHQ is significantly improved. Additionally, in order to provide a comparison, the sensor was prepared without addition of TBHQ onto
the surface (Figure 2d). As it can be seen in Figure 2d, in absence of TBHQ (in our investigation potential range) there is no peak relating to redox of the agents and this observation can show properly that function of sensor by the immobilized TBHQ at the surface of N-GO/AgNPs/GCE. The increase of the peak currents and decrease of the peak potential separation for N-GO/AgNPs/TBHQ/GCE, indicate that the reversibility of TBHQ is improved at the N-GO/AgNPs surface. Also, we deduced that N-GO/AgNPs composition will increase the surface area of the modified electrode, so the background voltammetric response (capacitance current) and sensitivity of N-GO/AgNPs modified surface are higher than those for the N-GO, and AgNPs modified surfaces. Therefore, N-GO/AgNPs can be used as a new material for immobilizing and electron transfer reactions of TBHQ.
Figure S1 (see Supplementary Information section), indicates the cyclic voltammograms of N-GO/AgNPs/
TBHQ/GCE in a 0.1 mol L-1 phosphate buffer (pH
7.0) at various scan rates (5-95 mV s-1). Figure S1a,
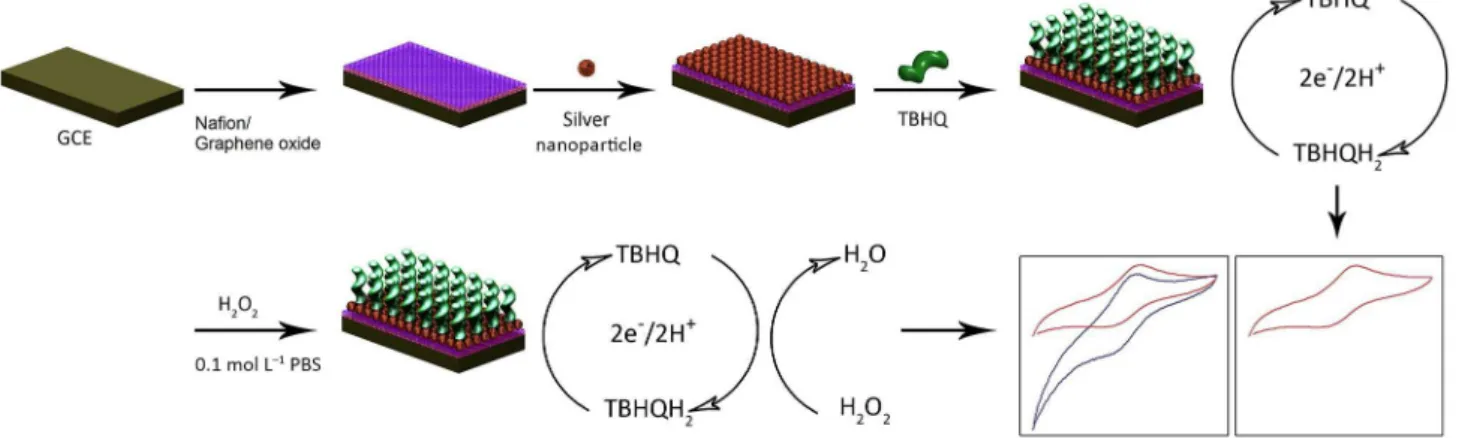
Scheme 1. Schematic diagram for the sensor fabrication and determination of H2O2.
Figure 1.TEM image of synthesized graphene oxide nanosheets.
-0.8 -0.3
(a)
(c) (b) (d) 0.2
0.7
-0.25 -0.14 -0.03 0.08
I / µA
E / Vvs.Ag/AgCl
shows the anodic and the cathodic peak currents (Ipa
and Ipc) values versus the potential scan rates. The
linearity dependence indicates that the nature of the redox process is diffusion less controlled. Also, when the potential was scanned between −230 and 70 mV, a surface immobilized redox couple with a formal
potential (E0’) value of −83 mV was observed for
N-GO/AgNPs/TBHQ/GCE. Moreover, the formal potential, E0’, is almost independent of the potential scan
rate for scan rates ranging from 5 to 150 mV s-1, suggesting
facile charge transfer kinetics over this range of scan rates. The studies on peak to peak potential separation (∆Ep = Epa − Epc) variation as a function of scan rate on the
N-GO/AgNPs/TBHQ/GCE exhibit that ∆Epis almost
constant within the range of 5-150 mV s-1 (Figure S1b).
At high scan rates, the separation between peak potentials increases with increasing scan rates (Figure S1c), indicating the limitation arising from charge transfer kinetics. The surface charge transfer rate constant, ks, and
the charge transfer coefficient, α, for the electron transfer between the electrodeposited TBHQ and N-GO/AgNPs were estimated from the variation of the oxidation and reduction peak potentials with the sweep rate according to the procedure of Laviron.26 This theory predicts a linear
dependence of Ep upon log ν for high scan rates, which can
be used to extract the kinetic parameters of α and ks from
the slope and intercept of such plots, respectively. Transfer coefficient, α, can range from zero to one, which is as an indicator of the symmetry of the barrier to reaction.27 The
large value of ks indicates that the charge transfer rate on
the surface of N-GO/AgNPs/TBHQ/GCE is high. From the values of ∆Ep corresponding to different potential
scan rates of 900-3000 mV s-1, an average value of k s and
α were obtained, 6.15 ± 0.150 s-1 and 0.52, respectively.
The obtained ks value is higher than the previously
reported values for other works such as ks = 6.3 and
6.0 s-1.28
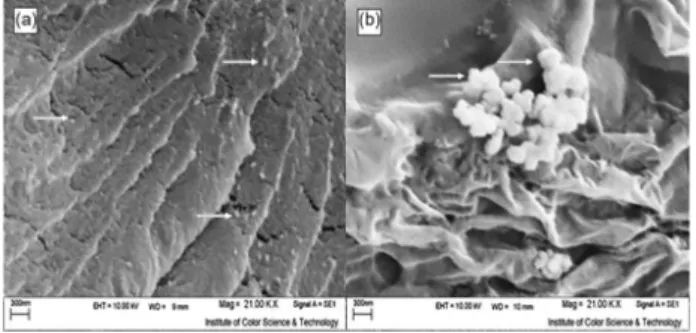
Characterization of the surface morphology of N-GO/ AgNPs/TBHQ/GCE
The surface morphologies of different electrodes were characterized by SEM, since the morphology was also related to the performance of the electrode. Figure 3 shows the morphologies of N-GO/AgNPs/GCE (Figure 3a) and N-GO/AgNPs/TBHQ/GCE (Figure 3b). Figure 3a shows that AgNPs is successfully immobilized on the electrode surface of N-GO/GCE after electrochemical deposition. Figure 3b shows that TBHQ has been completely immobilized on the electrode surface of N-GO/AgNPs/GCE.
Electrocatalytic reduction of H2O2 at the N-GO/AgNPs/
TBHQ/GCE
In order to test the electrocatalytic activity of the N-GO/AgNPs/TBHQ/GCE, the cyclic voltammograms at N-GO/TBHQ/GCE (Figure 4A), AgNPs/TBHQ/GCE (Figure 4B), and N-GO/AgNPs/TBHQ/GCE (Figure 4C) were obtained in the absence and presence of 0.3 mmol L-1
of H2O2. Afterwards, the results were compared with the
cyclic voltammogram of N-GO/TBHQ/GCE (Figure 4A, curve a), AgNPs/TBHQ/GCE (Figure 4B, curve a) and N-GO/AgNPs/TBHQ/GCE (Figure 4C, curve a) in supporting electrolyte at pH 7.0. A comparison of the peak potential of the cyclic voltammograms of the
N-GO/AgNPs/TBHQ/GCE in the presence of H2O2
(Figure 4C, curve b) with the peak potentials of the modified electrode in the supporting electrolyte (pH 7.0) (Figure 4C, curve a) illustrates that, after the addition of H2O2, a drastic enhancement occurs in the cathodic
peak current, and a very small current is observed in the anodic scan. This behavior is consistent with a very strong electrocatalytic effect. Similar results are observed for N-GO/TBHQ/GCE and AgNPs/TBHQ/GCE
in a 0.1 mol L-1 phosphate buffer solution (pH 7.0) in
the absence (Figure 4A, curve a and Figure 4B, curve a),
and the presence of 0.3 mmol L-1 H
2O2 (Figure 4A,
curve b and Figure 4B, curve b). But, as it can be seen, at N-GO/AgNPs/TBHQ/GCE, the reduction of H2O2 gives rise to a typical electrocatalytic response at
−97 mV (Figure 4C, curve b), with an cathodic peak current that is greatly enhanced over that observed
for the AgNPs/TBHQ/GCE (Figure 4B, curve b), and
N-GO/TBHQ/GCE (Figure 4A, curve b).
In addition, the cathodic peak potential for the reduction
of H2O2 at N-GO/AgNPs/TBHQ/GCE (Figure 4A, curve b),
is at −97 mV, while at AgNPs/TBHQ/GCE (Figure 4B, curve b) and N-GO/TBHQ/GCE (Figure 4C, curve b), H2O2 is reduced at the potential of −109 and −142 mV,
respectively. So, a decrease in the over-potential and a
dramatic enhancement of the peak current occur for H2O2
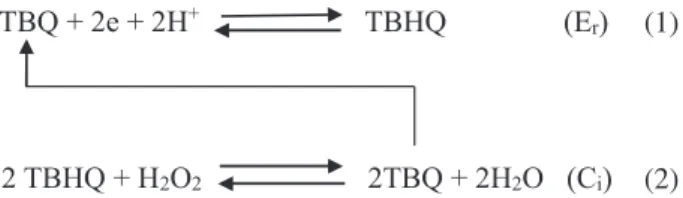
at the N-GO/AgNPs/TBHQ/GCE surface. Indeed, in the first step the immobilized TBHQ at the surface of electrode participates in oxidation reaction in positive potentials and converts to TBQ, therefore, at the beginning of cyclic voltammograms all the immobilized TBHQ converts to TBQ which these TBQ at the potential of −97.0 mV (Figure 4, curve a) leads to cathodic current. In reverse cycle the formed TBHQ at the surface of electrode converts to TBQ by applying potential of −55.0 mV and anodic current observes. Figure 4 (curve a) shows the process of redox reaction TBHQ. The equation 1 is mentioned as semi reversible electrochemical reaction (Er). While
in the presence of H2O2 by applying cathodic potential
TBQ converts to TBHQ. Some of generated TBHQ at the surface of electrode with H2O2 participates in oxidation
process and again converts to TBQ. Based on equation 2, generated TBQ at the surface of electrode participates in reduction process and leads to increase in cathodic current. On the other hand some of TBHQ oxidized in this step and, therefore, in reverse step, by decreasing the amount of TBHQ, anodic current decreases towards the previous step (absence of H2O2). This mechanism is “ErCi'”basedon
mentioned concepts. Thus, based on this result, the catalytic mechanism can be expressed as shown in equations 1 and 2.
(1)
(2)
The data obtained clearly indicate that the combination of TBHQ, N-GO and AgNPs definitely improve the characteristics of H2O2 reduction. The electrocatalytic
reduction characteristics of H2O2 at various modified
electrode surfaces at pH 7.0 are summarized in Table S1 (see Supplementary Information section).
The effect of scan rate on the electrocatalytic
reduction of H2O2 at the N-GO/AgNPs/TBHQ/GCE was
investigated at various scan rates by cyclic voltammetry in a 0.1 mol L-1 phosphate buffer solution (pH 7.0) containing
0.30 mmol L-1 H
2O2. The plot of peak current (Ip) against
square root of scan rate (v1/2), in range of 6-24 mV s-1
(Figure S2a), was found to be linear, suggesting that at sufficient over-potential the process is diffusion rather than surface controlled. These results exhibit that the overall electrochemical reduction of H2O2 at the modified electrode
might be controlled by a cross-exchange process operating between the redox site of N-GO/AgNPs/TBHQ/GCE and the diffusion of H2O2. For such mechanism and derived a
relationship between the peak current and the concentration of the substrate for a case of a slow scan rate, v, and a large catalytic rate constant, k’, which is the catalytic rate
constant between N-GO/AgNPs/TBHQ/GCE and H2O2,
thus, this value of k’ explains a good catalytic feature for
the oxidation of H2O2 at N-GO/AgNPs/TBHQ/GCE. The
higher k’ value shows higher rate of electron transfer and with the increase in rate of electron transfer the cathodic peak current and sensitivity of determination would be increased. Andrieux and Saveant29 developed a theoretical
model for a heterogeneous catalysis:
Icat = 0.49nFACb(nFADv/RT)1/2 (3)
w h e r e D a n d Cb a r e t h e d i ff u s i o n c o e ffi c i e n t
(2.02 × 10⁻⁶ cm2 s-1 obtained by chronoamperometry) and
the bulk concentration (mol cm-3) of H
2O2. Low values
of k’ result in values lower than 0.496 for the constant. The value of this constant was found to be 0.27 for
N-GO/AgNPs/TBHQ/GCE, in the presence of 0.3 mmol L-1
of H2O2 for low scan rates (6-24 mV s-1). According
-2.5 -2.5 -2.5
-1.4 -1.4 -1.4
-0.3 -0.3 -0.3
0.8 0.8 0.8
-0.26 -0.14 -0.02 0.1
I / µA I / µA I / µA
E / Vvs.Ag/AgCl E / Vvs.Ag/AgCl E / Vvs.Ag/AgCl
(A) (a)
(b)
-0.26 -0.14 -0.02 0.1
(B) (a)
(b)
-0.26 -0.14 -0.02 0.1
(C)
(a)
(b)
Figure 4. Cyclic voltammograms in 0.1 mol L-1 phosphate buffer solution (pH 7.0) at scan rate 20 mV s-1 in the absence (curves a) and presence of
0.3 mmol L-1 H
2O2 (curves b). (A) N-GO/TBHQ/GCE; (B) AgNPs/TBHQ/GCE; (C) N-GO/AgNPs/TBHQ/GCE.
-2.5 -2.5 -2.5
-1.4 -1.4 -1.4
-0.3 -0.3 -0.3
0.8 0.8 0.8
-0.26 -0.14 -0.02 0.1
I / µA I / µA I / µA
E / Vvs.Ag/AgCl E / Vvs.Ag/AgCl E / Vvs.Ag/AgCl
(A)
(a)
(b)
-0.26 -0.14 -0.02 0.1
(B)
(a)
(b)
-0.26 -0.14 -0.02 0.1
(C)
(a)
to the approach of Andrieux and Saveant and using Figure 1 in their theoretical paper,29 an average value
of k’ = 8.2 (± 0.25) × 10-4 cm s-1 was obtained. This
value is comparable with k’ = 4.7 (± 0.03) × 10-4,25
k’ = 1.17 (± 0.04) × 10-3 and k’ = 4.96 (± 0.004) × 10-4,30
k’ = 1.3 (± 0.20) × 10-3,31 k’ = 6.25 (± 0.15) × 10-4,32
k’ = 1.1 (± 0.036) × 10-3,33 k’ = 1.2 (± 0.03) × 10-3 cm s-1,24
previously reported for different analytes.
The number of electrons in the overall reaction, n, can be obtained from the plot slope of IP versus v1/2
(Figure S2a). According to the following equation for a totally irreversible diffusion controlled processes:27
Ip = 3.01 × 10⁵n[(1 – α)nα]
1/2AC
bD1/2v1/2 (4)
Considering (1 − α)nα = 0.68 (see below),
D = 2.02 × 10⁻⁶ cm2 s-1 (which is obtained by
chronoamperometry) and A = 0.0314 cm2, it is estimated
that the total number of electrons involved in the cathodic reduction of H2O2 is n = 1.87 ca. 2.
Linear sweep voltammograms at different potential
scan rates of N-GO/AgNPs/TBHQ/GCE in a 0.1 mol L-1
phosphate buffer (pH 7.0) containing 0.30 mmol L-1
H2O2 are depicted in inset of Figure S2b. This part of the
voltammogram, known as Tafel region, is affected by electron transfer kinetics between the H2O2 and the surface
confined N-GO/AgNPs/TBHQ/GCE. In this condition, the number of electrons involved in the rate determining step can be estimated from the slope of the Tafel plot (inset of Figure S2b).27 The Tafel plots were drawn using points of
the Tafel region of the linear sweep voltammograms in Figure S2. In this work, an average value of 0.32 ± 0.01 is obtained for the kinetic parameter of the anodic charge transfer coefficient, αa, assuming the rate determining
step of the electron transfer process between H2O2 and the
modified electrode contained one electron (nα = 1).
Furthermore, chronoamperometry in pH 7.0 phosphate buffer (0.1 mol L-1) containing different concentrations
of H2O2 was applied at N-GO/AgNPs/TBHQ/GCE to
estimate the diffusion coefficient, D, of H2O2. Figure S3,
show the chronoamperograms obtained at a potential step of −150 mV. For an electroactive material (H2O2 in
this case) with a diffusion coefficient of D, the current observed for the electrochemical reaction at the mass transport limited conditions described by the Cottrell equation.27 Under diffusion control, a plot of I versus t-1/2
will be linear, and from the slope the value of Dcan be
obtained. Figure S3a shows the experimental plots with the best fits for different concentrations of H2O2 employed.
The slopes of the resulting straight lines were then plotted versus the H2O2 concentration (Figure S3, inset
b), from whose slope we calculated a diffusion coefficient of 2.02 × 10⁻⁶ cm2 s-1.
Differential pulse voltammetric studies
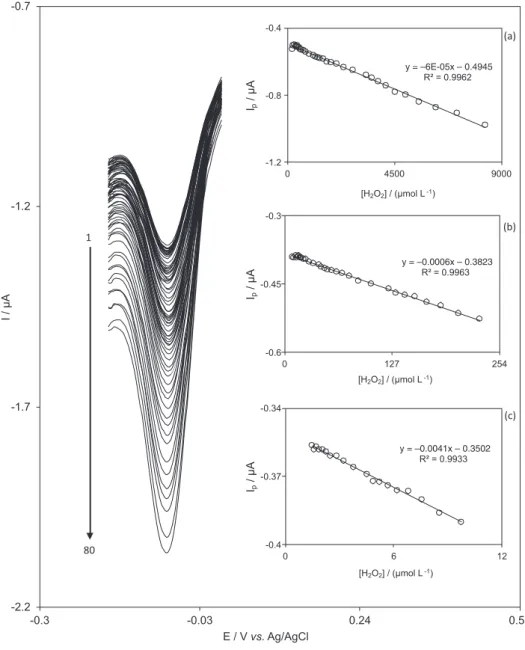
Differential pulse voltammetry, DPV, has a much higher current sensitivity than cyclic voltammetry, and it can be used to determine the linear range and to estimate the detection limit of H2O2. Figure 5 shows the
voltammetric response of N-GO/AgNPs/TBHQ/GCE to different H2O2 concentrations. Voltammograms clearly
show that the plot of peak current vs. H2O2 concentration
is formed of three linear segments with different slopes (slope: −6 × 10⁻⁵ µA (µmol L-1)-1 for first linear
segment, −6 × 10⁻⁴ µA (µmol L-1)-1 for second linear
segment and −41 × 10-4 µA (µmol L-1)-1 for third linear
segment), corresponding to three different ranges of substrate concentration (1.52-9.79 µmol L-1 for first linear
segment, 9.79-231.0 µmol L-1 for second linear segment
and 231.0-8330.0µmol L-1 for third linear segment). A
comparison of the sensitivities (slopes of the calibration plots) of the three linear segments shows a decrease of sensitivity in the second and third linear range probably due to the electron transfer kinetic limitation between the analyte and the modified electrode surface. The calibration plot, in the range of 1.52-9.79 µmol L-1 H
2O2,
was used to estimate the lower limit of detection of H2O2 at
N-GO/AgNPs/TBHQ/GCE. According to the method mentioned in the references,34 the lower detection limit,
Cm, was obtained to be 0.46 µmol L-1 by using the equation
Cm = 3sbl/m, where sbl is the standard deviation of the blank
response (µA) and m is the slope of the calibration plot (−41 × 10-4 µA (µmol L-1)-1).
The average voltammetric peak current and the precision estimated in terms of the coefficient of variation for repeated measurements (n = 15) of 5.0 µmol L-1 H
2O2
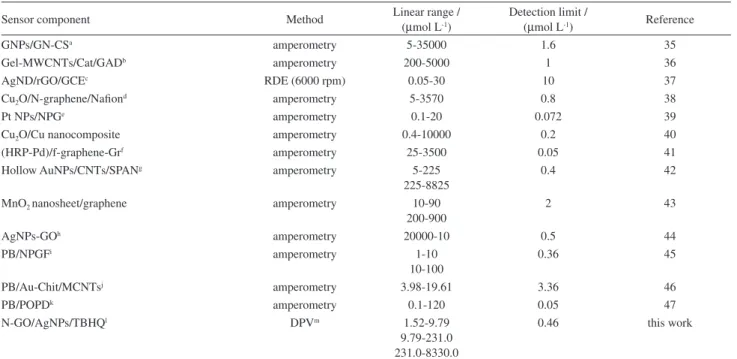
at N-GO/AgNPs/TBHQ/GCE were −0.382 ± 0.013 µA and 2.6%, respectively. This coefficient of variation value indicates that N-GO/AgNPs/TBHQ/GCE is stable and does not undergo surface fouling during the voltammetric measurements. A comparison of the analytical performance of N-GO/AgNPs/TBHQ/GCE for electrocatalytic reduction of H2O2 with other sensors is presented in Table 1.
In addition, to estimate the repeatability of the nanosensor, the response of modified electrode
toward determination of H2O2 in period of time were
investigated daily. The modified electrodes were utilized by the described method in the Experimental section
for determination of different solution of 20 µmol L-1
H2O2 with differential pulse voltammetry method. By
assuming relative standard deviation, RSD = 5%, the prepared modified electrode has proper stability for about 14 days. While the utilized electrode after determination of H2O2 has just stability for about 3 days. Based on this,
it is recommend to remodify the electrode in order to determine H2O2 with high sensitivity.
Determination of hydrogen peroxide in beverages and milk
From the results that are mentioned in the previous section, it is apparent that N-GO/AgNPs/TBHQ/GCE has a good detection limit and high sensitivity to H2O2
determination in real samples. The modified electrode was used to measure H2O2 in some beverages in order to test
its practical application. For this purpose 5 mL of different beverages sample and milk was diluted to 10 mL with a 0.1 mol L-1 phosphate buffer solution (pH 7.0). Then,
certain amounts of H2O2 were added and their recovery
was determined by differential pulse voltammetry. The results were obtained using the proposed method and -2.2
-1.7 -1.2 -0.7
-0.3 -0.03 0.24 0.51
I / µA
I
/ µA
p
I
/ µA
p
I
/ µA
p
E / Vvs.Ag/AgCl
y = –6E-05x – 0.4945 R² = 0.9962
-1.2 -0.8 -0.4
0 4500 9000
[H2O2] / (µmol L-1)
y = –0.0006x – 0.3823 R² = 0.9963
-0.6 -0.45 -0.3
0 127 254
[H2O2] / (µmol L-1)
y = –0.0041x – 0.3502 R² = 0.9933
-0.4 -0.37 -0.34
0 6 12
[H2O2] / (µmol L-1)
(a)
(c) (b) 1
80
Figure 5. Differential pulse voltammograms of an N-GO/AgNPs/TBHQ/GCE in 0.1 mol L-1 phosphate buffer solution (pH 7.0) containing different
concentrations of hydrogen peroxide. The numbers of 1-80 correspond to 1.52-83.3 × 10² µmol L-1 hydrogen peroxide. Insets show the plots of the
electrocatalytic peak current, corrected for any residual current, as a function of hydrogen peroxide concentration in the range of (a) 231.0-8330.0 µmol L-1;
certified with a calibration graph of H2O2 inside the range
of 1.52-9.79 µmol L-1. The outcome (Table 2) show that the
recoveries are in the range of 97.00 to 102.5%.
Conclusions
Based on the results obtained in this manuscript, it is concluded that the composition of N-GO and AgNPs at the surface of GCE can increase background voltammetric response (capacitance current) and sensitivity of TBHQ. Therefore, the N-GO/AgNPs/TBHQ/GCE is fabricated
and then used as a new sensor for electrocatalytic reduction of H2O2. This modified electrode exhibits an
electrocatalytic behavior to H2O2 reduction at a much lower
over potential compared with the N-GO/TBHQ/GCE and A g N P s / T B H Q / G C E . T h e a v e r a g e v a l u e s 8.2 (± 0.25) × 10-4 cm s-1 and 0.32 ± 0.01 were obtained for
the heterogeneous electron transfer rate constant, k’, and the charge transfer coefficient, α, between the adsorbed TBHQ layer and H2O2. The diffusion coefficient of H2O2 was
calculated as 2.02 × 10⁻⁶ cm2 s-1 using chronoamperometric
results. The calibration curves for H2O2 determination
Table 1. Comparison of some analytical parameters of the several modified electrodes for H2O2 determination
Sensor component Method Linear range /
(µmol L-1)
Detection limit /
(µmol L-1) Reference
GNPs/GN-CSa amperometry 5-35000 1.6 35
Gel-MWCNTs/Cat/GADb amperometry 200-5000 1 36
AgND/rGO/GCEc RDE (6000 rpm) 0.05-30 10 37
Cu2O/N-graphene/Nafiond amperometry 5-3570 0.8 38
Pt NPs/NPGe amperometry 0.1-20 0.072 39
Cu2O/Cu nanocomposite amperometry 0.4-10000 0.2 40
(HRP-Pd)/f-graphene-Grf amperometry 25-3500 0.05 41
Hollow AuNPs/CNTs/SPANg amperometry 5-225
225-8825
0.4 42
MnO2 nanosheet/graphene amperometry 10-90
200-900
2 43
AgNPs-GOh amperometry 20000-10 0.5 44
PB/NPGFi amperometry 1-10
10-100
0.36 45
PB/Au-Chit/MCNTsj amperometry 3.98-19.61 3.36 46
PB/POPDk amperometry 0.1-120 0.05 47
N-GO/AgNPs/TBHQl DPVm 1.52-9.79
9.79-231.0 231.0-8330.0
0.46 this work
aGNPs/GN-CS: gold nanoparticles-graphene-chitosan; bgel-MWCNTs/Cat/GAD: gelatin-multiwalled carbon nanotubes-catalase-glutaraldehyde; cAgND/
rGO/GCE: silver nanodendrite-reduced graphene oxide-glassy carbon electrode; dCu
2O/N-graphene/nafion: Cu2O-nitrogen-doped graphene-nafion; ePt NPs/
NPG: Pt nanoparticles-nanoporous gold; f(HRP-Pd)/f-graphene-Gr: horseradish peroxidase-palladium/functionalized-graphene modified graphite; ghollow
AuNPs/CNTs/SPAN: hollow gold nanoparticles/carbon nanotube/self-doped polyaniline; hAgNPs-GO: silver nanoparticles-graphene oxide; iPB/NPGF:
prussian blue modified nanoporous gold film; jPB/Au-Chit/MCNTs: Prussian Blue modified gold-chitosan nanoparticle/multiwall carbon nanotubes; kPB/
POPD: Prussian Blue and poly(o-phenylenediamine) (POPD); lN-GO/AgNPs/TBHQ: nafion/graphene oxide/silver nanoparticles/tertiary butylhydroquinone
(TBHQ); mDPV: differential pulse voltammetry.
Table 2. Determination of H2O2 in six commercial beverages using N-GO/AgNPs/TBHQ/GCE
Beverage sample Added / (µmol L-1) Found / (µmol L-1) Recovery (n = 3) / %
Apple juice 2.000 4.000 6.000 2.050 4.080 5.930 102.5 102.0 98.80
Orange juice 3.000 6.000 9.000 3.060 5.950 8.960 1020.0 99.12 99.50
Peach juice 3.000 6.000 9.000 3.030 5.950 9.040 101.0 99.17 100.4
Pineapple juice 2.000 4.000 6.000 2.020 4.010 6.030 101.0 100.2 100.5
Strawberry juice 2.500 5.000 7.500 2.470 5.030 7.520 98.80 100.6 100.3
Pomegranate juice 3.000 6.000 9.000 3.010 6.030 8.970 100.3 100.5 99.70
Milk sample 1 2.000 5.000 7.000 2.033 5.005 7.012 101.65 100.10 100.17
Milk sample 2 3.000 4.000 6.000 3.006 3.998 5.995 100.2 99.95 99.91
were obtained in the ranges of 1.52-9.79, 9.79-231.0 and 231.0-8330.0 µmol L-1 with differential pulse voltammetry.
Moreover, the proposed modified electrode was very useful for accurate determination of H2O2 in real samples.
Supplementary Information
Supplementary data (cyclic voltammetric and chronoamperometric responses of N-GO/AgNPs/TBHQ/ GCE) are available free of charge at http://jbcs.sbq.org.br as PDF file.
Acknowledgments
The authors would like to kindly acknowledge all the supports and funding from Islamic Azad University of Yazd.
References
1. Eskandani, M.; Hamishehkar, H.; Dolatabadi, J. E. N.; Food Chem. 2014, 153, 315.
2. Shahabadi, N.; Maghsudi, M.; Kiani, Z.; Pourfoulad, M.; Food Chem. 2011, 124, 1063.
3. Jia, F.; Zhong, H.; Zhu, F.; Li, X.; Wang, Y.; Cheng, Z.; Zhang, L.; Sheng, Z.; Guo, L.; Electroanalysis 2014, 26, 2244. 4. Ensafi, A. A.; Jafari-Asl, M.; Rezaei, B.; Talanta 2013, 103,
322.
5. Alpat, S.; Alpat, S. K.; Dursun, Z.; Telefoncu, A.; J. Appl. Electrochem. 2009, 39, 971.
6. Kurowska-Tabor, E.; Jaskula, M.; Sulka, G. D.; Electroanalysis 2014, 27, 1968.
7. Tsaplev, Y. B.; J. Anal. Chem. 2012, 67, 506.
8. Steinberg, S. M.; Environ. Monit. Assess. 2013, 185, 3749. 9. Vasicek, O.; Papezikova, I.; Hyrsl, P.; Eur. J. Entomol. 2011,
108, 481.
10. Odo, J.; Inoguchi, M.; Ohira, S.; Tsukikawa, S.; Aramaki, M.; Matsuhama, S.; Taito, M.; Takayama, A.; Anal. Sci. 2013, 29, 1041.
11. Liu, H.; Chen, X.; Huang, L.; Wang, J.; Pan, H.; Electroanalysis 2014, 26, 556.
12. Salimi, A.; Mahdioun, M.; Noorbakhsh, A.; Abdolmaleki, A.; Ghavami, R.; Electrochim. Acta 2011,56, 3387.
13. Won, Y. H.; Huh, K.; Stanciu, L. A.; Biosens. Bioelectron. 2011,
26, 4514.
14. Khan, M. M.; Ansari, S. A.; Lee, J.; Cho, M. H.; Mater. Sci. Eng., C 2013, 33, 4692.
15. Han, Y.; Zheng, J.; Dong, S.; Electrochim. Acta 2013, 90, 35. 16. Gao, H.; Qi, X.; Chen, Y.; Sun, W.; Anal. Chim. Acta2011, 704,
133.
17. Jia, M.; Wang, T.; Liang, F.; Hu, J.; Electroanalysis 2012, 24, 1864.
18. Wang, F.; Zhou, J.; Liu, Y.; Wu, S.; Song, G.; Ye, B.; Analyst 2011, 136, 3943.
19. Chen, J.; Yao, B.; Li, C.; Shi, G.; Carbon 2013, 64, 225. 20. Hummers Jr., W. S.; Offeman, R. E.; J. Am. Chem. Soc. 1958,
80, 1339.
21. Marcano, D. C.; Kosynkin, D. V.; Berlin, J. M.; Sinitskii, A.; Sun, Z.; Slesarev, A.; Alemany, L. B.; Lu, W.; Tour, J. M.; ACS Nano 2010, 4, 4806.
22. Pariente, F.; Lorenzo, E.; Abruna, H. D.; Anal. Chem.1994, 66, 4337.
23. Zare, H. R.; Samimi, R.; Nasirizadeh, N.; Mazloum-Ardakani, M.; J. Serb. Chem. Soc. 2010, 75, 1434.
24. Nasirizadeh, N.; Aghayizadeh, M. M.; Bidoki, S. M.; Yazdanshenas, M. E.; Int. J. Electrochem. Sci. 2013, 8, 11264. 25. Nasirizadeh, N.; Hajihosseini, S.; Shekari, Z.; Ghaani, M.; Food
Anal. Methods2015, 8, 1546.
26. Laviron, E.; J. Electroanal. Chem.1979, 101, 19.
27. Bard, A. J.; Faulkner, L. R.; Electrochemical Methods, Fundamentals and Applications; Wiley: New York, 2001.
28. Nasirizadeh, N.; Shekari, Z.; Tabatabaee, M.; Ghaani, M.; J. Braz. Chem. Soc.2015, 26, 713.
29. Andrieux, C. P.; Saveant, J. M.; J. Electroanal. Chem.1978,
93, 163.
30. Nasirizadeh, N.; Shekari, Z.; Zare, H. R.; Shishehbore, M. R.; Fakhari, A. R.; Ahmar, H.; Biosens. Bioelectron.2013, 41, 608. 31. Nasirizadeh, N.; Shekari, Z.; Ionics2014, 20, 275.
32. Aghayizadeh, M. M.; Nasirizadeh, N.; Bidoki, S. M.; Yazdanshenas, M. E.; Int. J. Electrochem. Sci. 2013, 8, 8848. 33. Nasirizadeh, N.; Shekari, Z.; Zare, H. R.; Ardakani, S. A. Y.;
Ahmar, H.; J. Braz. Chem. Soc.2013, 24, 1846.
34. Skoog, D. A.; Holler, F. J.; Crouch, S. R.; Principles of Instrumental Analysis; Thomson Brooks/Cole: London, 2007.
35. Jia, N.; Huang, B.; Chen, L.; Tan, L.; Yao, S.; Sens. Actuators, B2014, 195, 165.
36. Wang, Y.; Li, T.; Zhang, W.; Huang, Y.; J. Solid State Electrochem. 2014, 18, 1981.
37. Sawangphruk, M.; Sanguansak, Y.; Krittayavathananon, A.; Luanwuthi, S.; Srimuk, P.; Nilmoung, S.; Maensiri, S.; Meevasana, W.; Limtrakul, J.; Carbon 2014, 70, 287. 38. Jiang, B. B.; Wei, X. W.; Wu, F. H.; Wu, K. L.; Chen, L.; Yuan,
G. Z.; Dong, C.; Ye, Y.; Microchim. Acta 2014, 181, 1463. 39. Yin, G.; Xing, L.; Ma, X. J.; Wan, J.; Chem. Pap. 2014, 68,
435.
40. Luo, B.; Li, X.; Yang, J.; Li, X.; Xue, L.; Li, X.; Gu, J.; Wang, M.; Jiang, L.; Anal. Methods 2014, 6, 1114.
41. Nandini, S.; Nalini, S.; Manjunatha, R.; Shanmugam, S.; Melo, J. S.; Suresh, G. S.; J. Electroanal. Chem. 2013, 689, 233. 42. Chen, X.; Guo, B.; Hu, P.; Wang, Y.; Electroanalysis 2014, 26,
1513.
44. Jun, Z.; KeunSoo, K.; Zhenxian, L.; Huan, F.; Shifeng, H.;
Electroanalysis2014, 26, 251.
45. Ghaderi, S.; Ayatollahi Mehrgardi, M.; Bioelectrochem. 2014,
98, 64.
46. Li, M.; Zhao, G.; Yue, Z.; Huang, S.; Microchim. Acta2009,
167, 167.
47. Ping, J.; Wu, J.; Fan, K.; Ying, Y.; Food Chem. 2011, 126, 2005.
Submitted: September 24, 2015