Patterns of antibacterials use in intensive care units
Padrões de utilização de antibacterianos em unidades de terapia
intensiva
INTRODUCTION
Given the worsening of the bacterial resistance issue and the actual perspective of unavailable effective therapies for resistant bacteria, inter-national institutions, governments and the civil society are engaged in the search of initiatives to fight the emergence and dissemination of resistant germs.(1-3) During the last two decades several actions have been in place,
Edilson Floriano dos Santos1, Liana
Lauria-Pires2
1. Professor of the Escola Superior de Ciências da Saúde of the Fundação de Ensino e Pesquisa em Ciências da Saúde. Brasília (DF), Brazil.
2. Professor of the Medical Sciences Post-Graduation Course of the Universidade de Brasília – UNB – Brasília (DF), Brazil.
ABSTRACT
Objective: To know and compare the patterns of antimicrobials use in intensive care units (ICUs) based on the Anatomical Therapeutic Chemi-cal/Defined Daily Dose (ATC/DDD) system.
Methods: a prospective cohort study was conducted in three medi-cal-surgical intensive care units, two of them in public hospitals and one in a private hospital. Simple random, independent samples of patients ad-mitted from 10/2004 to 09/2005 to the selected intensive care units were used. The antibiotics use was as-sessed using the ATC/DDD system. The amount of antibacterials used in each intensive care unit, in grams, was transformed in daily defined dose (DDD). The number of DDDs was divided by the number of patient-days, multiplied by one thousand, to obtain the average density of con-sumption (DC) per thousand patient-days (DDD1000).
Results: 1,728 patients-days and 2,918.6 DDDs were examined in the three intensive care units, cor-responding to an average density of
consumption of 1,689.0 DDD1000. The median number of DDDs of an-tibiotics use in the public hospitals’ intensive care units was significantly higher (p=0.002) versus the private hospital’s intensive care unit. The consumption of antibiotics in the private hospital’s intensive care unit (DC=2,191.7 DDD1000) was signifi-cantly higher (p<0.001) versus the in-tensive care units of public hospitals (1,499.5 DDD1000). The most used antibiotics groups in the three in-tensive care units were 3rd generation
cephalosporins, penicillins/betalac-tamases inhibitors, carbapenems and fluorquinolones.
Conclusion: he pattern of an-tibiotics use in the three examined intensive care units was not uniform. he private hospital’s intensive care unit used a signiicantly larger amount versus the public hospitals’ intensive care units. Nevertheless, the most used antibiotics groups were similar in the three intensive care units.
Keywords: Epidemiologic mea-surements; Intensive care units; Anti-bacterial agents/administration & dosage
his work is part of a PhD hesis for the Medical Sciences Post-Graduation Course of the Médicas da Universidade de Brasília – UNB – Brasília (DF), Brazil.
he authors report no conlict of interest.
Submitted on January 26, 2010 Accepted on May 25, 2010
Author for correspondence: Edilson Floriano dos Santos
Rua Joaquim Pinheiro, 55 - Bloco 2 - Apt. 303 - Jacarepaguá
Zip Code: 22743-660 Rio de Janeiro (RJ), Brazil.
with emphasis on bacterial resistance(4) and
antibacte-rial consumption(2,5,6) monitoring. These actions main
objectives are to know the resistance and antimicro-bial use patterns, respectively. From this information, it was possible to set parameters which are useful to evaluate measures aimed to limit the bacterial resis-tance emergence and dissemination, and to improve antibacterials use.
In Brazil, bacterial resistance monitoring actions are incipient. We heard no news either from Govern-ment or institutions on initiatives aimed to know the pattern of antibacterials consumption in intensive care units (ICUs) based on the Anatomical Therapeu-tic Chemical/Defined Daily Dose (ATC/DDD) sys-tem,(7) as recommended by the World Health
Organi-zation (WHO) for medicinal products study.
This study objective was to know and to compare the patterns of antimicrobials use in general, not specialized, intensive care units from Brasilia, in the Brazilian Federal District, based on the ATC/DDD system.
METHODS
This was a prospective cohort study, conducted from October 1, 2004 to September 30, 2005. For the sake of convenience, we selected three non-spe-cialized adult patients ICUs – being two of them in public hospitals (Hospital Regional de Ceilândia – HRC, and Hospital Regional de Taguatinga – HRT), and one in a private hospital (Hospital Santa Luzia – HSL). Around 10,000 patients are yearly admitted in each hospital, and in none of them are any transplant or oncology services.
The Secretaria de Estado de Saúde do Distrito Federal’s Ethics Committee opinion nr. 046/2004 ap-proved this study in August 31, 2004. An Informed Consent Form signature was not required.
Sample
The patients were independently randomized for each individual ICU. All patients admitted to the units during the study period were considered for inclusion. Consecutive patients’ readmissions were computed when the discharge and admission dates were different. Patients with time of stay shorter than one hour, and those younger than 18 years-old, were excluded. Each sample included patient was followed until leaving the ICU either for discharge, transfer-ence or death.
The antibacterials consumption was the basis for the sample size calculation. From the HRT’s phar-macy antimicrobials dispensing reports, the average daily defined dose consumption rate was estimated. Using the appropriate formula for sample size calcula-tion in a continuous variable descriptive study(8) and
considering a 95% confidence interval, a number of 32 patients in each ICU was found. For the public hospitals, 20% was added for eventual losses, reach-ing 40 patients. Due to larger admission numbers in the private hospital, this hospital’s sample was tripled, plus 10% for possible losses, reaching 100 patients.
Variables
The patients admitted to the ICUs and included in the sample were divided according to the cause of admission in either clinical or surgical. When the admission did not mention a surgical procedure or a surgery-related incident, the patient was considered as clinical, or in contrary, surgical.
Nosocomial infection meant any infection acquired from the patient’s admission on and identified during the hospital stay or after the discharge, when it could be related to the stay in the hospital environment or procedures during the hospital stay. For identification of hospital infections, the Centers for Disease Control and Prevention (CDC) criteria(9) were used, according
to the National Nosocomial Infections Surveillance (NNIS) methodology.(10) All patients admitted to the
ICU were monitored regarding urinary tract, pneu-monia and blood stream infections.
In order to control for the clinical status of the patients admitted to the three ICUs and included in the sample, the severity was assessed using the Acute Physiology and Chronic Health Evaluation (APACHE II).(11)
Consumption of antibacterials was considered as the amount of drug product efectively used by the pa-tient during the ICU stay. To verify the antibacterials consumption, the 2005 ATC/DDD system was used.(7)
The antibacterial consumption was calculated in two different forms: by the DDD and prescription frequency. In the first, the antimicrobial amount in grams was divided by the corresponding DDD. Next, the number of patients-days was used as de-nominator, for the density or rate of consump-tion for patients-day. The density of consumpconsump-tion (DC) was multiplied times 1,000 to find the den-sity of consumption per one thousand patients-day (DDD1000). For analysis purposes, the data on bacterials consumption were pooled by specific anti-bacterials and ICUs, to allow a comparison with the main published studies. The second calculation of antibacterials consumption was by the prescription frequency. For this, the number of patients with a given antibacterial prescribed was counted, and re-lated with the number of patients with antibacteri-als prescription per ICU. The result was expressed as absolute numbers and percentage.
Procedures for the data collection
The main investigator visited regularly the ICUs. In the public hospitals, the visit was always within the first 24 hours of each patient’s admission. From the patient’s evaluation and medical chart notes, the admission was labeled as either as clinical or surgical, and the severity score was rated (APACHE II). Dur-ing the ICU stay, the medical chart notes were evalu-ated to check, when an antimicrobial was prescribed, if it was effectively given, the dosage, via and fre-quency. In the private hospital, the visit was weekly. The admission classification, the severity score cal-culation (APACHE II) and the data on antibacteri-als consumption were retrieved from the unit’s com-puted system.
Each patient’s severity and antibacterials consump-tion informaconsump-tion was transcribed to standard study-specific forms. The secondary data came from reports on nosocomial infection indicators from each insti-tution’s nosocomial infection control service and the bacterial sensitivity reports provided by the institu-tions’ microbiology laboratories.
During the study period, the only effectively on-going antibacterial use control measurement in the evaluated institutions was the form with the available drugs. There was no continued education program, antibacterials use restriction, empirical treatment for the most frequent infections routine, or even an infec-tologist physician support for the antibacterial thera-py decision making process.
Statistics
For normal distribution continuous variables anal-ysis, two tests were used: variance analysis (ANOVA) and the t test for independent samples. The variance analysis was conducted after the data distribution ho-mogeneity around the mean analysis, using the Barlett test. For non-normal distribution continuous vari-ables, non-parametrial tests were used (Kruskall-Wal-lis analysis). The rates comparisons were performed using the χ2 test. A significance level of 5% was
adopt-ed. The data were stored and analyzed using the EPI INFO 3.3.2 (CDC, 2005), WINPEPI and WHO-NET 5.4 (WHO, 2007) softwares.
RESULTS
During the study period were admitted to the HRC, HRT and HSL ICUs 173, 115 and 106 pa-tients, respectively. The candidates from these popu-lations were randomized for inclusion in the sample. As the HRC and HSL number of admissions was sur-passed before the time expected for the study end, new patients were randomized. Thus, the sample size initially expected for the hospitals, was increased.
In the HRC’s ICU, 58 patients were randomized to the sample, and four (6.9%) were excluded: one stay-ing shorter than one hour, and three below 18 years-old. Thus, the sample comprised 54 patients. In the HSL, 115 patients were randomized to the sample, and 12 were excluded: ten hat no rated APACHE II score, and two patients were admitted to the neuro-logical ICU; 103 patients remained in the sample.
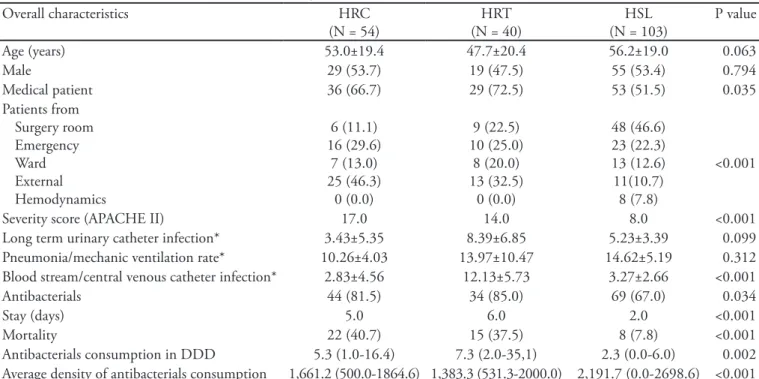
Overall, the patients in the three ICUs were not significantly different regarding age, gender and uri-nary tract infection and pneumonia rates, however significant differences were found regarding other aspects: clinical patients’ rate, patients’ origin, sever-ity score, blood stream infection rate, antibacterial use frequency, hospital stay length and mortality (Table 1).
Pattern of antibacterials consumption
A total of 1,728 patients-days and 2,918.6 DDD were analyzed in the three pooled ICUs, correspond-ing to an average density of antibacterial consumption of 1,689.0 DDD1000.
the private hospital’s ICU (Table 1).
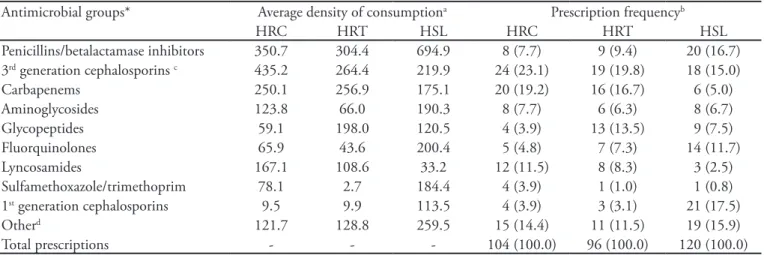
The antibacterials groups which were 90% of the total amount used in the three ICUs, are listed on table 2 as DDD1000. The most used antibacterials in the three ICUs, according to their average density of consumption, were similar and mainly characterized for being more recently launched drugs (e.g. penicil-lins/betalactamases inhibitors), drugs with wide anti-bacterial spectrum (e.g. 3rd generation cephalosporins
and carbapenems) and resistant germs-targeted drugs (e.g. carbapenems and glycopeptides).
Although similar, the amount used of each of these antibacterials groups was not uniform among the ICUs, and somehow reflected the patients’ char-acteristics regarding origin, severity and Gram-nega-tive bacteria isolation from cultures frequency in the patients staying in the units during the study (data not shown). For instance, the average density of con-sumption for the penicillins/betalactamases inhibitors group was significantly higher in the private hospi-tal ICU versus the public hospihospi-tals’ ICUs (p<0.001); 3rd generation cephalosporins and fluorquinolones
Table 1 – Overall patients’ characteristics, according to the hospitalization site
Overall characteristics HRC
(N = 54)
HRT (N = 40)
HSL (N = 103)
P value
Age (years) 53.0±19.4 47.7±20.4 56.2±19.0 0.063
Male 29 (53.7) 19 (47.5) 55 (53.4) 0.794
Medical patient 36 (66.7) 29 (72.5) 53 (51.5) 0.035
Patients from Surgery room Emergency Ward External Hemodynamics
6 (11.1) 16 (29.6)
7 (13.0) 25 (46.3)
0 (0.0)
9 (22.5) 10 (25.0)
8 (20.0) 13 (32.5)
0 (0.0)
48 (46.6) 23 (22.3) 13 (12.6) 11(10.7)
8 (7.8)
<0.001
Severity score (APACHE II) 17.0 14.0 8.0 <0.001
Long term urinary catheter infection* 3.43±5.35 8.39±6.85 5.23±3.39 0.099
Pneumonia/mechanic ventilation rate* 10.26±4.03 13.97±10.47 14.62±5.19 0.312
Blood stream/central venous catheter infection* 2.83±4.56 12.13±5.73 3.27±2.66 <0.001
Antibacterials 44 (81.5) 34 (85.0) 69 (67.0) 0.034
Stay (days) 5.0 6.0 2.0 <0.001
Mortality 22 (40.7) 15 (37.5) 8 (7.8) <0.001
Antibacterials consumption in DDD 5.3 (1.0-16.4) 7.3 (2.0-35,1) 2.3 (0.0-6.0) 0.002
Average density of antibacterials consumption 1,661.2 (500.0-1864.6) 1,383.3 (531.3-2000.0) 2,191.7 (0.0-2698.6) <0.001
HRC - Hospital Regional de Ceilândia; HRT - Hospital Regional de Taguatinga; HSL - Hospital Santa Luzia; APACHE – Acute Physiological Chonic Health Evaluation; DDD – daily dose deined. Results expressed as mean ± standard deviation, median (25-75% percentile) or num-ber (%). ANOVA test (parametrical data) or Kruskall-Wallis (non-parametrical data). *Calculation of the infection incidence rate associated with risk procedure. Rate = (NIH/Pdia) x 1000 Where = infection incidence rate (urinary infection, blood stream infection, pneumonia) associated with risk procedure (long term urinary catheter, central line catheter, mechanic ventilation), NIH = number of speciic hospital infection (urinary infection, blood stream infection, pneumonia). Pdia = number of procedures (long term urinary catheter, central line ca-theter, mechanic ventilation)-day.
were more intensively used in the HRC and HSL (p<0.001), respectively. On the other hand, the car-bapenems group, more intensely consumed in the public hospitals ICUs, did not show a difference in the average consumption for both units (p=0.828), al-though more used than in the private hospital’s ICU (p=0.002).
blood stream infection seen in the HRT, and the isola-tion of oxacyllin-resistant Staphylococcus aureus isolated in the HSL (data not shown). Regarding the 1st
genera-tion cephalosporins, their consumpgenera-tion was, probably, related to the frequency of elective surgeries in the hos-pital (data not shown).
The analysis of the antibacterials groups’ frequen-cy of prescription has shown important differences, when compared to the mean density of consump-tion (Table 2). For instance, the penicillins/betalac-tamases inhibitors group, the most consumed in the HRT and HSL according to the average density of consumption, is ranked second in the private hospital when the number of prescriptions is analyzed. The first generation cephalosporins group ranked eight in the private hospital when the evaluation considered the average density of consumption. However, when the number of prescriptions was evaluated, it became first; the lincosamides group, ranking fourth in the HRC according to the average density of consump-tion, ranked third according to the number of pre-scriptions (Table 2).
DISCUSSION
The patterns of antibacterials consumption in the three studied ICUs were not uniform. Nevertheless,
Table 2 – Average density of consumption and prescription frequency per antibacterial group, distributed by hospitals
Antimicrobial groups* Average density of consumptiona Prescription frequencyb
HRC HRT HSL HRC HRT HSL
Penicillins/betalactamase inhibitors 350.7 304.4 694.9 8 (7.7) 9 (9.4) 20 (16.7)
3rd generation cephalosporins c 435.2 264.4 219.9 24 (23.1) 19 (19.8) 18 (15.0)
Carbapenems 250.1 256.9 175.1 20 (19.2) 16 (16.7) 6 (5.0)
Aminoglycosides 123.8 66.0 190.3 8 (7.7) 6 (6.3) 8 (6.7)
Glycopeptides 59.1 198.0 120.5 4 (3.9) 13 (13.5) 9 (7.5)
Fluorquinolones 65.9 43.6 200.4 5 (4.8) 7 (7.3) 14 (11.7)
Lyncosamides 167.1 108.6 33.2 12 (11.5) 8 (8.3) 3 (2.5)
Sulfamethoxazole/trimethoprim 78.1 2.7 184.4 4 (3.9) 1 (1.0) 1 (0.8)
1st generation cephalosporins 9.5 9.9 113.5 4 (3.9) 3 (3.1) 21 (17.5)
Otherd 121.7 128.8 259.5 15 (14.4) 11 (11.5) 19 (15.9)
Total prescriptions - - - 104 (100.0) 96 (100.0) 120 (100.0)
HRC- Hospital Regional de Ceilândia, HRT - Hospital Regional de Taguatinga, HSL - Hospital Santa Luzia. Results expressed as number (percent). *According to the system Anatomical herapeutic Chemical/Deined Daily Dose (ATC/DDD); aRefers to the average density of consumption for
each antibacterial group. It calculation is made by patient. It is the result of dividing the total number of deined daily doses for each antibacterial groups by each patient time of stay, times 1,000; bRefers to the number of times the antibacterial group was prescribed, and its relationship with
the overall prescriptions; cAs third generation Cephalosporins were included: ceipime, ceftazidime, and ceftriaxone, available in the three hospitals; dOther includes the following antibacterial groups: betalactamase sensitive and resistant penicillins (includes isoxazolpenicillins), 2nd generation
Ce-phalosporins, aztreonam, macrolides, imidazols, oxazolidinone and polymyxin.
the most used antibacterials groups used in the three ICU were similar.
Pattern of antibacterials consumption
Our results confirmed the findings of two recent independently conducted studies, involving two out the three ICUs analyzed in this study. The first was conducted from January 1999 to December 2004 in the Hospital Regional de Taguatinga (HRT)’s adult ICU and used medical charts data for a sample of hos-pitalized patients.(12) The average density of
antibacte-rials consumption (1,487.1 DDD1000) was similar to our findings for the HRT’s ICU (1,383.3 DDD1000) (Table 1). Regarding the most consumed antibacteri-als groups, a change was identified. The 3rd generation
cephalosporins group, the most consumed group in the previous study, was surpassed by the penicillins/ betalactamases inhibitors group in this one. However, we emphasize that this last antibacterials group was made available in public institutions from 2003 on, allowing its widespread use.
The second study was conducted in the Hospital Santa Luzia (HSL)’s ICU.(13) Data on antibacterials
(2,191.7 DDD1000) (Table 1). No change was seen re-garding the most consumed antibacterials groups.
Comparison of the pattern of antibacterials con-sumption between the ICUs
When the severity in the public hospitals’ ICUs is considered versus the private hospital’s ICU, a larger con-sumption would be expected in the public hospitals, as expressed by the amount of antibacterials consumption in DDD (Table 1). On the other hand, the consumption ex-pressed as average density, evidenced a larger antibacterials use in the private hospital’s ICU (Table 1). his last result, increased average antibacterials consumption density in the private hospital, may be related to three aspects: the frequency of antibacterials prescriptions given; the difer-ence between the daily deined dose and the efectively prescribed dose;(14) and the use of patients-day as
denomi-nator for calculation of the density or rate of antibacterials consumption.
Regarding the irst aspect, the frequency of prescrip-tion, the private hospital’s ICU has shown relevant dif-ferences versus the public hospitals’ ICUs. For instance, the prescriptions of penicillins/betalactamases inhibitors group antibiotics in the private hospital’s ICU was twice the prescriptions in the public hospitals (Table 2). Is asso-ciation with the diferent frequencies of antibacterials pre-scriptions, some aspects of the measurement unit (DDD) in this study, as pointed in the previous paragraph, may explain the larger density of consumption in the private hospital’s ICU. DDD is a technical measurement which allows to estimate the consumption, independently of the pharmaceutical form and product price. However, it does not necessarily relects the efectively used dose.(14) On
the other side, DDD has some disadvantages, as it does not translate the use of the products in children, renal fail-ure patients, as well as prophylactic use.(15) In addition,
for some antibacterials classes, there are important difer-ences between the daily deined dose and the efectively prescribed dose, eventually overestimating the antibacte-rial amount used.(14) For instance, in the private hospital’s
ICU, the average density of consumption of penicillins/ betalactamases inhibitors was signiicantly higher than in the public hospitals’ ICUs (Table 2). Ampicillin/sulbac-tam was the most used antibacterial, particularly in the private hospital’s ICU (data not shown). he DDD for the Ampicillin/sulbactam combination is 2 grams/daily, how-ever this product was used in a 12 grams/daily dose – six times bigger than the DDD.(14) hus, with the increased
Ampicillin/sulbactam use, the average density of antibac-terials consumption was overestimated in that institution
(Table 1), explaining, at least in part, the increased density of consumption in the private hospital’s ICU.
Adding to the two above factors to explain the in-creased average density of antibacterials consumption in the private hospital’s ICU, we should take into consider-ation the denominator used for measuring the antibacteri-als consumption. Expressing the antibacteriantibacteri-als consump-tion as DDD per patients-day (or beds-day) is believed to allow the drugs comparison between the institutions, independently of the formulary diferences, antibiotics potency and hospital census. However, this consump-tion measurement may be inluenced by the denominator used. When the time of stay in the institution was signii-cantly diferent (Table 1), the one with shorter time of stay will have its consumption measurement overestimated, as seen in this study.(16)
Aspects regarding the ICUs’ peculiar environments and technical management issues for the studied units may have contributed to the similarity between the three ICUs most used antibacterials groups. Among the irst ones, the patients’ severity and the need of efective thera-py to minimize the risk of death, the frequency of bacterial resistance and the relatively restricted number of antimi-crobials efective against resistant organisms, leave little options for initial infections therapy.(17) In case of
Gram-negative bacteria, the most frequently isolated organisms in the studied ICUs during the study period (data not shown), are left the carbapenems, 3rd generation
cephalo-sporins and luorquinolones. For Gram-positive bacteria, are left glycopeptides and, more recently, oxazolininones. Regarding the technical management, the diiculties for implementation and maintenance of a full and efective antibacterials control policy, in compliance with the lit-erature(18) may contribute to the similarity of antibacterials
groups use between the ICUs.(19)
Comparison of the pattern of antibacterials con-sumption and the literature
he values of the average and median density of an-tibacterials consumption in the three analyzed ICUs were above those found in local counties hospitals’ ICUs and regional Swedish hospitals (983 DDD1000 to 1,541 DDD1000)(6,20) and inter-disciplinary ICUs in Germany
(1,093 DDD1000 to 1,338.3 DDD1000).(21,22)
In the Swedish studies, where oxacyllin-resistant
Staphylococcus aureus isolation is relatively rare, 2nd
genera-tion cephalosporins, isoxazolpenicillins and carbapenems were the most used antibacterials groups.(6,20) In Germany,
starting from the last SARI (Surveillance of Antibiotic Use and Resistance in Intensive Care) project publication, it was seen that the most used antibacterials groups in 14 inter-disciplinary ICUs were penicillins/betalactamases inhibitors, 2nd generation cephalosporins and quinolones. (22) In the United States of America, the most used
antibac-terials groups in 61 medical-surgical ICUs were luorqui-nolones, the Ampicillin group (including aminopenicil-lins either or not combined with betalactamases inhibitors and excluding anti-pseudomonas penicillins either or not combined with betalactamases inhibitors) and 3rd
genera-tion cephalosporins.(23)
he most used antibacterials groups in this study ana-lyzed ICUs are diferent in variable degrees of the most used antibacterials in German and American ICUs. Com-pared to the Swedish ICUs, the patients in our study ana-lyzed ICUs used broader spectrum antibacterials, favoring resistant germs selection. Regarding the German ICUs, our ICUs most used antibacterials did not include the 2nd generation cephalosporins. Regarding the American
ICUs, there were no substantial diferences when the most used antibacterials groups were compared.
Articles from other countries such as Denmark,(24)
Swiss,(25), Italy(26) and Israel(27) evaluated the
consump-tion of antibacterials in ICUs. However, these papers did not state if general, medical-surgical or inter-disciplinary ICUs were included, rendering a more consistent com-parison diicult.
Study limitations
his study main limitations were the small number of ICUs and these units choice-by-convenience, thus reduc-ing the possibility of generalization. Another limitation regards the use of DDD as the main measurement unit for antibacterials use quantiication. In patients staying in the ICU, for instance, generally more severely ill than those staying in other hospital departments, some antibacteri-als may be used in daily doses not relected by the DDD, resulting in distorted estimation of the actually consumed amounts.
CONCLUSION
he patterns of antibacterials consumption in the three ICUs analyzed in this study were not uniform. While the median of the total number of DDDs was signiicantly higher in the public hospitals’ ICUs, the average density of consumption was signiicantly higher in the private hospital’s ICU. Nevertheless, the most used antibacterials groups in the three ICUs were similar, and characterized for being more recently launched, having wider spectrum and being resistant-germs targeted drugs.
Compared to the international patterns, the ICUs analyzed in our study used more antibacterials, accord-ing to the average density of consumption. he most used antibacterials groups in our ICUs were more markedly diferent from those in Swedish ICUs, which were gener-ally narrow spectrum antibiotics. he diferences were less marked when compared to German ICUs, and the most used antibacterial groups were similar to the American ICUs.
RESUMO
Objetivo: conhecer e comparar os padrões de consumo de antibacterianos em unidades de terapia intensiva com base no sistema Anatomical herapeutic Chemical/Deined Daily Dose
(ATC/DDD).
Métodos: estudo de coorte, prospectivo, realizado em três unidades de terapia intensiva médico-cirúrgicas, duas locali-zadas em dois hospitais públicos e uma em hospital privado. Amostras aleatórias simples, independentes, dos pacientes inter-nados nas unidades de terapia intensiva no período de 10/2004 a 09/2005 foram utilizadas. O consumo de antibacterianos foi avaliado com o sistema ATC/DDD. A quantidade utilizada de antibacteriano nas unidades de terapia intensiva, em gramas, foi transformada em dose diária deinida (DDD). O número de DDD foi dividido pelo número de pacientes-dia e multiplica-do por mil, componmultiplica-do a densidade média de consumo por mil pacientes-dia (DDD1000).
utiliza-dos nas três unidades de terapia intensiva foram cefalosporinas de 3ª geração, penicilinas/inibidores de betalactamases, carbape-nêmicos e luorquinolonas.
Conclusão: os padrões de consumo de antibacterianos nas três unidades de terapia intensiva analisadas não foram uni-formes. A unidade de terapia intensiva do hospital privado utilizou quantidade signiicativamente maior, em termos de
densidade de consumo, do que as unidades de terapia intensiva dos hospitais públicos. Apesar disso, os grupos de antibacteria-nos mais utilizados nas três unidades de terapia intensiva foram semelhantes.
Descritores: Medidas em epidemiologia; Unidade de terapia intensiva; Agentes antibacterianos/administração & dosagem
REFERENCES
1. World Health Organizaton. WHO global strategy for con-tainment of antimicrobial resistance [Internet]. Switzer-land: WHO; 2001. [cited 2010 May 29]. Available from: http://www.who.int/csr/resources/publications/drugresist/ WHO_CDS_CSR_DRS_2001_2_EN/en
2. Meyer E, Jonas D, Schwab F, Rueden H, Gastmeier P, Daschner FD. Design of a surveillance system of antibiotic use and bacterial resistance in German intensive care units (SARI). Infection. 2003;31(4):208-15.
3. Talbot GH, Bradley J, Edwards JE Jr, Gilbert D, Scheld M, Bartlett JG; Antimicrobial Availability Task Force of the Infectious Diseases Society of America. Bad bugs need dru-gs: an update on the development pipeline from the Anti-microbial Availability Task Force of the Infectious Diseases Society of America. Clin Infect Dis. 2006;42(5):657-68. Erratum in: Clin Infect Dis. 2006 Apr 1;42(7):1065. 4. Monnet DL. Toward multinational antimicrobial
resis-tance surveillance systems in Europe. Int J Antimicrob Agents. 2000;15(2):91-101.
5. Fridkin SK, Steward CD, Edwards JR, Pryor ER,
McGo-wan JE Jr, Archibald LK, et al. Surveillance of antimi-crobial use and antimiantimi-crobial resistance in United States hospitals: project ICARE phase 2. Project Intensive Care Antimicrobial Resistance Epidemiology (ICARE) hospi-tals. Clin Infect Dis. 1999;29(2):245-52.
6. Walther SM, Erlandsson M, Burman LG, Cars O, Gill H, Hofman M, Isaksson B, Kahlmeter G, Lindgren S, Nils-son L, OlsNils-son-Liljequist B, Hanberger H; Icustrama Stu-dy Group. Antibiotic prescription practices, consumption and bacterial resistance in a cross section of Swedish inten-sive care units. Acta Anaesthesiol Scand. 2002;46(9):1075-817. Anatomical herapeutic Chemical (ATC) classi-ication index with Deined Daily Doses (DDDs). Oslo (Norway): WHO Collaborating Centre for Drug Statistics Methodology; 2005.
8. Browner WS, Newman TB, Cummings SR, Hulley SB. Estimando o tamanho de amostra e o poder estatístico: pontos básicos. In: Hulley SB, Cummings SR, Browner WS, Grady D, Hearst N, Newman TB, editors. Delinean-do a pesquisa clínica: uma abordagem epidemiológica. 2nd ed. Porto Alegre: Artmed; 2003. p. 83-110.
9. Garner JS, Jarvis WR, Emori TG, Horan TC, Hughes JM. CDC deinitions for nosocomial infections, 1988. Am J
Infect Control. 1988;16(3):128-40. Erratum in: Am J In-fect Control. 1988;16(4):177.
10. Emori TG, Culver DH, Horan TC, Jarvis WR, White JW, Olson DR, et al. National nosocomial infections sur-veillance system (NNIS): description of sursur-veillance me-thods. Am J Infect Control. 1991;19(1):19-35.
11. Knaus WA, Draper EA, Wagner DP, Zimmerman JE. APACHE II: A severity of disease classiication system. Crit Care Med. 1985;13(10):818-29.
12. Carneiro JCO. Padrão de consumo de antibacterianos em uma UTI geral: correlação com a resistência bacteriana [dissertação]. Brasília: Faculdade de Medicina da Univer-sidade de Brasília; 2006.
13. dos Santos EF, Lauria-Pires L, Pereira MG, Silva AE, Ro-drigues IP, Maia MO. Use of antibacterial agents in an in-tensive care unit in a hospital in Brazil. Braz J Infect Dis. 2007;11(3):355-9.
14. Muller A, Monnet DL, Talon D, Hénon T, Bertrand X. Discrepancies between prescribed daily doses and WHO deined daily doses of antibacterials at a university hospital. Br J Clin Pharmacol. 2006;61(5):585-91.
15. Natsch S, Hekster YA, de Jong R, Heerdink ER, Herin-gs RM, van der Meer JW. Application of the ATC/DDD methodology to monitor antibiotic drug use. Eur J Clin Microbiol Infect Dis. 1998;17(1):20-4.
16. Kuster SP, Ruef C, Ledergerber B, Hintermann A, Depla-zes C, Neuber L, Weber R. Quantitative antibiotic use in hospitals: comparison of measurements, literature review, and recommendations for a standard of reporting. Infec-tion. 2008;36(6):549-59.
17. Richards GA. he therapeutic challenge of Gram-negative sepsis: prolonging the lifespan of a scarce resource. Clin Microbiol Infect. 2005;11 Suppl 6:18-22.
18. Dellit TH, Owens RC, McGowan JE Jr, Gerding DN, Weinstein RA, Burke JP, Huskins WC, Paterson DL, Fish-man NO, Carpenter CF, Brennan PJ, Billeter M, Hooton TM; Infectious Diseases Society of America; Society for Healthcare Epidemiology of America. Infectious Diseases Society of America and the Society for Healthcare Epide-miology of America guidelines for developing an institu-tional program to enhance antimicrobial stewardship. Clin Infect Dis. 2007;44(2):159-77.
recom-mendations. Society for Healthcare Epidemiology of Ame-rica/Infectious Diseases Society of America. Infect Control Hosp Epidemiol. 2000;21(4):256-9.
20. Hanberger H, Erlandsson M, Burman LG, Cars O, Gill H, Lindgren S, Nilsson LE, Olsson-Liljequist B, Walther S; ICU-STRAMA Study Group. High antibiotic sus-ceptibility among bacterial pathogens in Swedish ICUs. Report from a nation-wide surveillance program using TA90 as a novel index of susceptibility. Scand J Infect Dis. 2004;36(1):24-30.
21. Kern WV, de With K, Steib-Bauert M, Fellhauer M, Plan-gger A, Probst W; MABUSE-INTERREGIO-II Project Team. Antibiotic use in non-university regional acute care general hospitals in southwestern Germany, 2001-2002. Infection. 2005;33(5-6):333-9.
22. Meyer E, Schwab F, Gastmeier P, Rueden H, Daschner FD. Surveillance of antimicrobial use and antimicrobial resistance in German intensive care units (SARI): a sum-mary of the data from 2001 through 2004. Infection. 2006;34(6):303-9.
23. National Nosocomial Infections Surveillance System. Na-tional Nosocomial Infections Surveillance (NNIS) Sys-tem Report, data summary from January 1992 through June 2004, issued October 2004. Am J Infect Control. 2004;32(8):470-85.
24. Petersen IS, Hesselbjerg L, Jorgensen L, Renstrup J, Barnung S, Schierbeck J, Jepsen OB. High antibiotic consumption in Danish intensive care units? APMIS. 1999;107(11):989-96.
25. Loeler JM, Garbino J, Lew D, Harbarth S, Rohner P. An-tibiotic consumption, bacterial resistance and their corre-lation in a Swiss university hospital and its adult intensive care units. Scand J Infect Dis. 2003;35(11-12):843-50. 26. Porretta A, Giuliani L, Vegni FE, Larosa M, Privitera G;
INF-NOS Study Group. Prevalence and patterns of anti-biotic prescribing in Italian hospitals. Infection. 2003;31 Suppl 2:16-21.