Mineral content and adequacy of oral hospital diets offered to chronic
kidney disease pre-dialysis patients
J. David Silva
a,*, D.C.F. Moreira
a, J.S. Manzolli de S
a
a
, A.S.A. Nemer
a,b, M.A. Morgano
c,
K.D. Quintaes
a,*aNutrition School, Federal University of Ouro Preto (UFOP), Brazil b
Department of Nutrition, Federal University of Juiz de Fora (UJFJ), Brazil
cInstitute of Food Technology (ITAL), Center of Foods Science and Quality, Campinas, S~ao Paulo, Brazil
a r t i c l e
i n f o
Article history:
Received 31 March 2014 Accepted 2 July 2014
Keywords:
Hospital oral diet Chronic renal failure Diet therapy
Nutritional recommendation Mineral nutrition
Dietetic supplement
s u m m a r y
Background &aims:The diet for patients with Chronic Kidney Disease (CKD) has important clinical impact on the disease progression. This study determined the contents of Ca, P, K, Na, Mg, Fe, Mn, Cu, Zn and Se in an oral hospital diet and a Oral Food Complement (OFC), prepared for CKD patients, with the adequacy quantified with respect to nutritional recommendations.
Methods: Samples of the diet were collected in a Brazilian public hospital, with mineral determination by ICP-OES. The Dietary Reference Intake and specific nutritional recommendations for CKD patients were used to assess the nutritional adequacy.
Results: About 14.3% of the diets produced for CKD patients were analyzed. The levels of P, K, Mn and Na were over the recommendation, with Na exceeding the Upper Level. Inadequacy of Ca and Se were observed for all groups and ages. Inadequate values of iron were found for adult women. The combi-nation of OFC with the diet was sufficient to provide adequate values of Fe, however, did not increase Ca and Se contents to adequate levels, and added unnecessary quantities of P, K and Na.
Conclusion: With the exception of K and P the diets exhibited insufficient mineral contents and toxic levels of Na. Diet menus and OFC compositions need to be changed to meet the nutritional recom-mendations and support the clinical assistance of CKD patients and also contribute to the nutritional education of this group.
©2014 European Society for Clinical Nutrition and Metabolism. Published by Elsevier Ltd. All rights reserved.
1. Introduction
Chronic Kidney Disease (CKD) is defined as the slow, gradual reduction of kidney function, frequently evaluated by the Glomer-ular Filtration Rate (GFR), and is usually irreversible[1,2]. The most frequent clinical manifestation of CKD is the uremic syndrome[2]
which attacks the multi-systems of the organism, which start to show serious physiological, biochemical and metabolic[2]changes, compromising the quality of life of the kidney patient.
Alterations in the organic mineral concentrations are amongst the uremic complications observed in these patients, and these
compounds can show excessive concentrations in the blood, such as P[1,3], K[4]and Na[3], or low concentrations, such as Fe[5], Cu
[6], Zn[6]and Se[7], creating a state of toxicity or shortage[8]. In the case of Se, low plasma levels of the element and of the activity of the enzyme GSH-Px are observed in these patients[7], according to the progression of the disease, and this situation can compro-mise the immunological function and increase susceptibility to diabetes and cardiovascular diseases[9].
With the decline in kidney function, alterations in Ca and P metabolism, such as hypocalcemia and hyperphosphatemia, are frequently observed in CKD patients [4]. This compromises the hormones PTH and calcitriol, involved in the genesis of secondary hyperparathyroidism and in the increased risk of heart diseases
[2]. Thus a diet restricted in P and adequate in Ca, with the pre-scription of compounds such as calcium carbonate, constitutes a dietetic conduct that can aid in the dietetic treatment of the kid-ney patient[10].
*Corresponding authors. Ouro Preto Federal University, School of Nutritione DENCS, Campus Morro do Cruzeiro, s/n, Bauxita, Ouro Preto, MG, Zip: 35400-000, Brazil. Tel.:þ55 31 3559 1818; fax:þ55 31 3559 1838.
E-mail addresses:[email protected],[email protected](K.D. Quintaes).
Contents lists available atScienceDirect
e-SPEN Journal
j o u r n a l h o m e p a g e : h t t p : / / w w w . e l s e v i e r . c o m / l o c a t e / c l n u
http://dx.doi.org/10.1016/j.clnme.2014.07.002
CKD patients under conservatory treatment (or pre-dialysis), designated as such since they are in stages I to IV of kidney dis-ease[2], are characterized as a group of individuals with specific nutritional objectives and dietary compositions[11], since the diet is a fundamental part of the therapeutic plan, showing a great impact when introduced prematurely[12].
Thus renal diet-therapy should be considered in the dietary composition, both qualitative and quantitative, since it is capable of influencing the biochemical parameters of the blood, minimizing uremic complications and contributing to an adequate nutritional state[12]. Malnutrition is very common amongst these patients, and is one of the factors contributing to long hospital stays of these patients and of their high hospital mortality[4]. In Brazil, in 2010, the monthly hospitalization rate of CKD patients was 5.3% [13]. According to Godinho et al. (2006)[4], the mean hospitalization time is 34 days amongst patients undergoing hemodialysis therapy. While it is recognized that diet, in conjunction with extensive hospitalization, can lead to CKD in patients, data regarding oral hospital diets received by CKD patients are scarce in the scientific literature. Thus the objective of the present study was to determine the contents of Ca, P, K, Na, Mg, Fe, Mn, Cu, Zn and Se in oral hospital diets and in the oral food complement (OFC) served to CKD patients, and evaluate the percent adequacy in relation to the recommen-dations for both the diet on its own and in association with an OFC.
2. Methodology
The mineral contents were determined in the renal oral diets provided by the Food and Nutrition Sector of a public Brazilian Hospital in Belo Horizonte, MG, Brazil. Samples were collected on two non-consecutive days in different weeks of the months of May and September 2010 and January 2011, covering a period of six weeks (42 days). The diets consisted of six meals: breakfast, collation, lunch, snack, dinner and supper. In addition, an oral food complement (OFC), formulated based on soymilk and fruit, was produced and offered according to specific dietary prescriptions. Samples of each meal and OFC were taken at the regular meal times following the normal hospital standard. Each meal and OFC was weighed on an electronic balance with a capacity for 15 kg and sensitivity of 2 g (Filizola, Pluris Top), homogenized in a multi-processor with a plastic helix, and a 50 g sample separated, stored in zipper-lock bags, labeled and frozen ( 18C) until chemically analyzed in the laboratory.
2.1. Mineral determinations
The contents of the minerals Ca, P, K, Na, Mg, Fe, Mn, Cu, Zn and Se were determined in the diet samples following the methodology described by Moreira et al. (2012)[14], Se being measured only on the basis of the total amount offered daily. Following digestion and dilution of the samples, the minerals were determined in duplicate using induced coupled plasma optical emission spectrometry (ICP-OES).
2.2. Instrumentation
All minerals were quantified using an induced coupled plasma optical emission spectrometer, model Vista MPX (VARIAN, Mul-grave, Australia) equipped with a 40 MHz radio frequency source, CCD (Charge Coupled Device) type solid state simultaneous multi-element detector, peristaltic pump, and a sea spray nebulizer coupled to the nebulizer chamber. The ICP Expert software was used and 99.996% pure liquid argon (Air Liquid, SP, Brazil) as the plasma gas. The following ICP-OES operating conditions were used: power of 1000 W; nebulizer rate of 0.9 L/min; liquid argon and
auxiliary gas rates of 15 and 1.5 L/min; integration and reading times of 10 and 3 s; and 3 replicates. The wavelengths used were: Ca, 317,933 nm; P, 213,618 nm; K, 766,491 nm; Na, 589,592 nm; Mg, 279,553 nm; Fe, 259,940 nm; Mn, 257,610; Cu, 324,754 nm; Zn, 206,200 nm and Se, 196,026.
2.3. Validation of the results of the analytical methodology
The methodologies used to determine the mineral elements were validated for the parameters of precision and exactness using certified reference material of the Typical Diet (1548a) obtained from the National Institute of Standards and Technology (NIST), obtaining results for exactness between 84 and 104% and for pre-cision between 3 and 10% for all the elements.
2.4. Nutritional adequacy
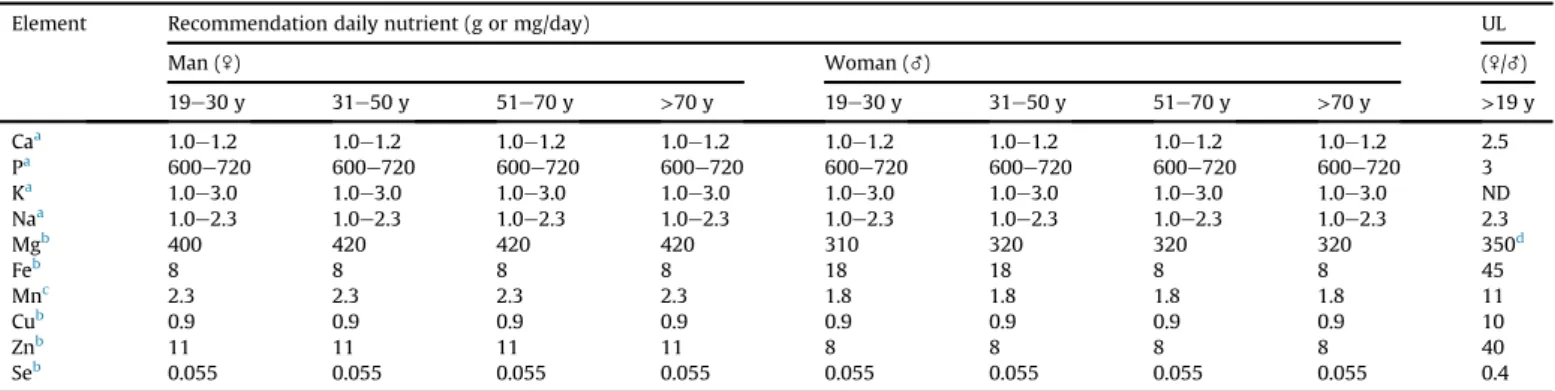
The nutritional adequacy was calculated based on the percent adequacy of the contents of the minerals Ca, P, K, Na, Mg, Fe, Mn, Cu, Zn and Se found in the oral renal hospital diets on their own and associated with an OFC, using the guidelines for the nutritional therapy of non-dialysis phase CKD patients[15] and the Dietary Reference Intakes (DRIs) [16] for adults (19e59 years old) and elderly (above 60 years) individuals of both genders as the pa-rameters. The values for daily intake, Recommended Dietary Allowance (RDA) or Adequate Intake (AI), Estimated Average Requirement (EAR) and Tolerable Upper Intake Levels (UL), rec-ommended by the Institute of Medicine (IOM)[16]were used as parameters to analyze the adequacy of the mineral contents of the renal diets (Table 1). For the minerals Ca, P, K and Na, the diets were considered adequate when these minerals met the minimum daily intake but did not exceed the recommended maximum daily intake
[15]. For the other minerals, the diets were considered adequate when the values were situated between the EAR (or AI) and the Recommended Dietary Allowance RDA, and inadequate when below the EAR (or AI). Values above the UL were adopted as inadequate for all minerals[16].
2.5. Statistical analyses
The statistical analyses were carried out using the PASW version 17.0 statistical software. The results were expressed as the arith-metic mean and standard deviation. The normality and homosce-dasticity of the data were verified by the ShapiroeWilk and Levene, tests, respectively. The analysis of variance (ANOVA) followed by the Bonferroni post-test were used when the variables showed a normal distribution, and the KruskaleWallis and U de Man-neWhitney tests when the conditions were non-parametric. The differences between the months with respect to the amounts of minerals present in the OFC and the differences between the amounts offered in the different periods, were checked using the Student t-test for parametric conditions, or by the U de Man-neWhitney test for non-parametric conditions. The same tests were used to detect differences in the mineral contents offered by the diets alone and when combined with an OFC, and the level of significance was set atp<0.05.
3. Results
The results of the chemical analyses showed that, of the meals, only supper showed differences between the months for all the mineral contents. For lunch, with the exception of K and Mg, all the minerals showed differences between the collection months, whereas for dinner, differences were found in the amounts of Ca, Na, Fe, Cu and Mn. The lunch and dinner meals carried the largest amounts of Na, P, K, Mg, Cu, Mn and Zn, whereas the breakfast and snack presented the highest Ca and Fe contents (Table 2).
With respect to the mineral content of the OFC, only Ca, K and Mg showed similar contents according to the collection month (September and January). In September the OFC showed larger amounts of P and Na, whereas in January, larger amounts of Fe, Cu, Mn, Zn and Se prevailed. With respect to the time offered, it was
noted that the OFC offered in the morning carried a significantly higher Zn content than that offered in the afternoon (Table 3).
Table 4shows the mean amounts of each mineral provided by the renal diets alone or associated with an OFC, and the percent adequacy reached under these two conditions for each month, age range and gender studied. There was a significant difference in the mean amounts of Ca, P, Na, Fe, Mn, Cu and Se (p<0.05) according to the collection month. The mineral Ca showed distinct means for each month, whereas the P, Na and Cu contents showed similar values in the diets served in the months of May and September, differentiated from the content found in January. In general the month of January showed a better profile of macro and micro-minerals, with the exception of Zn (Table 4).
Table 1
Recommendation of nutritional minerals for chronic renal patients undergoing non-dialysis.
Element Recommendation daily nutrient (g or mg/day) UL
Man (\) Woman (_) (\/_)
19e30 y 31e50 y 51e70 y >70 y 19e30 y 31e50 y 51e70 y >70 y >19 y
Caa 1.0
e1.2 1.0e1.2 1.0e1.2 1.0e1.2 1.0e1.2 1.0e1.2 1.0e1.2 1.0e1.2 2.5
Pa 600
e720 600e720 600e720 600e720 600e720 600e720 600e720 600e720 3
Ka 1.0
e3.0 1.0e3.0 1.0e3.0 1.0e3.0 1.0e3.0 1.0e3.0 1.0e3.0 1.0e3.0 ND
Naa 1.0
e2.3 1.0e2.3 1.0e2.3 1.0e2.3 1.0e2.3 1.0e2.3 1.0e2.3 1.0e2.3 2.3
Mgb 400 420 420 420 310 320 320 320 350d
Feb 8 8 8 8 18 18 8 8 45
Mnc 2.3 2.3 2.3 2.3 1.8 1.8 1.8 1.8 11
Cub 0.9 0.9 0.9 0.9 0.9 0.9 0.9 0.9 10
Znb 11 11 11 11 8 8 8 8 40
Seb 0.055 0.055 0.055 0.055 0.055 0.055 0.055 0.055 0.4
aFor minerals Ca, P, K and Na the recommendation followed the guidelines for nutrition therapy for patients in non-dialysis CRF, adopting the values minimums and
maximums in gram per day[15]. The others followed the Dietary Reference Intakes (DRIs) in milligram per day[16]. b RDA¼Recommended Dietary Allowance.
c Adequate Intake. ND¼not available. UL¼Tolerable Upper Intake Level.
d Values represent only intake agents pharmacological and don't include food and water intake.
Table 2
Amount of minerals supplied by renal diets in each meal and the total daily in January (J), 2011; May (M) and September (S), 2010.
Element Month Amount of minerals supplied by in each meal (mg/kg1)
Breakfast Collation Lunch Snack Dinner Supper
Mean±SD
Ca J 219±15.71a 12.79±2.07a 37.81±3.95a 314.41±156.27a 44.34±11.42a 7.46±0.94a
M 134.95±25.36b 9.59±0.37b 45.79±6.54b 60.69±33.10b 49.50±4.59a 14.32±7.74a,b
S 124.80±31.70b 5.90±0.27c 5.90±0.27c 127.55±8.71c 31.55±3.33b 18.66±3.66b
P J 112.05±6.63a 11.81±2.90a 185.92±6.80a 107.42±24.17a 172.79±4.93 7.52±0.93a
M 171.24±15.26b 11.00±4.28a 167.01±39.71a 85.71±19.38a 229. 34±148.10 39.06±15.77b
S 147.27±15.84c 6.65±0.44b 112.76±8.70b 156.74±9.93b 245.18±211.25 56.36±3.21c
K J 362.01±12.30a 38.54±12.23a 1139.99±646.11 633.99±173.94a 1007.58±522.85 72.59±12.31a
M 459.60±228.33a 95.99±13.60b 853.49±359.56 232.41±128.35b 951.16±300.96 56.25±21.87a
S 695.38±42.13b 100.38±3.36b 1031.94±125.54 503. 76±316.76a,b 763.79±417.70 191.48±109.48b
Na J 333.11±22.77a 8.39±3.38 435.18±393.47a 470.68±149.60 521.60±5.17a 9.10±5.17a
M 244.17±16.07b 9.80±1.78 2221.54±252.92b 396.92±302.86 1499.94±134.14b 74.25±23.89b
S 967.91±79.44c 11.72±1.87 1245.49±415.18c 550.82±489.38 987.96±51.18a 511.64±288.06c
Mg J 62.24±7.13 8.31±1.94a 106.02±54.57 88.92±25.66a 105.24±40.64 6.79±1.18a
M 73.61±28.86 7.71±0.22a 101.19±32.64 37.62±12.45b 112.91±21.14 29.81±9.76b
S 64.26±41.74 5.48±0.45b 103.02±5.15 76.89±39.77a.b 86.91±42.10 36.34±16.36b
Fe J 2.54±0.42a 0.12±0.05 1.55±0.21a 2.01±0.87 1.28±0.13a 0.08±0.05a
M 1.02±0.21b nd 0.50±0.12b 1.92±0.29 0.32±0.10b 0.86±0.40b
S 1.77±0.37c 0.1±0.01 0.89±0.27c 1.71±0.31 1.35±0.49a 1.39±0.45b
Mn J 0.88±0.09a 0.20±0.05 0.90±0.37a 0.80±0.27a 1.14±0.05a 0.15±0.05a
M 0.80±0.24a 0.15±0.16 1.11±0.21a 0.31±0.10b 3.39±2.94a 0.22±0.05b
S 0.46±0.06b 0.30±0.00 0.76±0.05a,b 0.45±0.09c 0.74±0.07b,a 0.30±0.00b
Cu J 0.24±0.04a 0.20±0.11 0.44±0.16a 0.20±0.00a 0.31±0.08a 0.05±0.05a
M 0.30±0.10a 0.10±0.01 0.22±0.05b 0.11±0.04b 0.22±0.05b 0.05±0.05a
S 0.17±0.11b nd 0.20±0.00b 0.16±0.05a,b 0.21±0.04b 0.10±0.00b
Zn J 1.64±0.07a 0.09±0.02 7.48±3.93a 1.45±0.13a 3.10±1.99 0.08±0.05a
M 0.80±0.20b nd 3.50±2.06b 0.49±0.16b 6.95±3.76 0.26±0.18b
S 0.72±0.06b 0.10±0.01 2.94±1.71b 0.70±0.08c 5.05±4.64 0.58±0.05c
nd: Below detection level;a,b,cDifferent letters in the same column indicate signi
The diets failed to comply with the recommendations for Ca in all the months studied, both alone and combined with an OFC. On the other hand, the P and Mn contents were adequate at all mo-ments for all groups and age ranges. The prescription of an OFC together with the renal diet significantly increased the offer of P, both in January (p ¼0.000) and in September (p¼0.02), the P
content extrapolating the UL in the latter case. The K content was slightly above the recommended maximum for all groups and age ranges in January and September, the supplementation offered in September providing significant amounts of this mineral.
The mineral Na was above the UL value in the diets offered in May and September, with the OFC associated with the diet in the latter month contributing even more of this mineral. The Mg, Mn, Cu and Zn content were adequate for both gender and age. The Fe content showed the greatest percent of inadequacy for adult women as a function of their greater organic requirement.
De-ficiencies of Se were found in September for both genders and age ranges.
The addition of the OFC in January increased the offer of the micro-minerals Fe (p¼0.000) and Cu (p¼0.02) and Mn (p¼0.04),
this supplementation being important to attain the EAR for Fe for the adult women group. In September there was no difference by adding OFC to the patient diet. No significant alteration was observed for Zn and Se with the supplemented diet, with OFC being inefficient to reach the EAR value for Se.
4. Discussion
To the best of our knowledge, the present study is a unique investigation of the broad spectrum of quantified minerals content in oral hospital diets served to CKD patients, and consequently it is difficult to compare these results with other researches. It is important to note that the oral diet served to hospitalized patients would be useful as a nutritional tool for patient education, as maintaining a correct nutrient balance during the entire hospital-ization time is important. Unbalanced mineral diets can be harmful,
even in the short time, to CKD patients. The diets provided to the patients suffering from CKD showed important inadequacies in the mineral nutrient contents, which could compromise their clinical treatment. The mineral Ca was deficient at all times for both sexes and age ranges. Other studies have also reported low offers of Ca in the diets for hemodialysis patients (413 mg/day)[17]and for chil-dren in conservatory CKD treatment (655 mg/day) [18], results similar to those found in the present study.
The inadequate offer of Ca in the diets studied could be attrib-uted to the restriction in dairy products in both the diets and the OFC, these being foods carrying expressive amounts of Ca[19], resulting in a lack of efficacy in the adequacy of the levels of this element. The use of soybean extract fortified with tricalcium phosphate (500 mg of Ca per portion) in substitution of bovine milk (300 mg Ca per portion) could be a good alternative according to researchers[20].
The diets did not go above the maximum recommended values for P[15]on any of the days analyzed, except when combined with the OFC in the month of September (Table 4). The addition of protein,fiber and carbohydrate modules to the OFC could have contributed to this result, since significant amounts of minerals are usually found in such modules[21].
The diets presented values above the recommended ones for K in the months of January and September, especially when associ-ated with the OFC. Vegetables, fruits, legumes and oil seeds constitute the main sources of this mineral, the selection of items with lower contents of this mineral and the preparation mode, discarding the water used in the preparation, being important nutritional strategies for the control of the dietary K content[1].
Na was the only mineral with concentrations above the UL in the diets offered in May and September. The offer of the OFC associated with the diet resulted in even larger amounts of this mineral. Chronic kidney failure patients have reduced renal capacity to appropriately regulate an overload of Na in the water, which could favor edema and HBP, the dietary restriction of Na being indicated to help control the blood pressure [3]. Heerspink et al. [22]. emphasized the importance of adopting a hypo-sodium diet, which is associated with a lower blood pressure and proteinuria, leading to better results during the development of the disease. A study involving kidney transplanted patients showed that despite ingesting less sodium than healthy individuals, 85% presented a mean daily ingestion above 2.3 g/day and 95% above 1.5 g/day[23]. The maximum recommended ingestion of Na for chronic kidney failure patients[13] is equivalent to the UL for this mineral ac-cording to the IOM[14].
Lunch and dinner were the meals with the greatest offer of Na. Considering that lunch corresponds to 35% of the total energy value of a diet[24]and that the maximum recommended ingestion of Na is 2.3 g[13], the total contribution of Na at lunch should be up to 805 mg/day, a value only found in the January meals. According to Bezerra (2008) [25] the preparation of beans with herb salt is capable of reducing the amount of Na served in a meal by 73%, and is well accepted by hospital patients. The use of herb-based seasoning and a reduction in the use of industrialized seasoning and sodium chloride are important strategies that can reduce the Na content of diets[26].
The adequacy of the Mg value in the diet in the present study is different from the reported by Moreira et al. (2012)[14]who found a low offer of this mineral in relation to the requirements in oral hospital diets served to oncologic patients. Dietary ingestion has been considered as a determinant factor in the serum Mg con-centrations in patients undergoing hemodialysis[27].
A low offer of Fe and Se in the diet of individuals with CKD or otherwise hospitalized has been reported in the literature[28,29]. The Fe content of the diets varied from 2.7 mg (May) to 7.55 mg
Table 3
Amount of minerals supplied by oral food complement (OFC) in September (S), 2010 and January (J), 2011.
Element Month Amount of minerals provided by oral food complement (mg)
Mean±SD
Morning OFC Afternoon OFC Total Daily
Ca S 375.43±43 NA 375.43±43
J 184.27±52.64 117.43±90.91 301.70±143.22
P S 264.50±6.04 NA 264.50±6.04a
J 36.48±2.60 36.02±4.21 72.50±2.86b
K S 332.38±10.25 NA 332.38±10.25
J 335.22±178.78 204.09±176.61 539.34±354.28
Na S 460.76±6.96 NA 460.76±6.96a
J 57.81±1.42 62.77±11.13 120.58±11.48b
Mg S 34.10±0.62 NA 34.10±0.62
J 38.48±20.51 18.02±13.84 56.50±34.29
Fe S 0.74±0.06 NA 0.74±0.06a
J 0.55±0.06 0.52±0.11 1.07±0.09b
Mn S 0.05±0.003 NA 0.05±0.003a
J 0.19±0.04 0.15±0.04 0.35±0.01b
Cu S 0.05±0.01 NA 0.05±0.01a
J 0.12±0.02 0.11±0.02 0.23±0.03b
Zn S 0.25±0.4 NA 0.25±0.4a
J 1.31±0.47x 0.79±0.69y 2.29±1.01b
Se S 0.004±0.00 NA 0.004±0.00a
J 0.004±0.01 0.005±0.01 0.010±0.01b
(January). The lower energy offer in the May diets could explain the reduced Fe content, since hypocaloric diets provide smaller amounts of vitamins and minerals[30]. Low Fe contents (6.28 mg) in the diet of kidney patients treated in a nephrology clinic in S~ao Paulo (SP, Brazil) were reported by Mafra et al. (2008) [28]. Se deficiency was also found in the September diets (Table 4), which was also reported by Mafra et al. (2008)[28], who found only 41.4% adequacy for this element. The smaller amounts of animal origin proteins in the lunch and dinner meals in September could have contributed to the low offer of minerals, since this food group provides an important dietary contribution of Zn, Se[28]
and Cu[29].
Researchers have shown that supplementation with 5 g/day of Brazil nuts (290.5
m
g Se) for 3 months was efficient in increasing theplasma and erythrocyte Se contents and the GSH-Px activity in the erythrocytes of hemodialysis patients[31]. In the present study, supplementation of the diet with the OFC turns the Fe contents adequate but did not contribute to adequate the contents of Se and Ca. According to Spanner and Ducan (2005)[32], the use of dietary supplements is highly prevalent amongst individuals with CKD, concern with the health being the main motive for adhesion to their use. However, the use of oral supplements could imply a reduced ingestion of the oral diet, principally lunch and dinner, which could result in a lower ingestion of minerals[29]. In the present study,
these meals were the ones that provided the greatest mineral contents, due to the inclusion of almost all the food groups. How-ever mineral supplementation in the form of capsules could be an alternative to be considered with a view to maintaining the food consumption of the patients[33].
Nevertheless food consumption by the patients who received the diets and OFC analyzed was not determined in the present study, and thus low ingestion could correspond to an even greater mineral deficit than that reported. The number of samples of renal diets taken, the taking of samples in a single hospital and the non-inclusion of the water in the mineral analyses represent other limitations of the results encountered. However, considering the lacuna of information concerning the mineral composition of oral hospital diets, the results presented indicate the need for better dietary planning.
5. Conclusions
The Ca, P, K, Na, Mg, Fe, Mn, Cu, Zn and Se contents in the oral hospital diets and oral food complements (OFC) received by CKD patients were determined in 14.3% of the menus. Although the diets exhibited adequate levels of Mg, Cu, Mn and Zn, the diets showed P, K and Na contents above the recommended values, with the latter extrapolating the UL (2.3 g). Calcium and Se deficits predominated
Table 4
Percentage of adequacy of minerals supplied by renal diets, alone or combined with oral food complemente, according to nutritional recommendations by gender and age groups.
Element Mean daily supply (mg) % of adequacy of supply minerals to nutrition recommendation
Renal DieteJanuary (2011)
Male Female
Diet DietþOFC Adult AdultþOFC Elderly ElderlyþOFC Adult AdultþOFC Elderly ElderlyþOFC
Ca* 636.36a 938.03 64
e53 94e78 64e53 94e78 64e53 94e78 64e53 94e78
P* 597.52ax 669.42ay 100
e83 112e93 100e83 112e93 100e83 112e93 100e83 112e93
K* 3254.7 3805.29 326e108 379e126 326e108 379e126 326e108 379e126 326e108 379e126
Na* 1819.59a 1940.17a 182
e79 194e84 182e79 194e84 182e79 194e84 182e79 194e84
Mg 377.51 434.01 114 131 108 124 148 170 142 164
Fe 7.55ax 8.62y 126 144 126 144 93 106 151 172
Cu 1.45ax 1.68ay 207 240 207 240 207 240 207 240
Mn 4.06ax 4.41ay 177 192 177 192 226 245 226 245
Zn 13.77 16.06 146 171 146 171 202 236 202 236
Se 0.082a 0.092a 182 204 182 204 182 204 182 204
Diet DietþOFC Renal DieteMay (2010)
Ca* 314.86b
e 32e26 e 32e26 e 32e26 e 32e26 e
P* 647.74b
e 108e90 e 108e90 e 108e90 e 108e90 e
K* 2648.89 e 265e88 e 265e88 e 265e88 e 265e88 e
Na* 4446.58b
e 445e193 e 445e193 e 445e193 e 445e193 e
Mg 362.86 e 110 e 104 e 142 e 137 e
Fe 2.7b
e 45 e 45 e 33 e 54 e
Cu 0.98b
e 140 e 140 e 140 e 140 e
Mn 6a
e 261 e 261 e 261 e 261 e
Zn 12.01 e 128 e 128 e 177 e 177 e
Se 0. 55a
e 122 e 122 e 122 e 122 e
Diet DietþOFC Renal DieteSeptember (2010)
Ca* 338.01cx 698.05y 34
e28 71e59 34e28 71e28 34e28 71e59 34e28 71e28
P* 721.62bx 1098.80by 120
e100 164e137 120e100 164e137 120e100 164e137 120e100 164e137
K* 3236.5x 4417.82y 324
e108 357e119 324e108 357e119 324e108 357e119 324e108 357e119
Na* 4269.69bx 4965.74by 427
e186 473e206 427e186 473e206 427e186 473e206 427e186 473e206
Mg 370.14x 533.28y 112 162 106 152 145 209 140 201
Fe 7.21a 9.11 120 152 120 152 89 112 144 182
Cu 0.86b 0.91b 123 130 123 130 123 130 123 130
Mn 2.78b 2.9b 121 123 121 123 154 157 154 157
Zn 9.97 10.22 106 108 106 108 146 150 146 150
Se 0.022ba 0.034b 49 76 49 76 49 76 49 76
*These minerals the recommendation followed the guidelines for nutrition therapy for patients in non-dialysis CRF[22], adopting the values minimums and maximums. The others followed the Recommended Dietary Allowances (RDA)[23].
a,b,cIndicate significative differences between months, or DietþOFC.
x,yStandy for significative differences in a mineral supply between the diet with and without OFC.
to all groups and age, whereas Fe was deficient in the adult women. The addition of the OFC to the diet made the Fe contents adequate but was inefficient in making the Ca and Se contents adequate, and made the P, K and Na levels more excessive. There is a need to alter the menus of the diets and of the OFC destined for CKD patients, with a view to attending the nutritional needs of these patients and collaborating with the clinical treatment. The oral hospital diet should be useful as a nutritional tool for the patient education.
Conflict of interest statement
The authors declare that they have no conflict of interest.
Acknowledgments
The authors are grateful to Oliveira APF, Raquel F. Milani RF and Gontijo AFL for help with sample data collection and analysis, to Fundaç~ao de Amparo a Pesquisa do Estado de Minas Gerais (FAPEMIG) for thefinancial support (APQ 01558-09) and grants to Moreira DFC, Quintaes KD and Morgano MA are grateful to Con-selho Nacional de Desenvolvimento e Científico e Tecnologico (CNPq - Brasil 237331/2012-8) for their grants.
References
[1] Cuppari L, Avesani CM, Mendonça C, Martini L, Monte JC. Doenças Renais. In: Cuppari L, editor. Guia de nutriç~ao: nutriç~ao clínica no adulto. S~ao Paulo: Manole; 2002. p. 189e220.
[2] KDOQI clinical practice guidelines for chronic kidney disease: evaluation, classification and stratification. Am J Kidney Dis 2002;39(1):1e266. [3] Hsu C, Chertow GM. Elevations of serum phosphorus and potassium in mild to
moderate chronic renal insufficiency. Nephrol Dial Transplant 2002;17: 1419e25.
[4] Godinho TM, Lyra TG, Braga PS, Queiroz RA, Alves JA, Kraychete AC, et al. Perfil do paciente que inicia hemodialise de manutenç~ao em hospital público em Salvador, Bahia. J Bras Nefrol 2006;28:96e103.
[5] Canziani MEF, Bastos MG, Bregman R, Filho RP, Tomiyama C, Draibe SA, et al. Defici^encia de ferro e anemia na doença renal cronica. J Bras Nefrol^ 2006;28(2):86e90.
[6] Thomson NM, Stevens BJ, Humphery TJ, Atkins RC. Comparison of trace ele-ments in peritoneal dialysis, hemodialysis, and uremia. Kidney Int 1983;23: 9e14.
[7] Zachara BA, Salak A, Koterska D, Manitius J, Wasowicz W. Selenium and glutathione peroxidases in blood of patients with different stages of chronic renal failure. J Trace Elem Med Biol 2004;17(4):291e9.
[8] Mafra D. Revis~ao: Minerais e doença renal cr^onica. J Bras Nefrol 2003;25(1): 17e24.
[9] Bianchi MLP, Antunes LMG. Radicais livres e os principais antioxidantes da dieta. Rev Nutr 1999;12(2):123e30.
[10] Martinez I, Saracho R, Montenegro J, Liach F. The importance of dietary cal-cium and phosphorous in the secondary hyperparathyroidism of patients with early renal failure. Am J Kidney Dis 1997;29(4):496e502.
[11] Druml W. Basics in clinical nutrition: nutritional support in renal disease. E SPEN Eur J Clin Nutr Metab 2010;5:54e7.
[12] Mitch WE, Remuzzi G. Diets for patients with chronic kidney disease, still worth prescribing. J Am Soc Nephrol 2004;15:234e7.
[13] Sesso RC, Lopes AA, Thome FS, Lugon JR, Santos DR. Relatorio do censo bra- sileiro de dialise de 2010. J Bras Nefrol 2011;33(4):442 e7.
[14] Moreira DCF, Sa JSM Cerqueira IB, Oliveira APF, Morgano MA, Amaya-Farfan J, Quintaes KD. Mineral inadequacy of oral diets offered to patients in a Brazilian hospital. Nutr Hosp 2012;27(1):288e97.
[15] Terapia nutricional para pacientes em fase n~ao-dialítica da doença renal cr^onica. S~ao Paulo, SP: Projeto diretrizes. Disponível em: www. projetodiretrizes.org.br, [acesso em 10 de nov de 2013].
[16] Institute of Medicine. Dietary Reference Intakes: Recommended Intakes for Individuals. Washington, DC: National Academy Press; 2004 [acesso em 20 de nov de 2013]. Disponível em:http:/www.iom.edu.
[17] Falessa E, Neitzke L, Barbosa GC, Molina MCB, Salaroli LB. Avaliaç~ao nutri-cional e consumo alimentar de pacientes com insuficiencia renal cr^ ^onica. Rev Bras Pesqui Saúde 2009;11(4):39e48.
[18] Trachtman H, Chan JCM, Boyle R, Farina D, Baluarte HJ, Chinchilli VM, et al. The relationship between calcium, phosphorus, and sodium intake, race, and blood pressure in children with renal insufficiency: a report of the growth failure in children with renal diseases (GFRD) study. Am Soc Nephrol 1995;6: 120e31.
[19] Tabela Brasileira de Composiç~ao de AlimentoseTACO. 4ªEdiç~ao. Campinas: SP; 2011 [acesso em 20 de nov de 2013]. Disponível em:.http//:www. unicamp.br.
[20] Heaney PR, Dowell MS, Rafferty K, Bierman J. Bioavailability of the calcium in fortified soy imitation milk, with some observations on method. Am J Clin Nutr 2000;71:1166e9.
[21] Nutriservice [homepage na Internet] Loja de suplementos alimentares com suporte nutricional. Disponível em:http//:www.nutriservice.com.br/produto. php?produto¼34, [acesso em 20 de nov de 2013].
[22] Heerspink HJ, Ninomiya T, Zoungas S, de ZD, Grobbee DE, Jardine MJ, et al. Effect of lowering blood pressure on cardiovascular events and mortality in patients on dialysis: a systematic review and meta-analysis of randomised controlled trials. Lancet 2009;373:1009e15.
[23] Van den Berg E, Geleijnse JM, Brink EJ, Baak MA, Heide JJH, Gans ROB, et al. Sodium intake and blood pressure in renal transplant recipients. Nephrol Dial Transplant 2012:1e8.
[24] Camargo EB, Botelho RA. Tecnica Dietetica- Seleç~ao e preparo dos alimentos-Manual de Laboratorio. 1ªEd. S~ao Paulo: Atheneu; 2005.
[25] Bezerra MN. Aceitaç~ao do sal de ervas em dieta hipossodica [Monografi a-especializaç~ao]. Universidade de Brasília, Centro de Excelencia em Turismo;^ 2008.
[26] Keith DS, Nichols GA, Gullion CM, Brown JB, Smith DH. Longitudinal follow-up and outcomes among a population with chronic kidney disease in a large managed care organization. Arch Intern Med 2004;164:659e63.
[27] Wyskida K, Witkowicz J, Chudek J, Wiçcek A. Daily magnesium intake and hypermagnesemia in hemodialysis patients with chronic kidney disease. J Ren Nutr 2012;22(1):19e26.
[28] Mafra D, Favaro DIT, Fouque D, Cozzolino SMF. Determination of trace ele-ments in the diet of non-dialyzed renal patients. Nutr Rev Soc Bras Alim Nutr J Braz Soc Food Nutr 2008;33(1):61e72.
[29] Moreira DCF, Sa JSM, Cerqueira IB, Oliveira APF, Morgano MA, Quintaes KD. Evaluation of iron, zinc, copper, manganese and selenium in oral hospital diets. Clin Nutr 2013.http://dx.doi.org/10.1016/j.clnu.2013.10.021. [30] Baladia E, Manera M, Basulto J. Las dietas hipocaloricas se asocian a una
ingesta baja de algunas vitaminas: una revision. Act Diet 2008;12(2):69e75. [31] Stockler-Pinto MB, Mafra M, Farage NE, Boaventura GT, Cozzolino SMF. Effect of Brazil nut supplementation on the blood levels of selenium and glutathione peroxidase in hemodialysis patients. Nutrition 2010;26:1065e9.
[32] Spanner ED, Ducan AM. Prevalence of dietary supplement use in adults with chronic renal insufficiency. J Ren Nutr 2005;15(2):204e10.