Contents lists available atScienceDirect
Leukemia Research
journal homepage:www.elsevier.com/locate/leukres
Research paper
Prognostic importance of Aurora Kinases and mitotic spindle genes
transcript levels in Myelodysplastic syndrome
Daniela de Paula Borges
a,b,c, Antônio Wesley Araújo dos Santos
a,c, Carlos Roberto Koscky Paier
c,
Howard Lopes Ribeiro Júnior
a,b,c, Marília Braga Costa
a,b,c, Izabelle Rocha Farias
a,b,c,
Roberta Taiane Germano de Oliveira
a,b,c, Ivo Gabriel da Frota França
a,c,
Gabrielle Melo Cavalcante
a,c, Sílvia Maria Meira Magalhães
a,b,c, Ronald Feitosa Pinheiro
a,b,c,d,⁎aCancer Cytogenomic Laboratory, Federal University of Ceara, Fortaleza, Ceara, Brazil bPost-Graduate Program in Medical Science, Federal University of Ceara, Fortaleza, Ceara, Brazil cCenter for Research and Drug Development (NPDM), Federal University of Ceara, Fortaleza, Ceara, Brazil dPost-Graduate Program of Pathology, Federal University of Ceara, Fortaleza, Ceara, Brazil
A R T I C L E I N F O
Keywords:
Myelodysplastic syndrome Cell cycle
Cancer biology Mitotic spindle Mitotic checkpoint
A B S T R A C T
Myelodysplastic syndrome (MDS) are a heterogeneous group of clonal disease characterized by insufficiency of bone marrow, increase of apoptosis and increased risk of acute leukemia progression. Proteins related to the mitotic spindle (AURKA,AURKB,TPX2), to the mitotic checkpoint (MAD2, CDC20) and the regulation of the cell cycle (p21) are directly related to chromosomal stability and tumor development. This study aimed to evaluate the mRNA expression levels of these genes in 101 MDS patients using a real-time PCR methodology. We iden-tified thatCDC20expression are increased in patients with dysmegakaryopoiesis (p = 0.024), thrombocytopenia (p = 0.000) and high-risk patients (p = 0.014, 0.018)MAD2expression are decreased in patients with 2 or 3 cytopenias (p = 0.000) and neutrophil below 800/mm3. TPX2is also overexpressed in patients presenting dysmegakaryopoiesis (p = 0.009). A decrease inAURKAandAURKBexpression were observed in patients with altered karyotype (p = 0.000), who presented dysplasia in 3 lineages (p = 0.000; 0.017) and hemoglobin in-ferior to 8 g/dL (p = 0.024). The expression ofAURKA,AURKBandMAD2(p = 0.000; 0.001; 0.025) were decreased in patients with hypoplastic MDS, associated with high frequency of chromosomal alterations and high mortality rate. This study reaffirms the importance of aurora kinases and mitotic spindle genes to the pathogenesis and clinical evolution of MDS.
1. Introduction
The Myelodysplastic syndromes (MDS) are a heterogeneous group of clonal diseases characterized by bone marrow insufficiency and an increase of apoptosis, leading to an ineffective hematopoiesis with dysplasias, peripheral cytopenias and increased risk of progression to acute myeloid leukemia (AML)[1,2].
Chromosomal abnormalities are presented in up to 50% of the MDS patients. The cytogenetics analysis contributes to the diagnosis, prog-nosis, assessment of response to therapy and clonal evolution[3,4]. The development of chromosomal alterations, which leads to the develop-ment of neoplasias, is related to malfunctioning of the cell cycle, re-sulting from mutations in genes encoding cell cycle proteins and sig-naling pathways due these genetic lesions[5].
The Aurora kinase family (Aurora-A, -B) is an important group of
serine/threonine kinases involved in several functions during mitosis. They are involved in regulation of chromosomal alignment and segre-gation, maturation separation of the centrosomes and formation of the mitotic spindle[6–8]. Dysfunction of these kinases can cause chromo-somal instability and is associated with tumorigenesis of several neo-plasias, as acute myeloid leukemia (AML)[9]. We previously demon-strated that tissue samples of MDS patients with abnormal karyotype presented higher AURKB protein expression than patients with normal karyotype[12]. Several modulating factors have been studied as acti-vators of Aurora A activity, location and stability. The most reported AURKA regulator is TPX2[10], a protein that plays an important role in the formation of mitotic spindle[10]. Many studies have associated the increased expression ofTPX2to chromosomal instability in and tumor development [11,12]. Nevertheless, we have not identified studies evaluating the mRNA expression ofTPX2in patients with MDS.
https://doi.org/10.1016/j.leukres.2017.11.013
Received 5 October 2017; Received in revised form 22 November 2017; Accepted 27 November 2017 ⁎Corresponding author at: 738 Pereira Valente St, Meireles, 60160250, Fortaleza, Ceará, Brazil.
E-mail address:[email protected](R.F. Pinheiro).
Available online 28 November 2017
0145-2126/ © 2017 Elsevier Ltd. All rights reserved.
The maintenance of chromosomal stability during the cell division is also related to the Spindle Assembly Checkpoint (SAC) that monitors the kinetochore-microtubule attachment, to prevent segregation errors [13,14]. When SAC is activated, the Anaphase Promoting Complex (APC) is inhibited by MAD2, which inactivates the protein CDC20 (responsible for the activation of APC), preventing the cell from en-tering at anaphase until the microtubules are correctly attached to the kinetochores[13–15]. Several studies have reported the overexpression of MAD2 andCDC20in the development and progression of human cancers, as lung tumor and gastric cancer[6–8]. Genga and colleagues [8]demonstrated for thefirst time that higher CDC20 and MAD2 ex-pressions were associated with presence of thrombocytopenia and complex karyotype in MDS patients.
The regulation of the cell cycle depends on several proteins, like CDKN1A (a.k.a. p21), which is a cyclin kinase dependent inhibitor that regulates the transitions from G1 to S and G2 to mitosis.p21has been related to the carcinogenesis of several tumors and has shown influence on the expression of genes related to the cell cycle, DNA repair and regulation of apoptosis[16,17].
The aim of this report was evaluate the correlation and prognosis of mRNA expression of genes related to the mechanisms of cell cycle regulation (p21), mitotic checkpoint (MAD2andCDC20) and mitotic spindle (AURKA,AURKBandTPX2) in MDS patients.
2. Patients, materials and methods
2.1. Patients
We evaluated 101 bone marrow samples MDS patients, diagnosed at Federal University of Ceará according to the WHO classification[18], from 2008 to 2015. The 101 samples were collected at the time of di-agnosis and bone marrow samples of 10 healthy volunteers were used as healthy control.
The study was approved by the Ethics Committee of the Federal University of Ceara and informed written consent was obtained from eacindividual.
2.2. Cytogenetic analysis
Conventional G-Banded karyotype analyses were prepared from bone marrow cells of 101 MDS patients. Briefly, cultures were estab-lished in RPMI 1640 medium (Gibco, Grand Island, NY, USA) con-taining 30% fetal calf serum. After a 24 h incubation, colcemid was added to cell culture for blocking of mitotic fuse (final concentration 0.05 mg/ml). After harvesting procedure, the cells were exposed to a KCl hypotonic solution (0.068 mol/L) andfixed withCarnoy’sbuffer (methanol/acetic acid in 3:1 proportion). The slides were prepared and stained with Giemsa solution. A minimum of 20 metaphases were analyzed whenever possible using CytoVision Automated Karyotyping System (Applied Imaging, San Jose, CA, USA).
2.3. Total RNA extraction
Total RNA extractions from isolated mononuclear cells (bone marrow), obtained from MDS patients, were performed with TRizol Reagent™ (Invitrogen, Carlsbad, CA, USA), according to the manu-facturer’s protocol.
2.4. cDNA synthesis
cDNA was generated from total RNA using the High Capacity cDNA Reverse Transcription kit®(Applied Biosystems, San Jose, CA, USA), according to the manufacturer’s protocol. cDNA synthesis was
gener-ated using Mastercycler Pro Vapor Protect Technology® machine (Eppendorf, Hamburg, Germany). cDNA samples were stored at−20 °C
until further use.
2.5. Quantitative real-Time PCR
Quantitative real-time PCR (qPCR) reactions were based on TaqMan methodology®(Applied Biosystems, Carlsbad, CA, USA) and performed on a 7500 Fast System®(Applied Biosystems, Carlsbad, CA, USA). Pre-developed TaqMan gene expression assays (Assays-on-Demand, Applied Biosystems, Carlsbad, CA, USA) forAURKA(Hs01582072_m1),AURKB (Hs00945858_g1), TPX2 (Hs00201616_m1) MAD2 (Hs01554513_g1), CDC20(Hs00426680_mH) and CDKN1A(Hs0035782_m1), as well as the TaqMan Universal Master Mix II®(Applied Biosystems, Carlsbad, CA, USA) were used to quantify mRNA expression.
To normalize input cDNA, three reference genes were used: beta-2-microglobulin gene (B2M), glyceraldehyde 3-phosphate dehydrogenase (GAPDH) and ubiquitin C (UBC). The standard deviation of each re-ference gene was calculated based on the Cq value. After analysis of the standard deviation, a Pearson correlation coefficient was calculated for each pair of candidate reference genes. Then, the geometric mean of all reference genes was made (also known as the central tendency average or INDEX) and Pearson's correlation of each gene was separately ob-tained with the index. The reference genes that had the lowest standard deviation and the highest correlation were considered the most stable. Thus,B2MandGAPDHwere selected.
Each sample was performed in duplicate and the expression ratios were calculated using the 2−ΔCq
method[19]from the Cq values pro-vided by the 7500 Real-Time PCR System software (Applied Biosys-tems, Inc., Foster City, CA, USA).
2.6. Statistical analysis
Data on relative mRNA expression (ΔCqvalues–quantitative cycle) were expressed as mean and range (maximum and minimum) in order to determine the possible association between relative gene expressions and variables. Normality was evaluated by Shapiro-Wilk test. Outliers were removed. The Student’st-test or one-way ANOVA with Tukey/ Games Howellpost-hoctest were used to analyze the influence of re-lative expression regarding these variables: age, WHO classification [18], low risk vs. high risk, bone marrow cellularity, dysplasias (number of dysplasias, dyseritropoiesis, dysgranulopoiesis, dysmega-karyopoiesis), IPSS-R variables [20](blast count, hemoglobin count, absolute neutrophil count - ANC, platelets), number of citopenias, karyotype (normal vs. abnormal, aneuploidy, del(5q), del(7q), number of alterations, IPSS-R prognostic), risk classification (IPSS-R), transfu-sion dependency, death and AML evolution. The variance homogeneity for all variables analysis was evaluated by Levene's test.
The overall survival of MDS patients regarding expression was evaluated by the Kaplan-Meier method. For this analysis, the gene ex-pression variable was readjusted to cutoff points established by the Cutoff Finder algorithm [21]. The best cutoff point predicting MDS survival based on the gene expression was calculated by this software, through Kaplan Meyer curve analysis based on the log-rank test. Also, a multiple regression were run to predict the overall survival from MAD2, CDC20, TPX2, AURKB, AURKA, P21 mRNA expression and other fac-tors. The assumptions of linearity, independence of errors, homo-scedasticity, unusual points and normality of residuals were tested.
ThePearson'scorrelation test was used for obtaining the r and the r-square (r2) values, that demonstrates the influence of mRNA expression level of a given gene over other one.
Table 1
Summary of clinical and laboratory characteristics.
Case Gender Age Karyotype WHO IPSS-R
1 F 28 46,XX[20] RARS Low
2 M 24 46,XY[9] RCMD Intermediate
3 M 57 No metaphase RCMD –
4 F 78 46,X,i(x)(q10),del(17)(q22q23.3)[7]/46,XX[13] RCUD Low
5 F 69 46,XX,del(5)(q12q33)[18]/46,XX[2] Isolated del
(5q)
Low
6 F 41 No metaphase RCMD –
7 F 84 46,XX[20] RCUD Very Low
8 F 77 46,XX[20] RCMD Low
9 M 76 178∼182 < 7N > ,XXXXXXXXYYYYYYY…[24]/46,XY[5] CMML –
10 M 85 46,XY[15] RARS Low
11 M 48 46,XY,del(4)(q31)[4]/46,XY,del(5)(q21q33)[3]/46,XY[15] RCMD Intermediate
12 M 67 No metaphase RAEB II –
13 M 31 46,XY[24] RCMD Intermediate
14 M 74 46,XY[20] RAEB I Intermediate
15 M 62 No metaphase RCMD –
16 M 53 46,XY[20] RCMD Intermediate
17 F 65 46,XX[20] RCMD Low
18 M 67 No metaphase RAEB I –
19 M 64 46,XY[17] CMML –
20 M 91 46,X-Y[4]/46,XY[16] RARS Low
21 M 62 47,XY,+8[6]/47,XY,del(7)(q32),+8[7]/46,XY[2]. RAEB II Very High
22 M 85 46,XY[20] RAEB I Intermediate
23 F 65 46,XY[9] t-MDS –
24 M 33 46,XY[5] RCMD Intermediate
25 F 84 46,XX,del(20)(q13.1)[7]/46,XX[16] RCUD Very Low
26 F 72 46,XX[6] RCUD Very Low
27 F 51 46,XX[11] RARS Very Low
28 M 62 47,XY,+15[10]/46,XY[10] RCMD Intermediate
29 M 45 47,XY,+mar[3]/46,XY[17] RCMD Intermediate
30 M 67 46,XY[20] RAEB I Intermediate
31 M 70 No metaphase RCMD –
32 M 89 46,XY[17] RAEB II Intermediate
33 M 82 46,XX[20] RARS Low
34 F 77 No metaphase RAEB I –
35 M 68 No metaphase RAEB II –
36 M 80 47,XY,+8[12]/46,XY[8] RAEB I Intermediate
37 M 89 46,XY,del(5)(q31q35)[6]/46,XY[17] RCMD Intermediate
38 F 87 46,XX[20] RAEB I Intermediate
39 M 83 46,XY,del(17)(q22)[3]/47,XY,+mar[4]/46,XY[20] RCMD Low
40 F 42 No metaphase RARS –
41 M 76 46,XY[20] RCMD Very Low
42 F 67 46,XX[7] RCMD Low
43 M 79 No metaphase RCMD –
44 M 69 46,XY,del(5)(q15q33)[7]/46,XY[11] RCMD Intermediate
45 M 96 No metaphase RCUD –
46 M 82 No metaphase RCMD –
47 F 30 90,XXXX,−6,−7,−8,−11,+21,+22[5]/46,XX,del(7)(q23),del(20)(q13.1)[3]/45,XX,−7[5]/45∼46,XX,−7,del(7) (q32),del(11)(q32),−17,del(17)(p11.2),del(20)(q13.1)[cp11]
RAEB II Very High
48 M 81 46,XY[20] CMML –
49 M 62 No metaphase RCMD –
50 M 40 46,XY[10] RCMD Intermediate
51 M 66 47,XY,+mar[5],46,XY[11] RCMD High
52 M 45 46,XY,-?10,+mar[5]/46,XY[1] RCMD Intermediate
53 M 43 46,XY[5] RCMD Low
54 M 77 46,XY,add(13)(p11)[12]/46,XY,del(7)(q32),add(13)(p11)[4]/48,XY,add(13)(p11),+22,+mar[9]/48,XY,del(7)(q32),add (13)(p11),+22,+mar[3]/46,XY[2]
RCMD High
55 M 86 No metaphase RCMD –
56 M 79 89,XXY,−20,−22,−Y[4]/46,XY,del(16)(?q22)[5]/46,XY[11] RCMD Intermediate 57 M 49 47,XY,+mar[6]/48,XY,+8,del(16)(?q22),+mar[4]/47∼50,XY,del(4)(?q35),+8,+10,+11,del(16)(?q22),+21,+mar
[cp8]
RCMD High
58 M 70 47,XY,del(5)(q31),+mar[7]/46,XY,del(11)(q23)[3]/46,XY,del(5)(q31),del(11)(q23)[5]. RCMD Low
59 M 87 46,XY[6] RCMD Low
60 M 59 No metaphase RCMD –
61 M 47 46,XY[8] RCMD Low
62 M 48 46,XY RCMD Low
63 M 64 37,X,−2,−3,−9,−11,−12,−15,−16,−18,−Y[8]/46,XY,del(5)(q15q33)[5]/46,XY[6] RAEB II Very High
64 M 80 No metaphase RCMD –
65 M 89 46,XY[10] RCMD Low
66 F 57 46,XX[20] RCMD Low
67 F 80 46,XX[20] RCMD Intermediate
68 F 47 46,XX[15] RCUD Low
69 F 59 No metaphase RCMD –
3. Results
3.1. Patients
One hundred one MDS patients were classified according to the WHO 2008 [] (9 RCUD, 12 RARS, 52 RCMD, 9 RAEB-I, 8 RAEB-II, 4 CMML, 1 isolated del(5q) and 6 MDS related to therapy). The clinical and laboratory characteristics of the patients are presented inTable 1. The mean age was 65 years (range 23–96 years), with pre-dominance of male (54.45%). Regarding the risk group, the patients were classified according to IPSS-R[20], with a predominance of low risk and intermediate risk patients, both with 39.34% of the cases (Table 1). Cytogenetic analysis was performed in all 101 patients. Of these, 40 (57.97%) presented normal karyotype, 29 (42.03%) showed abnormal karyotype and 32 (31.68%) presented no metaphases.
3.2. mRNA expression
We evaluated the associations among levels of mRNA expression of AURKA,AURKB,MAD2,CDC20,TPX2andp21regarding clinical and laboratory variables (All data regarding mRNA expression are pre-sented in Supplementary material 1).
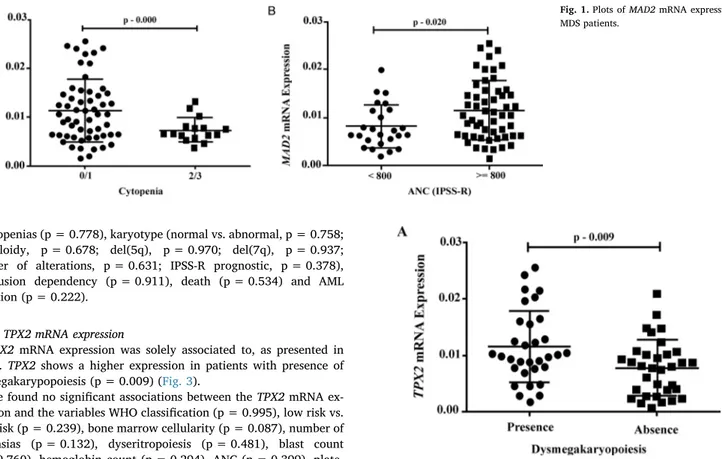
3.2.1. MAD2 mRNA expression
Significant associations were found between MAD2 mRNA expres-sion and the variables cellularity, number of cytopenias and neutrophils count, as presented inFig. 1.
MAD2 expression is lower in MDS patients (p = 0.021) than in healthy control group. We found a lower expression of MAD2in pa-tients with hipocelular bone marrow in comparison with papa-tients with normocelular bone marrow (p = 0.025) as well as patients with 2 or 3 cytopenias (p = 0.000) (Fig. 1A) and absolute neutrophils count (ANC)
[20]inferior to 800/mm3(p = 0.020) (Fig. 1B).
We found no significant associations between MAD2 mRNA ex-pression and the variables WHO classification (p = 0.946), low risk vs. high risk (p = 0.091), number of dysplasias (p = 0.654), dyseri-tropoiesis (p = 0.123), dysgranulopoiesis (p = 0.891), dysmegakar-yopoiesis (p = 0.445), blast count (p = 0.165), hemoglobin (p = 0.892), platelets (p = 0.469), karyotype (normal vs. abnormal, p = 0.333; aneuploidy, p = 0.446; del(5q), p = 0.741; del(7q), p = 0.195; number of alterations, p = 0.973; IPSS-R prognostic, p = 0.223), IPSS-R risk classification (p = 0.337), transfusion de-pendency (p = 0.205), death (p = 0.457) and AML evolution (p = 0.497).
3.2.2. CDC20 mRNA expression
Significant associations regarding CDC20 mRNA expression were found for the variables dysmegakaryopoiesis, platelets count and risk group according to IPSS-R[20], as presented inFig. 2.
Two important associations regarding the megakaryocytic lineage were found. Patients that presented dysplasia showed a significant higherCDC20 expression than patients without dysmegakaryopoiesis (p = 0.024) (Fig. 2A). Corroborating thisfinding, patients with lower platelets count (< 100.000/mm3) were associated with higher levels of CDC20mRNA expression when compared to those with platelets count above 100.000/mm3(p = 0.031) (Fig. 2B).
High risk patients showed increased expression of CDC20 compared to low risk (p = 0.014) and intermediated risk (p = 0.018) groups according to IPSS-R[20](Fig. 2C).
We found no significant associations between CDC20 mRNA ex-pression regarding the variables WHO classification (p = 0.075), low risk vs. high risk (p = 0.923), number of dysplasias (p = 0.413), dys-eritropoiesis (p = 155), dysgranulopoiesis (p = 0.265), blast count (p = 0.727), hemoglobin count (p = 0.614), ANC (p = 0.960), number Table 1(continued)
Case Gender Age Karyotype WHO IPSS-R
71 F 66 No metaphase RARS –
72 F 57 46,XX[8] RCMD Intermediate
73 F 71 No metaphase RCMD –
74 F 65 No metaphase t-MDS –
75 F 83 46,XX[20] CMML –
76 F 72 No metaphase RAEB II –
77 F 65 No metaphase RCMD –
78 F 41 44,XX,−13,−17[4]/46,XX[5] RCMD Intermediate
79 F 71 175,XXXXXXXX,−5,−6,−7,−8,−9,−11,−13,−14[4]/46,XX,del(5)(q15q33)[8]/46,XX[19] t-MDS –
80 F 60 No metaphase RCUD –
81 F 84 No metaphase RARS –
82 F 74 No metaphase RCMD –
83 F 81 46,XX[5] RARS Low
84 F 46 46,XX[8] RCUD Low
85 F 36 No metaphase t-MDS –
86 M 59 46,XY,del(5)(?q15q33)[8]/46,XY[12] RARS Intermediate
87 F 64 No metaphase RCMD –
88 M 74 46,XY[11] RAEB I High
89 F 23 46,XX,del(5)(q15q33)[4]/46,XX[18] RCMD Low
90 F 40 No metaphase RCMD –
91 F 81 47,XX,t(4;11)(q27;q32),+mar[4]/46,XX[16] RCMD Intermediate
92 F 77 46,XX[3] RCMD Low
93 F 26 46,XX,del(17)(q11.2)93]/46,XX[4] t-MDS –
94 M 67 No metaphase RCMD –
95 F 73 46,XX[12] RARS Very Low
96 F 59 46,XX[20] RCUD Low
97 M 74 46,XY[6] RARS Low
98 M 73 No metaphase RAEB II –
99 M 66 No metaphase RAEB I –
100 F 81 46,XX[20] t-MDS –
101 F 70 No metaphase RCMD –
of cytopenias (p = 0.778), karyotype (normal vs. abnormal, p = 0.758; aneuploidy, p = 0.678; del(5q), p = 0.970; del(7q), p = 0.937; number of alterations, p = 0.631; IPSS-R prognostic, p = 0.378), transfusion dependency (p = 0.911), death (p = 0.534) and AML evolution (p = 0.222).
3.2.3. TPX2 mRNA expression
TPX2mRNA expression was solely associated to, as presented in Fig. 3. TPX2shows a higher expression in patients with presence of dysmegakarypopoiesis (p = 0.009) (Fig. 3).
We found no significant associations between theTPX2mRNA ex-pression and the variables WHO classification (p = 0.995), low risk vs. high risk (p = 0.239), bone marrow cellularity (p = 0.087), number of dysplasias (p = 0.132), dyseritropoiesis (p = 0.481), blast count (p = 0.760), hemoglobin count (p = 0.294), ANC (p = 0.399), plate-lets (p = 0.950), number of cytopenias (p = 0.685), karyotype (normal vs. abnormal, p = 0.174; aneuploidy, p = 0.317; del(5q), p = 0.970; del(7q), p = 0.441; number of alterations, p = 0.654; IPSS-R prog-nostic, p = 0.333), IPSS-R risk classification (p = 0.511), transfusion dependency (p = 0.188), death (p = 0.844) and AML evolution (p = 0.179).
3.2.4. AURKA mRNA expression
RegardingAURKAexpression, significant associations were found with variables cellularity, number of dysplasias and karyotype (normal/
abnormal, del(5q), del(7q) and number of alterations) as presented in Fig. 4.
Regarding cellularity, we found a lower expression ofAURKAin patients with hipocelular bone marrow, in comparison with patients with normocelular bone marrow (p = 0.016) and with patients with hypercellular bone marrow (p = 0.000).
Regarding number of dysplasias in bone marrow, we found that AURKA expression is lower in patients who presented a 3-lineage Fig. 1.Plots ofMAD2mRNA expression of MDS patients.
Fig. 2.Plots ofCDC20mRNA expression of MDS patients.
dysplasia, compared 2-lineage dysplasia (p = 0.000) (Fig. 4A) and one lineage (p = 0.017) (Fig. 4A).
Regarding karyotype analysis, we observed higher levels ofAURKA expression in patients with normal karyotype, in comparison to patients with abnormal karyotype (p = 0.000) (Fig. 4B) and complex karyotype (p = 0.008) (Fig. 4C); with patients that presented alterations in chromosome 7 (p = 0.010) and with patients that presented alterations in chromosome 5 (p = 0.008).
We found no significant associations between theAURKAmRNA expression and the variables WHO classification (p = 0.105), low risk vs. high risk (p = 0.097), dyseritropoiesis (p = 0.130), dysgranulo-poiesis (p = 0.185), dysmegakaryodysgranulo-poiesis (p = 0.169), blast count (p = 0.644), hemoglobin count (p = 0.773), ANC (p = 0.236), plate-lets (p = 0.504), number of citopenias (p = 0.186), IPSS-R prognostic (p = 0.444), IPSS-R risk classification (p = 0.0.068), transfusion de-pendency (p = 0.188), death (p = 0.872) and AML evolution (p = 0.250).
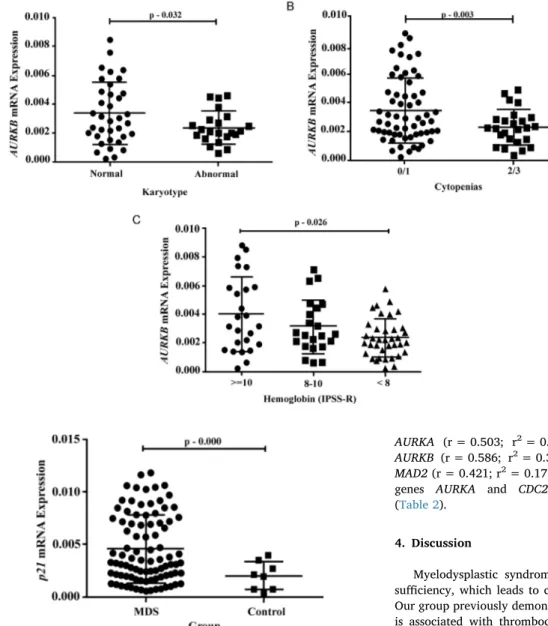
3.2.5. AURKB mRNA expression
The variables cellularity,fibrosis, number of cytopenias, karyotype (normal/abnormal) and hemoglobin correlated with AURKB expres-sion, as presented inFig. 5.
Related to the karyotype analysis, we observed a higher levels of AURKB expression in patients with normal karyotype in comparison with the patients with abnormal karyotype (p = 0.032) (Fig. 5A). Pa-tients with hipocelular bone marrow presented a lower expression of AURKBin comparison with patients with normocelular bone marrow (p = 0.016) and hypercellular bone marrow (p = 0.001).
AURKBshowed a lower expression profile in patients that presented 2 or 3 cytopenias (p = 0.003) (Fig. 5B). The lower expression of this gene is also presented in patients with hemoglobin[20]inferior to 8 g/ dL when compared to patients with hemoglobin count superior to 10 g/ dL (p = 0.026) (Fig. 5C).
We found no significant associations between the AURKBmRNA expression and the variables WHO classification (p = 0.437), low risk vs. high risk (p = 0.332), number of dysplasias (p = 0.716), dyseri-tropoiesis (p = 0.110), dysgranulopoiesis (p = 0.891), dysmegakar-yopoiesis (p = 0.445), blast count (p = 0.377), ANC (p = 0.333),
platelets (p = 0.113), karyotype (aneuploidy, p = 0.202; del(5q), p = 0.303; del(7q), p = 0.055; number of alterations, p = 0.341; IPSS-R prognostic, p = 0.825), IPSS-IPSS-R risk classification (p = 0.053), transfusion dependency (p = 0.205), death (p = 0.353) and AML evolution (p = 0.299).
3.2.6. p21 mRNA expression
MDS patients showed a higher p21 mRNA expression than the healthy control group (p = 0.000) (Fig. 6). We found no significant associations between the p21 mRNA levels and the variables WHO classification (p = 0.502), low risk vs. high risk (p = 0.076), bone marrow cellularity (p = 0.098), number of dysplasias (p = 0.912), dyseritropoiesis (p = 0.725), dysgranulopoiesis (p = 0.516), dysme-gakaryopoiesis (p = 0.096), blast count (p = 0.098), hemoglobin count (p = 0.061), ANC (p = 0.846), platelets (p = 0.085), number of citopenias (p = 0.071), karyotype (normal vs. abnormal, p = 789; aneuploidy, p = 0.230; del(5q), p = 0.213; del(7q), p = 0.167; number of alterations, p = 0.183; R prognostic, p = 0.458), IPSS-R risk classification (p = 0.901), transfusion dependency (p = 0.065), death (p = 0. 731) and AML evolution (p = 0.253).
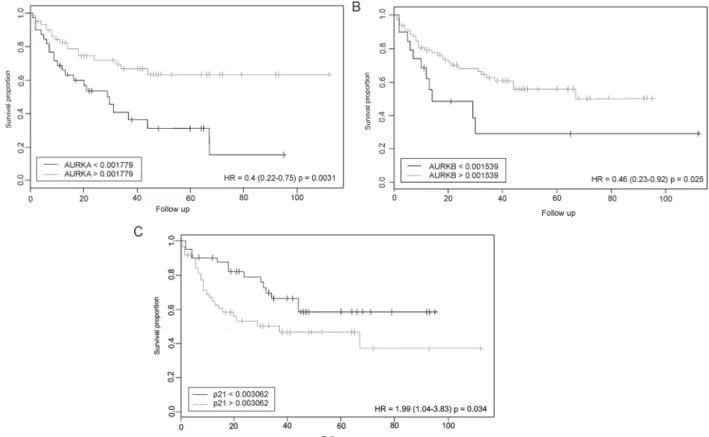
3.3. Overall survival based on levels of mRNA expression
The association between expression levels of the analyzed genes and the overall survival of the MDS patients was based on the cutoffdefi -nition established by the CutoffFinder algorithm[21]for each gene expression profile and the log-rank test associated with the Kaplan-Meier survival curve plot.
Regarding the AURKA gene, it was observed that patients with mRNA expression below thecutoffvalue (0.001779) were associated with a lower overall survival when compared with patients with mRNA expression above 0.001779 (p = 0.0031; HR = 0.4) (Fig. 7A). Fol-lowing the same pattern ofAURKAgene, we found that lowerAURKB mRNA expression levels (cutoffvalue below 0.001539) were associated with a lower overall survival of MDS patients (p = 0.025; HR = 0.46) (Fig. 7B). Ultimately, we observed that patients withp21 mRNA ex-pression above the cutoff value (0.003062) were associated with a higher overall survival (p = 0.034; HR = 1.99) (Fig. 7C).
We found no significant associations between the expression levels of TPX2 (p = 0.067), MAD2 (p = 0.13) and CDC20 (p = 0.11) re-garding the overall survival of MDS patients by CutoffFinder software. A multiple regression was run to predict Overall Survival from MAD2, CDC20, TPX2, AURKB, AURKA, P21 mRNA expression, IPSS-R category, presence of dysplasia, age, blasts count, transfusion depen-dence, karyotype and AML transformation. The assumptions of line-arity, independence of errors, homoscedasticity, unusual points and normality of residuals were met. In thefinal model, the variables TPX2 (p = 0.008), AURKB (p = 0.03), CDC20 (p = 0.009), MAD2 (p = 0.001), blast counts (p = 0.031) and IPSS-R (p = 0.036) added statistically significant to the prediction of overall survival (All data regarding multiple regression are presented in Supplementary material 2).
3.4. Correlation analysis between the levels of mRNA expression
We observed a strong correlation between the genes TPX2 and CDC20 (r = 0.797; r2= 0.635; p = 0.000) (Table 2); AURKA and AURKB(r = 0,652; r2= 0.425; p = 0.000) (Table 2) and between the genes AURKB and CDC20 (r = 0.645; r2= 0.416; p = 0.000) (Table 2).
A moderated correlation was found between the genesTPX2and
AURKA (r = 0.503; r2= 0.253; p = 0,000) (Table 2); TPX2 and AURKB (r = 0.586; r2= 0.343; p = 0.000) (Table 2); AURKA and MAD2(r = 0.421; r2= 0.178; p = 0.000) (Table 2); and between the genes AURKA and CDC20 (r = 0.566; r2= 0.343; p = 0.000) (Table 2).
4. Discussion
Myelodysplastic syndrome is characterized by bone marrow in-sufficiency, which leads to cytopenias in up to three lineages[3,22]. Our group previously demonstrate that high CDC20 protein expression is associated with thrombocytopenia, three cytopenias and complex karyotype in MDS patients[8]. In the present study we found higher levels of CDC20 in patients with thrombocytopenia (platelet < 100.000/mm3), dysmegakaryopoiesis and high-risk according to IPSS-R[20]. Indeed, platelet count below 100.000/mm3is associated with a low overall survival in MDS patients[20]. Thus, upregulations of both mRNA and protein[8]expression levels of theCDC20gene converge and confirm that this target is a molecular marker of unfavorable prognosis in MDS patients. CDC20 plays a central role in mitosis reg-ulation and progression, and its misregreg-ulation is associated with mitotic abnormalities like aneuploidy[23,24]and its overexpression predicted poor clinical outcomes in multiple human neoplasms[6,7,25]. These data corroborate the poor prognosis ofCDC20high expression rates in MDS patients.
Similarly toCDC20gene,TPX2also have a higher mRNA expression in patients with dysmegakaryopoiesis. These two genes have a strong correlation in MDS patients, probably becauseTPX2is one of the sub-strates of APC, which is regulated by CDC20, and TPX2 fluctuation levels are identical toCDC20 [26,27]. These results demonstrate that these genes work in a dependent manner in a cascade of events. As overexpression ofCDC20 leads to inadequate APC activation and to chromosomal instability, malfunction of APC can diminish the stability of TPX2, reinforcing the abnormal spindle phenotype and cell cycle arrest[26,27]. Malfunction of TPX2correlates with tumorigenesis in mouse models[28]and progress of several types of cancer[10,29].
MAD2, another gene implicated in the mitotic spindle checkpoint, presented a lower mRNA expression in patients with 2 or 3 cytopenias Fig. 5.Plots ofAURKBmRNA expression of MDS patients.
and neutrophils count inferior to 800/mm3, both variables described as a poor prognosis for MDS patients according to IPSS-R[20]. However, studies with mice models present controversial results regardingMAD2: both increase and decrease in its expression induced aneuploidy and tumorigenesis [30,31]. Despite the contradictory discoveries about MAD2 mRNA expression, some clinical findings in other neoplasias match our results. Diaz-Rodrigues and colleagues[32]associated the lower expression of MAD2 to chromosome instability and increased
aneuploidies in patients with Multiple myeloma. Burum-Auensen and colleagues[33]also demonstrated low expression of MAD2 in asso-ciation with chromosomal abnormalities and a poor prognosis in pa-tients with testicular germ cell tumors. Ultimately, Furlong and col-leagues[34]found that low MAD2 protein expression is significantly associated to a reduced progression-free survival of patients with high-grade serous epithelial ovarian cancer.
Our most intriguing discovery involves the Aurora Kinases A and B. Fig. 7.Analysis of association between the mRNA expression level of the genesAURKA, AURKBandCDKN1Aand the survival of patients with MDS.
Table 2
Pearson’s correlation between the mRNA expressions in MDS patients.
Pearson's correlation TPX2 AURKA AURKB MAD2 CDC20 CDKN1A
TPX2 Pearson Correlation (r) 1 0.503 0.586 0.241 0.797 −0.106
r-square (r2) – 0.253 0.343 0.058 0.635 0.011
p-value (2-tailed) – 0.000 0.000 0.000 0.000 0.339
N 88 75 77 77 86 84
AURKA Pearson Correlation (r) 0.503 1 0.652 0.421 0.566 −0.223
r-square (r2) 0.253 – 0.425 0.178 0.321 0.050
p-value (2-tailed) 0.000 – 0.000 0.000 0.000 0.045
N 75 85 70 73 80 81
AURKB Pearson Correlation (r) 0.586 0.652 1 0.326 0.645 −0.03
r-square (r2) 0.343 0.425 – 0.106 0.416 0.005
p-value (2-tailed) 0.000 0.000 – 0.004 0.000 0.790
N 77 70 85 76 84 80
MAD2 Pearson Correlation (r) 0.241 0.421 0.326 1 0.242 −0.102
r-square (r2) 0.058 0.178 0.106 – 0.058 0.010
p-value (2-tailed) 0.035 0.000 0.004 – 0.029 0.361
N 77 73 76 88 82 83
CDC20 Pearson Correlation (r) 0.979 0.566 0.645 0.242 1 −0.221
r-square (r2) 0.635 0.321 0.416 0.058 – 0.049
p-value (2-tailed) 0.000 0.000 0.000 0.029 – 0.037
N 86 80 84 82 95 89
CDKN1A Pearson Correlation (r) −0.106 −0.223 −0.03 −0.102 −0.221 1
r-square (r2) 0.011 0.050 0.005 0.010 0.049 –
p-value (2-tailed) 0.339 0.045 0.790 0.361 0.037 –
N 84 81 80 83 89 95
These kinases are key regulators of cell cycle progression. Aurora A plays important functions in mitotic spindle checkpoint, chromosome stability and separation, while Aurora B is also necessary for the spindle checkpoint as well as correct cytokinesis [6]. We found low mRNA expression of Aurora A and B in patients with chromosome abnormal-ities, including complex karyotype for AURKA. High frequency of chromosome abnormalities is related to a higher risk of AML evolution [35]. Other studies that analyzedAURKAandAURKBin MDS and AML patients did notfind significant correlation between gene expression patterns and cytogeneticfinds[7,36]. Also in this study, patients with lower mRNA expression ofAURKA andAURKBwere more prone to possess three bone marrow dysplasias (AURKA), hemoglobin inferior to 8 g/dL (AURKB) and lower overall survival (AURKAandAURKB). All these findings shows that lowAURKAandAURKBmRNA expression profiles represent an unfavorable prognosis in our group of patients.
Aurora A and B overexpression has been traditionally observed in many human cancers and leukemia[36,37], although their ability as single tumorigenesis inducers remains controversial[38,39]. This data is apparently opposed to ourfindings. However, it must be noticed that MDS is a complex neoplasm, distinct from leukemia. One outstanding difference between these hematological neoplasias is the significant apoptosis level of dysplastic myeloid lineages, mainly in low-risk MDS subtypes [40,41]. Interestingly, some authors have demonstrated Aurora A and B downregulation promoting apoptosis and mitotic cat-astrophe in several biological models[42,43]. Therefore, the apoptotic events associated to MDS and Auroras’downregulation could explain
our findings regarding AURKA andAURKB transcripts levels. As we evaluated bone marrow aspirates, our results exhibit the cellular di-versity present in patients' bone marrow, which may include apoptotic dysplastic lineages.
We fully characterized the low Aurora kinases transcript levels in MDS patients’bone marrow aspirates, but transcription is only one of the regulation mechanisms of these kinases. Auroras achieve complete catalytic activation after autophosphorylation of threonine residues located at T-loops: T288 for Aurora A and T232 for Aurora B[44,45]. Their degradation by proteasome is strictly regulated by the APC, Cdh1 and other regulators[46,47]. These multiple levels of regulation may explain differences in protein expression or activity observed in other studies. Furthermore, the nature of studied samples may be another source of variation. For example, Ye and colleagues[36]showed that Aurora A mRNA correlated with protein levels in CD34+
blast cells from MDS patients, while we did not find a similar correlation for Aurora B in bone marrow aspirates and tissue samples.
Another important result of this study was the association of de-creased AURKA, AURKB and MAD2 mRNA expressions with hypo-plastic MDS (hMDS). hMDS patients have been described as a distinct entity with a different prognosis[48,49]and represent about 10–20%
of MDS patients[1,50]. In the present study, 16.9% of MDS patients presented hypocellular bone marrow with high presence of chromo-somal abnormalities and death rate (60% and 50% of patients, re-spectively). Koh and colleagues[51]also demonstrated high percentage of chromosomal abnormalities in hMDS. In a single study, Heredia and colleagues[7]also detected a decrease of mRNA expression ofAURKA, AURKB,MAD2andCDC20 in hMDS, what emphasizes this entity as different from other forms of MDS.
Ultimately,p21functions are related to the cell cycle regulation and it may act as an apoptosis inhibitor[52]. Some studies show thatp21 presents a dual behavior depending on the cellular context, acting as an oncogene or as a tumor suppressor[53]. In this study, we found that the p21 mRNA expression is higher in MDS patients in comparison with health donors and the higher expression of this gene were associated to a low overall survival, what suggest thatp21is acting as an oncogene. Corroborating with our finds, Xiao and colleges [54]also found an increase inp21expression in CD34+ cells of lower-risk MDS patients in comparison with health donors, and an association betweenp21and process of senescence in CD34+ cells, which is related to the process of
MDS progression to AML[54,55]. High levels ofp21expression were also associated with a poor prognosis in AML patients, multiple mye-loma and Burkitt lymphoma[56,57].
5. Conclusion
In this investigation, we found significant clinical correlations re-garding Auroras and mitotic spindle genes transcript levels, reaffirming the importance of studying these genes in MDS patients, to provide a better comprehension of the syndrome pathogenesis and evolution. These discoveries also highlighted the necessity for the investigation of mutations, protein expression and activity related to these genes in myelodysplastic syndromes.
Acknowledgements
This work was supported by CAPES, CNPq (PRONEX) and FUNCAP.
Appendix A. Supplementary data
Supplementary data associated with this article can be found, in the online version, athttps://doi.org/10.1016/j.leukres.2017.11.013.
References
[1] L. Adès, R. Itzykson, P. Fenaux, Myelodysplastic syndromes, Lancet 383 (9936) (2014) 2239–2252.
[2] M. Pfeilstöcker, H. Tuechler, G. Sanz, J. Schanz, et al., Time-dependent changes in mortality and transformation risk in MDS, Blood 128 (2016) 902–910. [3] A. Pellagatti, J. Boultwood, The molecular pathogenesis of the myelodysplastic
syndromes, Eur. J. Haematol. 95 (1) (2015) 3–15.
[4] U. Bacher, J. Schanz, F. Braulke, D. Haase, Rare cytogenetic abnormalities in myelodysplastic syndromes, Mediterr. J. Hematol. Infect. Dis. 7 (1) (2015) e2015034.
[5] T. Otto, P. Sicinski, Cell cycle proteins as promising targets in cancer therapy, Nat. Rev. Cancer 17 (2) (2017) 93–115.
[6] B. Goldenson, J.D. Crispino, The aurora kinases in cell cycle and leukemia, Oncogene 34 (5) (2015) 537–545.
[7] F.F. Heredia, J.C. de Sousa, H.L. Ribeiro Junior, A.F. Carvalho, S.M. Magalhaes, R.F. Pinheiro, Proteins related to the spindle and checkpoint mitotic emphasize the different pathogenesis of hypoplastic MDS, Leuk. Res. 38 (2014) 218–224. [8] K.R. Genga, F.D. Filho, F.V. Ferreira, J.C. de Sousa, F.S. Studart, S.M. Magalhaes,
F.F. Heredia, R.F. Pinheiro, Proteins of the mitotic checkpoint and spindle are re-lated to chromosomal instability and unfavorable prognosis in patients with mye-lodysplastic syndrome, J. Clin. Pathol. 0 (2015) 1–7.
[9] G.S. Falchook, C.C. Bastida, R. Kurzrock, Aurora kinase inhibitors in oncology clinical trials: current state of the progress, Semin. Oncol. 42 (6) (2015) 832–848. [10] B. Liang, W. Zheng, L. Fang, L. Wu, F. Zhou, X. Yin, X. Yu, Z. Zou, Overexpressed targeting protein for Xklp2 (TPX2) serves as a promising prognostic marker and therapeutic target for gastric câncer, Cancer Biol. Ther. 17 (8) (2016) 824–832. [11] G. Neumayer, C. Belzil, O.J. Gruss, M.D. Nguyen, TPX2: of spindle assemply, DNA
damage response, and câncer, Cell. Mol. Life Sci. 71 (16) (2014) 3027–3047. [12] O.J. Gruss, M. Wittmann, H. Yokoyama, R. Pepperkok, T. Kufer, H. Silljé,
E. Karsenti, I.W. Mattaj, I. Vernos, Chromosome-induced microtubule assembly mediated by TPX2 is required for spindle formation in HeLa cells, Nat. Cell Biol. 4 (11) (2002) 871–879.
[13] C. Conde, M. Osswald, C.E. Sunkel, All together now: polo joins the kinase network controlling the spindle assembly checkpoint inDrosophila, Fly 7 (4) (2013) 224–228.
[14] N. London, S. Biggins, Signalling dynamics in the spindle checkpoint response, Nat. Rev. Mol. Cell Biol. 15 (11) (2014) 736–747.
[15] S. Heinrich, E.M. Geissen, J. Kamenz, S. Tratmann, et al., Determinants of robust-ness in spindle assembly checkpoint signaling, Nat. Cell Biol. 15 (11) (2013) 1328–1339.
[16] A. Cazzalini, A.I. Scovassi, M. Savio, L.A. Stivala, E. Prosperi, Multiple roles of the cell cycle inhibitor p21CDKN1A in the DNA damage response, Mutat. Res. 704 (2010) 12–20.
[17] A. Karimian, Y. Ahmadi, B. Yousefi, Multiple functions of p21 in cell cycle, apop-tosis and transcriptional regulation after DNA damage, DNA Repair. 42 (2016) 63–71.
[18] R.D. Brunning, A. Orazi, U. Germing, Myelodysplastic syndromes/neoplasms, overview, in: S.H. Swerdlow, E. Campo, N.L. Harris, E.S. Jaffe, S.A. Pileri, H. Stein, J. Thiele, J.W. Vardiman (Eds.), WHO Classification of Tumours of Hematopoietic and Lymphoid Tissues, IARC Press, Lyon, 2008, pp. p. 88–93.
[19] K.J. Livak, T.D. Schmittgen, Analysis of relative gene expression data using real time quantitative PCR and the 2(-Delta DeltaC(T)) method, Methods 25 (2001) 402–408.
prognostic scoring system for myelodysplastic syndromes, Blood 120 (12) (2012) 2454–2465.
[21] J. Budczies, F. Klauschen, B.V. Sinn, B. Gyorffy, W.D. Schmitt, S. Darb-Esfahani, C. Denkert, et al., CutoffFinder: a comprehensive and straightforward Web appli-cation enabling rapid biomarker cutoffoptimization, PLoS One 7 (12) (2012) 51862.
[22] P.L. Greenberg, R.M. Stone, A. Al-Kali, S.K. Barta, et al., NCCN practice guidelines for myelodysplastic syndromes, version 2.2017, J. Natl. Compr. Canc. Netw. 15 (1) (2017) 60–87.
[23] C. Acquaviva, F. Herzog, C. Kraft, J. Pines, The anaphase promoting complex/cy-closome is recruited to centromeres by the spindle assembly checkpoint, Nat. Cell Biol. 6 (9) (2004) 892–898.
[24] L. Malureanu, K.B. Jeganathan, F. Jin, D.J. Baker, J.H. van Ree, O. Gullon, Z. Chen, J.R. Henley, J.M. van Deursen, Cdc20 hypomorphic mice fail to counteract de novo synthesis of cyclin B1 in mitosis, J. Cell Biol. 191 (2) (2010) 313–329. [25] R. Shi, Q. Sun, J. Sun, X. Wang, W. Xia, G. Dong, A. Wang, F. Jiang, L. Xu, Cell
division cycle 20 overexpression predicts poor prognosis for patients with lung adenocarcinoma, Tumor Biol. 39 (3) (2017) 1–10.
[26] S. Stewart, G. Fang, Anaphase-promoting complex/cyclosome controls the stability of TPX2 during mitotic exit, Mol. Cell. Biol. 25 (23) (2005) 10516–10527. [27] J. Lee, J.A. Kim, K.L. Margolis, R. Fotedar, Substrate degradation by the
anaphase-promoting complex occurs during mitotic slippage, ABBV Cell Cycle 9 (9) (2010) 1792–1801.
[28] C. Aguirre-Portolés, A.W. Bird, A. Hyman, M. Cañamero, I. Pérez de Castro, M. Malumbres, Tpx2 controls spindle integrity, genome stability, and tumor de-velopment, Cancer Res. 72 (6) (2012) 1518–1528.
[29] P. Wei, N. Zhang, Y. Xu, X. Li, D. Shi, Y. Wang, D. Li, S. Cai, TPX2 is a novel prognostic marker for the growth and metastasis of colon cancer, J. Transl. Med. 11 (2013) 313.
[30] Y. Iwanaga, Y.H. Chi, A. Miyazato, S. Sheleg, K. Haller, J.M. Peloponese Jr, Y. Li, J.M. Ward, R. Benezra, K.T. Jeang, Heterozygous deletion of mitotic arrest-deficient protein 1 (MAD1) increases the incidence of tumors in mice, Cancer Res. 67 (1) (2007) 160–166.
[31] R. Sotillo, E. Hernando, E. Díaz-Rodríguez, J. Teruya-Feldstein, C. Cordón-Cardo, S.W. Lowe, R. Benezra, Mad2 overexpression promotes aneuploidy and tumor-igenesis in mice, Cancer Cell 11 (1) (2007) 9–23.
[32] E. Diaz-Rodriguez, S. Alvarez-Fernandes, X. Chen, B. Paiva, R. Lopez-Perez, et al., Deficient spindle assembly checkpoint in multiple myeloma, PLoS One 6 (11) (2011) e27583.
[33] E. Burum-Auensen, R.I. Skotheim, A.R. Schiolberg, J. Roislien, R.A. Lothe, O.P. Clausen, Spindle proteins are differentially expressed in the various histolo-gical subtypes of testicular germ cell tumors, J. Carcinog. 9 (2010) 1. [34] F. Furlong, P. Fitzpatrick, S. O'Toole, S. Phelan, B. McGrogan, A. Maguire,
A. O'Grady, M. Gallagher, M. Prencipe, A. McGoldrick, P. McGettigan, D. Brennan, O. Sheils, C. Martin, E. W. Kay, J. O'Leary, A. McCann, Low MAD2 expression levels associate with reduced rogression-free survival in patients with high-grade serous epithelial ovarian cancer, J. Pathol. 226 (5) (2012) 746–755.
[35] H.J. Olney, M.M. Le Beau, The Cytogenetics and molecular biology of the Myelodysplastic syndromes, in: D.P. STEENSMA (Ed.), Myelodysplastic Syndromes: Pathobiology and Clinical Management. 2nd ed., Informa Healthcare, New York, 2002, pp. 49–86.
[36] D. Ye, G. Garcia-Manero, H.M. Kantarjian, L. Xiao, et al., Analysis of Aurora kinase A expression in CD34+ blast cells isolated from patients with myelodysplastic syndromes and acute myeloid leucemia, J Hematopathol. 2 (2009) 2–8. [37] Z.Z. Lin, Y.M. Jeng, F.C. Hu, H.W. Pan, H.W. Tsao, P.L. Lai, P.H. Lee, A.L. Cheng,
H.C. Hsu, Significance of Aurora B overexpression in hepatocellular carcinoma. Aurora B overexpression in HCC, BMC Cancer 10 (2010) 461.
[38] H. Zhou, J. Kuang, L. Zhong, W.L. Kuo, J.W. Gray, A. Sahin, B.R. Brinkley, S. Sen, Tumour amplified kinase STK15/BTAK induces centrosome amplification,
aneuploidy and transformation, Nat. Genet. 20 (1998) 189–193.
[39] T. Ota, S. Suto, H. Katayama, Z.B. Han, F. Suzuki, M. Maeda, M. Tanino, Y. Terada, M. Tatsuka, Increased mitotic phosphorylation of histone H3 attributable to AIM-1/ Aurora-B overexpression contributes to chromosome number instability, Cancer Res. 62 (18) (2002) 5168–5177.
[40] J.E. Parker, G.J. Mufti, F. Rasool, A. Mijovic, S. Devereux, A. Pagliuca, The role of apoptosis, proliferation, and the Bcl-2-related proteins in the myelodysplastic syn-dromes and acute myeloid leukemia secondary to MDS, Blood 96 (12) (2000) 3932–3938.
[41] K. Shimazaki, K. Ohshima, J. Suzumiya, C. Kawasaki, M. Kikuchi, Evaluation of apoptosis as a prognostic factor in myelodysplastic syndromes, Br. J. Haematol. 110 (3) (2000) 584–590.
[42] D.O. Cowley, J.A. Rivera-Pérez, M. Schliekelman, Y.J. He, T.G. Oliver, L. Lu, R. O'Quinn, E.D. Salmon, T. Magnuson, T. Van Dyke, Aurora-A kinase is essential for bipolar spindle formation and early development, Mol. Cell. Biol. 29 (4) (2009) 1059–1071.
[43] M. Kimura, T. Yoshioka, M. Saio, Y. Banno, H. Nagaoka, Y. Okano, Mitotic cata-strophe and cell death induced by depletion of centrosomal proteins, Cell. Death. Dis. 4 (2013) e603.
[44] A.O. Walter, W. Seghezzi, W. Korver, J. Sheung, E. Lees, The mitotic serine/ threonine kinase Aurora2/AIK is regulated by phosphorylation and degradation, Oncogene 19 (2004) 4906–4916.
[45] S. Ferrari, O. Marin, M.A. Pagano, F. Meggio, D. Hess, M. El-Shemerly, A. Krystyniak, L.A. Pinna, Aurora-A site specificity: a study with synthetic peptide substrates, Biochem. J. 390 (2005) 293–302.
[46] H.G. Nguyen, D. Chinnappan, T. Urano, K. Ravid, Mechanism of Aurora-B de-gradation and its dependency on intact KEN and A-boxes: identification of an an-euploidy-promoting property, Mol. Cell. Biol. 25 (2005) 4977–4992.
[47] L.E. Littlepage, J.V. Ruderman, Identification of a new APC/C recognition domain, the A box, which is required for the Cdh1-dependent destruction of the kinase Aurora-A during mitotic exit, Genes Dev. 16 (2002) 2274–2285.
[48] N.S. Young, R.T. Calado, P. Scheinberg, Current concepts in the pathophysiology and treatment of aplastic anemia, Blood 108 (2006) 2509–2519.
[49] H.L. Ribeiro Jr., A.R.S. Maia, R.T.G. Oliveira, M.B. Costa, et al., DNA repair gene expressions are related to bone marrow cellularity in myelodysplastic syndrome, J. Clin. Pathol. 0 (2017) 1–11.
[50] C.Y. Yao, H.A. Hou, T.Y. Lin, C.C. Lin, et al., Distinct mutation profle and prognostic relevance in patients with hypoplastic myelodysplastic syndromes (h-MDS), Oncotarget 7 (39) (2016) 63177–63188.
[51] Y. Koh, H.R. Lee, E.Y. Song, I. Kim, et al., Hypoplastic myelodysplastic syndrome (h-MDS) is a distinctive clinical entity with poorer prognosis and frequent karyotypic and FISH abnormalities compared to aplastic anemia (AA), Leuk. Res. 34 (2010) 1344–1350.
[52] A.L. Gartel, A.L. Tyner, The role of the cyclin-dependent kinase inhibitor p21 in apoptosis, Mol. Cancer Ther. 1 (2002) 639.
[53] F. Wisnieski, et al., CDKN1A histone acetylation and gene expression relationship in gastric adenocarcinomas, Clin. Exp. Med. 17 (1) (2015) 121–129.
[54] Y. Xiao, J. Wang, H. Song, P. Zou, D. Zhou, L. Liu, CD34+ cells from patients with myelodysplastic syndrome present different p21 dependent premature senescence, Leuk. Res. 37 (2013) 333–340.
[55] Y.Y. Wang, J.N. Cen, J. He, H.J. Shen, et al., Accelerated cellular senescence in myelodysplastic syndrome, Exp. Hematol. 37 (2009) 1310–1317.
[56] W. Zhang, S.M. Kornblau, T. Kobayashi, et al., High levels of constitutive WAF1/ Cip1 protein are associated with chemoresistance in acute myelogenous leukemia, Clin. Cancer Res. 1 (1995) 1051–1057.