Contents lists available atScienceDirect
Scientia Horticulturae
journal homepage:www.elsevier.com/locate/scihorti
E
ff
ect of olive trees density on the quality and composition of olive oil from
cv. Arbequina
Nuno Rodrigues
a,b, Susana Casal
c, António M. Peres
a,d, Paula Baptista
a, Albino Bento
a,
Hugo Martín
e, M. Cármen Asensio-S.-Manzanera
e, José Alberto Pereira
a,⁎aCentro de Investigação de Montanha (CIMO), ESA, Instituto Politécnico de Bragança, Campus de Santa Apolónia, 5300-253 Bragança, Portugal bUniversidad de Léon, Departamento de Ingeniería Agrária, Av. Portugal, nº 41, 24071 Léon, Spain
cREQUIMTE, Laboratory of Bromatology and Hydrology, Faculty of Pharmacy, University of Porto, Rua de Jorge Viterbo Ferreira, 228, 4050-313 Porto, Portugal dLaboratory of Separation and Reaction Engineering-Laboratory of Catalysis and Materials (LSRE-LCM), ESA, Instituto Politécnico de Bragança, Campus Santa Apolónia,
5300-253 Bragança, Portugal
eInstituto Tecnológico Agrario de Castilla y León, Ctra. de Burgos Km. 119, 47071 Valladolid, Spain
A R T I C L E I N F O Keywords:
Planting density Arbequina olive oils Quality
Chemical composition Oxidative stability
A B S T R A C T
The number of plants per hectare is a key factor for olive tree productivity. Nevertheless, information about the effect of tree density on olive oil quality and composition is scarce. Thus, the effect of planting densities of cv. Arbequina trees on olive oil quality and composition was studied along thefirst four years of production. Two types of planting tree arrangements were evaluated, namely olive trees planted at different distances within a row (2.0 m; 1.5 m; 1.25 m; and 1.0 m,fixing the space between rows equal to 4.0 m) or at different distances between rows (4.0 m; 3.5 m; and 3.0 m,fixing the space within the same row at 1.5 m), which led to planting densities from 1250 to 2500 trees ha−1. The results indicated that the quality parameters, composition, anti-oxidant activity and oxidative stability were significantly affected by the densities of plants and the crop year (P-value < 0.0001, for one-way ANOVA). An increase of plants in the row and between rows showed a tendency for a slight increase of free acidity, and a reduction of the peroxide value and of the extinction specific coeffi -cients. Fatty acid composition was also affected, with a tendency for the decrease of C16:0, C18:0, SFA and PUFA, and an increase of C18:1, C18:2 and MUFA. The antioxidant activity and the oxidative stability also showed a reduction trend. For all parameters evaluated, the crop year had a marked influence. The year of production had significant statistical effects on the evaluated parameters, which could be related to agro-climatic factors.
1. Introduction
World consumption of olive oil has been increasing, especially in the last decades, leading to the search of new geographical areas for olive trees plantations as well as of new production practices aiming to increase the olive oil productivity per plant or per area (Rufat et al., 2014). Traditional extensive olive groves, with few plants per hectare, are not irrigated, require high labor and maintenance, and have low yields, which results in high production costs per kilogram of olives, reducing market competitiveness of the produced olive oil (Duarte et al., 2008;Proietti et al., 2012). In contrast, high-density plantations, with high number of plants per hectare, are irrigated and intensively managed, reaching higher productivity and, although having high production costs, present lower olive oil production prices (Connor et al., 2014).
Thus, the number of high-density olive groves, with 1500–2200 trees per hectare (Rius and Lacarte, 2010), has increased significantly in non-traditional producing regions, especially in some regions of Spain (Tous et al., 2007), Italy (Godini et al., 2006), Morocco, Tunisia and in the United States of America (Berenguer et al., 2006). Nevertheless, in some regions, due to plants density and positional distribution the ef-fective solar exposition could be a limiting factor for fruit yield. As the radiation penetrates the olive tree canopy, it is absorbed and reflected, mainly by leaves, altering light quality (Mariscal et al., 2000;Connor et al., 2014). Also, light spectral distribution is dependent on leaves density and location in the tree, influencing productivity (Bastías and Corelli-Grappadelli, 2012). Therefore, the conduction system of trees in high-density hedges and rows orientation should guaranty a good ad-justment of light to achieve better productions and maximize crop management. Despite all these factors are known to influence olive
https://doi.org/10.1016/j.scienta.2018.04.059
Received 7 March 2018; Received in revised form 24 April 2018; Accepted 25 April 2018
⁎Corresponding author.
E-mail address:[email protected](J.A. Pereira).
Scientia Horticulturae 238 (2018) 222–233
Available online 01 May 2018
0304-4238/ © 2018 Elsevier B.V. All rights reserved.
grove productivity, their effect on olive oil quality and composition is still not completely understood.
The selection of olive cultivar is also a key factor in high-density olive groves. Most traditional cultivars (e.g. Cornicabra, Galega, Hojiblanca and Picual) are not well adapted to this type of high-density orchards due to their low growth rate, late fructification age and high vigor. Spanish cv. Arbequina was thefirst cultivar successfully adapted to high-density groves (Proietti et al., 2012; Abenoza et al., 2014). Other cultivars also showed easy adaptation, namely Arbosana and Chiquitita from Spain; Koroneiki from Greece; which, together with Arbequina, are the most widely used worldwide (Torres et al., 2009; Allalout et al., 2011; Rondanini et al., 2011; Tous et al., 2011; Bakhouche et al., 2013;Yousfiet al., 2012;Abenoza et al., 2014).
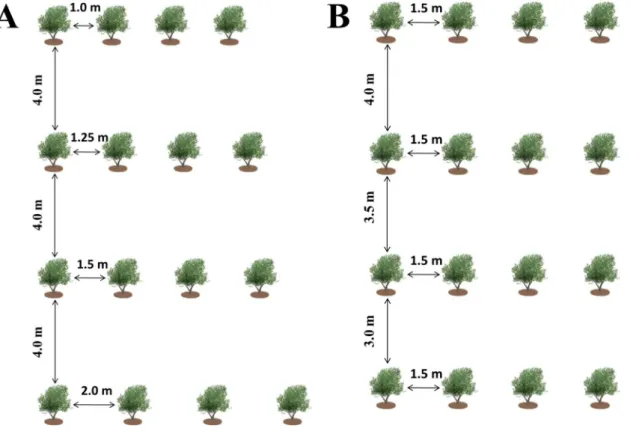
Some works have reported the study of the effect of tree density on olive tree productivity (Vossen, 2007), the physiological responses of olive trees to environmental stress (Abdallah et al., 2017), as well as the effect of irrigation deficit on photosynthesis, growth and productivity in high-density olive orchards (i.e., more than 1500 trees/ha) ( Hernandez-Santana et al., 2017). However, the way how plant density affects olive oil quality is poorly documented. In this context, the possible effect of tree density on olive oil composition was studied, using a cv. Arbequina high-density olive grove, installed in a non-traditional olive production region in Valladolid Province (Spain). The study was conducted during four consecutive growing seasons, with four plant densities that had the same distance between rows (4.0 m) but different spaces between tree in each row (from 1.0 m to 2.0 m), and three plant densities that differ in the distance between rowsfixing the space of tree within the rows (Fig. 1). All olive oils were assessed taking into account the quality parameters (free acidity, peroxide value, coefficient of specific extinc-tion, and sensory analyses), chemical composition (fatty acid compo-sition, tocopherol profile and total phenols content), oxidative stability and antioxidant activity (DPPH, and ABTS+).
2. Material and methods
2.1. Sampling
An experimental olive grove with olive trees from Arbequina cul-tivar was installed in Medina de Rioseco (41°52′48.3″N 5°00′17.9″W, 850 m of altitude), Valladolid Province (Spain), in May 2008. The trees were planted in rows, with different spaces within the rows (fixing the distance between rows to 4.0 m), namely 4.0 m × 2.0 m (planting density: 1250 trees ha−1, d1250), 4.0 m × 1.5 m (1667 trees ha−1, d1667), 4.0 m × 1.25 m (2000 trees ha−1
, d2000), and 4.0 m × 1.0 m (2500 trees ha−1, d2500), and with different spaces between rows (fixing the distance between plants in the row to 1.5 m), with 4.0 m × 1.5 m (1667 trees ha−1
, d1667), 3.5 m × 1.5 m (1905 trees ha−1
, d1905) and 3.0 m × 1.5 m (2222 trees ha−1 , d2222) (Fig. 1). The experimental design was a completely randomized block design with three replicates. At the 2012 crop season, and during four consecutive years, for each density and at the same time (end of Oc-tober or beginning of November), three independent samples of 3 kg each, were handpicked and immediately transported to the laboratory of the Instituto Tecnológico Agrario de Castilla y León (ITACyL), Val-ladolid (Spain). The fruits were extracted in a pilot extraction plant with an Abencor system (Comercial Abengoa S.A., Sevilla, Spain) with three main units: a mill, a thermobeater where malaxation takes place at controlled temperature, and a centrifuge. The yields varied from 12 to 13% (kg of olive oil/100 kg of fruits). The obtained olive oils were filtered and stored in 100 mL dark bottles and were analyzed within 3 months after extraction. All assays were carried out in triplicate.
2.2. Quality parameters determination
All samples were analyzed following the European Union standard methods (Annexes II and IX in Commission Regulation EEC/2568/91 from 11th July and amendments), being assessed the following para-meters: free acidity (FA, in % of oleic acid), peroxide values (PV, in mEq O2/kg), as well as the specific coefficients of extinction at 232 nm
Fig. 1.Experimental design.
N. Rodrigues et al. Scientia Horticulturae 238 (2018) 222–233
and 270 nm (K232and K270) and the respectiveΔK values. The sensory analysis of the different olive oil samples followed the same EU Regulation and was performed by 8 trained panelists that worked or studied at the School of Agriculture of the Polytechnic Institute of Bragança (Portugal), including individuals of both sexes, 5 female and 3 male, and different ages (from 22 to 56 years). Olive oils were clas-sified as Extra Virgin Olive Oil (EVOO) if the median of the defects was equal to 0 and the fruity positive attribute was greater than 0; as Virgin Olive Oil (VOO) if the median of the defects was lower than 3.5 and the fruity positive attribute was higher than 0; and as Lampante Olive Oil (LOO) in the other cases.
2.3. Fatty acids composition
Fatty acids were evaluated as their methyl esters after cold alkaline transesterification with methanolic potassium hydroxide solution (Commission Regulation EEC/2568/91 from 11th July) and extraction with n-heptane. The fatty acid profile was determined with a Chrompack CP 9001 chromatograph equipped with a split-splitless in-jector, a FID detector, a Chrompack CP-9050 autosampler and a 50 m × 0.25 mm i.d. fused silica capillary column coated with a 0.19μ film of CP-Sil 88 (Varian). Helium was used as carrier gas at an internal pressure of 110 kPa. The temperatures of the detector and injector were 250 °C and 230 °C, respectively. The split ratio was 1:50 and the in-jected volume was of 1μL. The results are expressed in relative per-centage of each fatty acid, calculated by internal normalization of the chromatographic peak area eluting between myristic and lignoceric methyl esters. A control sample (olive oil 47118, Supelco) and a fatty acids methyl esters standard mixture (Supelco 37 FAME Mix) were used for identification and calibration of the FID detector (Sigma, Spain).
2.4. Tocopherols composition
Tocopherols composition was determined according to theISO 9936 (2006), with some modifications as described by Rodrigues et al. (2012). Tocopherols standards (α-, β- and γ-) were purchase from Sigma (Spain), while the internal standard 2-methyl-2-(4,8,12-tri-methyltridecyl)chroman-6-ol (tocol) was from Matreya Inc. (Pleasant Gap, PA, USA). Filtered olive oil (50 mg) was mixed with the internal standard solution of 10 microliters of tocol from a 100μg/ml solution prepared in hexane and dissolved in n-hexane. The mixture was cen-trifuged for 5 min at 13,000 rpm and the supernatant obtained analyzed by HPLC. The liquid chromatograph consisted of a Jasco integrated system (Japan) equipped with a Jasco LC-NetII/ADC data unit, a PU-1580 Intelligent Pump and a FP-920 fluorescence detector (λexc= 290 nm andλem= 330 nm). The chromatographic separation was achieved on a SupelcosilTM LC-SI column (3μm) 75 × 3.0 mm (Supelco, Bellefonte, PA), operating at 23 °C. A mixture of n-hexane and 1,4-dioxane (97.5:2.5) was used as eluent, at aflow rate of 0.7 mL/min. Data were analyzed with the ChromNAV Control Center – JASCO Chromatography Data Station (Japan). The compounds were identified by chromatographic comparisons with authentic standards, by co-elu-tion and by their UV spectra. Quantification was based on the internal standard method, using thefluorescence signal response and individual calibration curves for each tocopherol. Total vitamin E corresponded to the sum of the individual tocopherol masses.
2.5. Total phenols content
Total phenols content was assessed by the methodology described byCapannesi et al. (2000)with some modifications, as follows: 2.5 g of olive oil were diluted with 2.5 mL of n-hexane (1:1 w/v) and extracted three times with 2.5 mL of methanol/water (80:20; v/v), followed by 5 min of centrifugation at 5000 rpm. From the combined extract, 1 mL was removed, being added the same amount of Folin-Ciocalteau reagent and of Na2CO3solution (7.5%), after which 7 mL of purified water were
added. After homogenization, the samples mixtures were stored over-night (12–16 h) in the dark, and the spectrophotometric analysis was performed atλ = 765 nm. A calibration curve of caffeic acid in me-thanol was made in concentration range of 0.04–0.18 mg/mL. Thefinal results were expressed as mg of caffeic acid equivalents per kg of olive oil (mg CAE/kg).
2.6. Oxidative stability (Rancimat)
The oxidative stability (OS) was measured in a Rancimat 743 ap-paratus (Metrohm CH, Switzerland) following the methodology pre-vious described byRodrigues et al. (2016). Filtered, cleaned, dried air (20 L/h) was bubbled through the oil (3.00 g) heated at 120 ± 1.6 °C, with the volatile compounds being collected in water, and the in-creasing water conductivity continuously measured. The time taken to reach the conductivity inflection was recorded in hours, being assumed as the OS value.
2.7. Radical scavenging activity (RSA)
2.7.1. DPPH
Olive oil samples were analyzed for their capacity to scavenge the stable DPPH (2,2-diphenyl-1-picrylhydrazyl) radical according to the procedure ofKalantzakis et al. (2006) with some modifications. To 1 mL of oil solution in ethyl acetate (10%, w/v) it was added 4 mL of a freshly prepared DPPH radical solution (1 × 10⁻⁴M in ethyl acetate) in a screw-capped 15 mL test tube. The mixture was shaken vigorously for 10 s and the tube was kept in the dark for 30 min. Absorbance was measured at 515 nm (Thermo Fisher Scientific, GENESYS™10 UV–vis, USA) against a blank solution. A control sample was prepared and measured daily. The results obtained are expressed as inhibition per-centage.
2.7.2. ABTS+
This method was performed as described bySánchez et al. (2007), based on the capacity of a sample to inhibit the ABTS+(2,2′ -azinobis(3-ethylbenzthiazoline-6-sulfonic acid)) radical compared with a standard antioxidant reference (trolox). The ABTS+radical was generated by chemical reaction with potassium persulfate (K2S2O8). To 25 mL of ABTS+(7 mM) were added 440μL of K2S2O8(140 mM), being the so-lution kept in darkness during 12–16 h at room temperature in order to form the ABTS+radical, and diluted in ethanol until an absorbance of 0.70 ± 0.02 atλ= 734 nm. A 2 mL portion of the standardized ABTS %+radical solution was mixed with 100μL of oil and the absorbance measured atλ= 734 nm. The results obtained were expressed as in-hibition percentage.
2.8. Statistical analysis
One-way analysis of variance (one-way ANOVA) was applied to evaluate the existence of statistical significant effects of the olive tree planting density or crop year in the composition (fatty acids, toco-pherols and total phenols), quality (free acidity, peroxide values, ex-tinction coefficients and oxidative stability) and radical scavenging activities (ABTS+and DPPH) of olive oils extracted from cv Arbequina olives produced in high density olive groves. When a statistical sig-nificant effect was detected, the pos-hoc multi-comparison Tukey’s test was further used to identify the differences among olive trees planting density or crop year.
Linear multivariate classification models were used to infer about the possibility of using the composition, quality and/or radical scavenging activity data to discriminate olive tree planting densities, for each type of planting configuration evaluated (i.e., distance between olive tree planting rows fixed equal to 4.0 m and distance between plants in the same row varying from 1.0 to 2.0 m; or, distance between olive tree in the same rowfixed equal to 1.5 m and distance between
N. Rodrigues et al. Scientia Horticulturae 238 (2018) 222–233
rows ranging from 3.0 to 4.0 m, as shown inFig. 1). Thus linear dis-criminant analysis (LDA) was applied coupled with the simulated an-nealing (SA) meta-heuristic variable selection algorithm, which allowed identifying the minimum number of non-redundant parameters that would maximize the correct overall classification percentages (i.e., maximum model predictive sensitivities), minimizing possible noise effects (Bertsimas and Tsitsiklis, 1992;Cadima et al., 2004;Kirkpatrick et al., 1983). The predictive performances of the LDA-SA models were evaluated considering the leave-one-out cross-validation (LOO-CV) and the repeated K-fold cross-validation (repeated K-fold-CV) techniques. In the repeated K-fold-CV, data was randomly split into K folds, being each of the folds left out in turn for internal-validation (predictive capability evaluation based on the sensitivity values, i.e., percentage of correct classifications) and the other K-1 folds used to train the model (i.e., to establish the best model). At the end, the K estimates are averaged to get the overall resampled estimate (Kirkpatrick et al., 1983). In this work the K-folds were set equal to 4, enabling the random formation of internal validation subsets with 25% of the initial data, allowing bias reduction. The procedure was repeated 10 times for putting the model under stress. The variables were scales and centered before modeling to normalize the weight of each variable in thefinal linear classification model. The classification performance of each LDA-SA model was graphically evaluated using 2-D or 3-D plots of the significant dis-criminant functions. The statistical analysis was performed using the Subselect (Cadima et al., 2004;Cadima et al., 2012;Kuhn and Johnson, 2013) and MASS (Venables and Ripley, 2002) packages of the open source statistical program R (version 2.15.1), at a 5% significance level.
3. Results and discussion
3.1. Quality parameters
In order to evaluate the effect of different tree density on the olive oil quality, along four crop seasons (2012–2015), free acidity (FA) peroxide value (PV), extinction coefficients at 232 and 270 nm (K232 and K270) andΔK were evaluated (for detailed results seeTable 1).
The results (Table 1) pointed out that the FA of olive oils was sig-nificantly influenced (P≤0.0001) by the planting tree density (in-dependently of the spacing alignment of the trees) and by the crop year, despite the absence of a clear trend for the different crop years (2012–2015). The FA was significantly higher (P≤0.05) for olive oils extracted from olives produced with lower space between plants in the row, although this tendency was not consistent with the decreased space between rows. Nevertheless, the mean FA values showed an overall low variation (from 0.2 to 0.3%), allowing to be classified as EVOO, regarding the acidity, since the maximum values did not exceed the legal threshold of 0.8%. The obtained results are in line with those reported for high quality olive oils from cv. Arbequina (Borges et al., 2017a; Reboredo-Rodríguez et al., 2015). The low values determined were expected, since the olive oils were obtained from fruits harvested by hand, transported to the laboratory and extracted the same day, minimizing the risk of fatty acids hydrolysis, which is the main re-sponsible of olive oils acidity.
The PV was significantly (P≤0.05) affected by tree density (Table 1). For 3 crop years, different spaces between plants in the row influenced the PV, being the values significantly lower (P≤0.05) for the lowest spacing in the row (i.e., 1.0 m), which corresponded to the highest tree density (2500 trees ha−1).
A similar trend was observed (2013 and 2015) for olive oils ex-tracted from olives produced in tighter rows. Globally, lower PV were observed for olive oils produced from olive trees planted at different spaces within the row (from 1.2 ± 0.4 to 6.6 ± 0.8 mEq O2/kg of olive oil) compared to the PV of olive oils obtained from olive trees planted at different spaces between rows (from 0.8 ± 0.0 to 7.1 ± 0.4 mEq O2/kg of oil). It should remarked that all PV were lower than 20 mEq O2/kg olive oil, the maximum limit established by
Commission Regulation (EEC 2568/91) for olive oil classification as EVOO. The crop year also influenced this parameter (P≤0.05), which could be probably due to different climatic conditions.
A similar trend was observed for specific extinction coefficients, with plant density influencing significantly this parameter (P≤0.01), with the exception of three cases for K232and one case for K270, despite the different variable patterns. In the different space between plants in the row, K232 values decreases significantly (P≤0.05) with plant density in 2014, while for K270 the values of the highest density (4.0 × 1.0, 2500 trees ha−1) were significantly (P˂
≤0.05) lower than the values observed for the lowest one (4.0 × 2.0, 1250 trees ha−1
) in three years (2013–2015). For K232, values ranged from 0.68 at density 2500 in 2015 to 1.95 at density 1250 in 2014, and K270ranged from 0.08 to density 2500 in 2013 to 0.22 at density 1250, in 2014. The different spaces between rows also influences significantly (P≤0.05) the specific extinction coefficients (Table 1), with the exception of one case for each study. In an half of the cases, the values obtained in the highest density were lower than the values observed in the lower ones. K232values ranged from 0.55 at density 2222 in 2015 to 1.78 at the same density in 2012 and K270ranged from 0.07 for density 2222 in 2015 to 0.22 at 1250 density in 2014. Higher values were observed in 2012 and 2014, with an average of 1.42 and 1.44 for K232and 0.16 and 0.17 for K270respectively, and the lower in 2013 and 2015 (Table 1), in agreement with the results observed for the PV. All values obtained in the extinction coefficient are within the legal limits established by Commission Regulation EEC/2568/91 from 11th July for the EVOO category. The obtained olive oils were subjected to sensory analysis and all were classified as EVOO without any sensory defects and with the fruity median higher than one.
3.2. Fatty acids composition
Olive oils are mainly constituted by triglycerides with different ra-tios of unsaturated and saturated fatty acids.Table 2shows the results of the main fatty acids and the sum of saturated (SFA), mono-unsaturated (MUFA) and polymono-unsaturated fatty acids (PUFA). As ex-pected, oleic acid (C18:1) was the major fatty acid found, varied from 77.66% to 82.93% (Table 2). With only two exceptions (years 2015 in the rows and 2013 between rows), in general, there was observed a significant effect (P≤0.05) of the tree density on oleic acid amounts. In fact, in four situations (2012 and 2014 in the rows; and 2012 and 2015 between rows) olive oils extracted from olives produced in the highest densities were significantly richer (P≤0.05) in oleic acid than the ones extracted from the lowest densities. The opposite situation was ob-served for the distance between rows in 2014 (Table 2). The crop year of production also affects significantly the proportion of oleic acid. In this work, and for cv. Arbequina olive oils, the obtained values for oleic acid are slightly higher compared to the reported by other authors, which varied from 58 to 79% (Borges et al., 2017b; Farinelli and Tombesi, 2015;Reboredo-Rodríguez et al., 2015;Yousfiet al., 2012). This fact could be related with the environmental conditions of the region of production, namely the lower average temperature occurred during fruit growth (Ceci et al., 2017;Tena et al., 2017). Lower tem-peratures are known to have a positive effect on oleic acid amounts, while an increase of 1 °C degree could cause decreases of up to 2% of oleic acid amount (Rondanini et al., 2011). In general, Valladolid province is colder than the other common producing regions mentioned in the bibliography, therefore regarded as a non-traditional region. Palmitic acid (C16:0) was the second in abundance, values between 7.69 and 11.05%. For this fatty acid, with the exception of the crop year 2014 in the distance of plants between rows, the distance of plants in the row and between rows as well as the crop year influenced sig-nificantly (P≤0.05) its amount. The main observed tendency was that high densities in the row (4.0 × 1.0, in 2012) and between rows (3.0 × 1.5, in 2012, 2013 and 2015) showed significant (P≤0.05) less palmitic acid than lower densities (Table 2). Linoleic acid (C18:2) was
N. Rodrigues et al. Scientia Horticulturae 238 (2018) 222–233
Table 1
Free acidity (% oleic acid), peroxide value (mEq O2/kg), specific extinction coefficients (K232and K270) of olive oils obtained from olives produced at different planting densities, crop years 2012–2015 (mean ± standard deviation).
Quality parameters Year Different space between plants in the row (trees ha−1) Di
fferent space of plants between rows (trees ha−1)
4.0 × 2.0 (1250) 4.0 × 1.5 (1667) 4.0 × 1.25 (2000) 4.0 × 1.0 (2500) P-value* 4.0 × 1.5 (1667) 3.5 × 1.5 (1905) 3.0 × 1.5 (2222) P-value*
Free acidity 2012 0.19 ± 0.00a,A 0.19 ± 0.00a,A 0.28 ± 0.00b,A 0.28 ± 0.00b.A < 0.0001 0.19 ± 0.00b,A 0.28 ± 0.00a,A 0.28 ± 0.00a,A < 0.0001 2013 0.19 ± 0.00a,B 0.19 ± 0.00a,b,A 0.19 ± 0.00b,B,D 0.14 ± 0.00c,B < 0.0001 0.19 ± 0.00A 0.19 ± 0.00B 0.19 ± 0.00B 0.2497 2014 0.19 ± 0.00c,A 0.19 ± 0.00b,A 0.19 ± 0.00a,C,D 0.19 ± 0.00b,C < 0.0001 0.19 ± 0.00b,A 0.09 ± 0.00c,C 0.19 ± 0.00a,B < 0.0001 2015 0.19 ± 0.00b,A 0.19 ± 0.00b,B 0.19 ± 0.00b,D 0.28 ± 0.00a,A < 0.0001 0.19 ± 0.00c,B 0.28 ± 0.00a,A 0.19 ± 0.00b,B < 0.0001
P-value* 0.0004 0.0002 < 0.0001 < 0.0001 0.0002 < 0.0001 < 0.0001
Peroxide value 2012 3.74 ± 0.42a,A 3.33 ± 0.00a,A 3.74 ± 0.42a,A,B 2.49 ± 0.00b,A 0.0025 3.33 ± 0.00b,A 7.07 ± 0.42a,A 3.33 ± 0.00b,A < 0.0001 2013 2.91 ± 0.41a,A,B 2.70 ± 0.22a,b,A 2.91 ± 0.41a,A 2.08 ± 0.00b,A 0.0335 2.70 ± 0.22b,A 3.32 ± 0.00a,B 2.49 ± 0.01b,B 0.0004 2014 2.90 ± 0.40b,A,B 3.73 ± 0.42a,b,A 4.14 ± 0.01a,B 3.73 ± 0.41a,b,B 0.0159 3.73 ± 0.42b,A 4.57 ± 0.42b,C 6.22 ± 0.43a,C 0.0010 2015 1.66 ± 0.82b,B 6.65 ± 0.85a,B 1.25 ± 0.41b,C 1.25 ± 0.42b,C < 0.0001 6.65 ± 0.85a,B 1.25 ± 0.41b,D 0.83 ± 0.00b,D < 0.0001
P-value* 0.0106 < 0.0001 < 0.0001 < 0.0001 < 0.0001 < 0.0001 < 0.0001
K232 2012 1.33 ± 0.03a,A 1.06 ± 0.07b,A 1.23 ± 0.06a,A 1.31 ± 0.01a,A 0.0006 1.06 ± 0.07b,A 1.77 ± 0.02a,A 1.78 ± 0.06a,A < 0.0001 2013 0.79 ± 0.01B 0.76 ± 0.01B 0.84 ± 0.09B 0.78 ± 0.04B 0.3229 0.76 ± 0.01B 0.75 ± 0.01B 0.71 ± 0.05B 0.1121 2014 1.95 ± 0.09a,C 1.49 ± 0.04b,C 1.09 ± 0.02c,A 1.50 ± 0.01b,C < 0.0001 1.49 ± 0.04a,C 1.36 ± 0.07b,C 1.27 ± 0.00b,C 0.0032 2015 0.73 ± 0.02B 0.70 ± 0.04B 0.61 ± 0.04C 0.68 ± 0.09B 0.1213 0.70 ± 0.04a,B 0.64 ± 0.06a,b,B 0.55 ± 0.03b,D 0.0162
P-value* < 0.0001 < 0.0001 < 0.0001 < 0.0001 < 0.0001 < 0.0001 < 0.0001
K270 2012 0.13 ± 0.01a,b,A 0.12 ± 0.01b,A 0.15 ± 0.00a,A 0.15 ± 0.00a,A 0.0059 0.12 ± 0.01b,A 0.20 ± 0.01a,A 0.18 ± 0.01a,A 0.0003 2013 0.09 ± 0.00b,B 0.10 ± 0.00a,B 0.09 ± 0.00b,B 0.08 ± 0.00c,B 0.0001 0.10 ± 0.00a,B 0.08 ± 0.00b,B 0.07 ± 0.07b,B < 0.0001 2014 0.22 ± 0.00a,C 0.18 ± 0.01b,C 0.10 ± 0.03c,B 0.16 ± 0.00b,A < 0.0001 0.18 ± 0.01C 0.18 ± 0.02A 0.16 ± 0.01C 0.0888 2015 0.18 ± 0.02a,D 0.15 ± 0.01a,b,A 0.15 ± 0.01a,b,A 0.09 ± 0.04b,B 0.0095 0.15 ± 0.01a,A 0.10 ± 0.00b,C 0.12 ± 0.00b,D 0.0013
P-value* < 0.0001 < 0.0001 0.0016 0.0030 < 0.0001 < 0.0001 < 0.0001
In each column and for each olive tree planting density, different caps letters mean significant statistical differences of the quality parameter under evaluation, at a 5% significance level (P-value < 0.05), according to multiple comparison Tukey’s HSD test.
In each line and for each crop year, different lower case letters mean significant statistical differences of the quality parameter under evaluation, at a 5% significance level (P-value < 0.05), according to multiple comparison Tukey’s HSD test.
* P-value < 0.05 meaning that the mean value of the evaluated quality parameter of at least one olive tree planting density (for the lines) or of at least one crop year (for the columns) differs from the others, according to the one-way ANOVA results (in this case multiple-comparison tests were performed).
N.
Rodrigues
et
al.
Sci
en
tia H
ort
icu
ltu
rae
2
38
(2
01
8) 2
22
–2
33
Table 2
Fatty acids profile (%) of olive oils extracted from olives produced at different planting densities, crop years 2012–2015 (mean ± standard deviation).
Fatty acids composition (relative %) Year Different space between plants in the row (trees ha−1) Different space of plants between rows (trees ha−1)
4.0 × 2.0 (1250) 4.0 × 1.5 (1667) 4.0 × 1.25 (2000) 4.0 × 1.0 (2500) P-value* 4.0 × 1.5 (1667) 3.5 × 1.5 (1905) 3.0 × 1.5 (2222) P-value*
C16:0 2012 9.53 ± 0.92a,b,A 10.55 ± 0.04ª,A 10.42 ± 0.56ª,A 8.83 ± 0.02b,A 0.0137 10.55 ± 0.04ª,A 7.08 ± 0.01b,A 7.69 ± 1.05b,A 0.0009 2013 9.49 ± 0.05a,A 9.31 ± 0.05b,c,B 9.29 ± 0.03c,B 9.41 ± 0.03a,b,B 0.0010 9.31 ± 0.05a,B 9.24 ± 0.02a,B 9.08 ± 0.07b,A,B 0.0034 2014 9.67 ± 0.00b,A 9.45 ± 0.17b,B 9.96 ± 0.08ª,B 9.41 ± 0.07b,B 0.0006 9.45 ± 0.17B 10.11 ± 0.60C 10.31 ± 0.26B 0.0778 2015 11.05 ± 0.08a,B 10.82 ± 0.02b,C 10.91 ± 0.11a,b,A 10.90 ± 0.06a,b,C 0.0287 10.82 ± 0.02a,C 10.25 ± 0.02c,C 10.45 ± 0.03b,B < 0.0001
P-value* 0.0090 < 0.0001 0.0008 < 0.0001 < 0.0001 < 0.0001 0.0008
C18:0 2012 1.99 ± 0.09a,A 2.10 ± 0.01a,A 2.07 ± 0.11a,A 1.64 ± 0.00b,A 0.0002 2.10 ± 0.01a,A 1.81 ± 0.00b,A 1.85 ± 0.07b,A 0.0003 2013 1.84 ± 0.01b,A 1.95 ± 0.02a,B 1.91 ± 0.02a,b,B 1.88 ± 0.04b,B 0.0055 1.95 ± 0.02a,B 1.88 ± 0.02b,B 1.86 ± 0.01ba,A 0.0018 2014 2.24 ± 0.11B 2.23 ± 0.02C 2.17 ± 0.01A 2.33 ± 0.05C 0.0658 2.23 ± 0.02ª,C 2.07 ± 0.03b,C 2.03 ± 0.08b,B 0.0054 2015 1.90 ± 0.01a,A 1.88 ± 0.00b,D 1.86 ± 0.01b.c,B 1.85 ± 0.01c,B 0.0005 1.88 ± 0.00c,D 1.96 ± 0.01a,D 1.94 ± 0.01b,A,B < 0.0001
P-value* 0.0006 < 0.0001 0.0005 < 0.0001 < 0.0001 < 0.0001 0.0108
C18:1 2012 80.32 ± 1.46b,A,B 78.73 ± 0.28b,A 79.60 ± 1.08b,A,B 82.82 ± 0.05a,A 0.0033 78.73 ± 0.28b,A 82.93 ± 0.02a,A 82.38 ± 0.94a,A 0.0002 2013 80.65 ± 0.03a,A 80.22 ± 0.13b,B 80.53 ± 0.05a,A 80.64 ± 0.19a,B 0.0072 80.22 ± 0.13B 79.90 ± 0.39B 80.16 ± 0.08B 0.3028 2014 78.47 ± 0.10b,B 78.70 ± 0.10a,A 78.33 ± 0.04b,B 78.71 ± 0.02a,C 0.0005 78.70 ± 0.10a,A 78.04 ± 0.63a,b,C 77.66 ± 0.08b,C 0.0386 2015 78.51 ± 0.20B 78.73 ± 0.02A 78.50 ± 0.24B 78.54 ± 0.05C 0.3207 78.73 ± 0.02c,A 79.46 ± 0.09a,B 79.05 ± 0.02b,B < 0.0001
P-value* 0.0110 < 0.0001 0.0039 < 0.0001 < 0.0001 < 0.0001 < 0.0001
C18:2 2012 5.43 ± 0.47a,A,C 5.90 ± 0.21a,A 5.30 ± 0.27a,A 4.51 ± 0.01b,A 0.0026 5.90 ± 0.21a,A 5.37 ± 0.01b,A 5.30 ± 0.13b,A 0.0044 2013 5.23 ± 0.01b,A 5.50 ± 0.07a,B 5.30 ± 0.05b,A 5.28 ± 0.05b,B 0.0012 5.50 ± 0.07c,B 5.73 ± 0.06b,B 5.92 ± 0.05a,B 0.0004 2014 6.94 ± 0.28ªB 6.67 ± 0.03a,b,C 6.45 ± 0.04b,B 6.42 ± 0.06b,C 0.0092 6.57 ± 0.03b,C 6.80 ± 0.04ª,C 6.91 ± 0.09a,C 0.0014 2015 6.05 ± 0.02a,C 5.94 ± 0.01b,A 6.00 ± 0.05a,b,C 6.02 ± 0.02a,b,D 0.0144 5.94 ± 0.01b,A 5.84 ± 0.02c,D 5.98 ± 0.01a,B < 0.0001
P-value* 0.0003 < 0.0001 < 0.0001 < 0.0001 < 0.0001 < 0.0001 < 0.0001
C18:3 2012 0.55 ± 0.00a 0.56 ± 0.01a,A 0.51 ± 0.02b,A 0.43 ± 0.00c,A < 0.0001 0.56 ± 0.01A 0.58 ± 0.00A 0.57 ± 0.02A 0.2154 2013 0.64 ± 0.01 0.65 ± 0.00B 0.66 ± 0.01B 0.65 ± 0.00B 0.1064 0.65 ± 0.00b,B 0.77 ± 0.05a,A 0.76 ± 0.01a,B 0.0055 2014 0.33 ± 0.32 0.67 ± 0.01B 0.66 ± 0.00B 0.69 ± 0.02C 0.0725 0.67 ± 0.01a,B 0.61 ± 0.00c,A 0.64 ± 0.01b,C 0.0002 2015 0.51 ± 0.00 0.51 ± 0.01C 0.51 ± 0.00A 0.51 ± 0.00D 0.5893 0.51 ± 0.01C 0.38 ± 0.13B 0.51 ± 0.00D 0.1432
P-value* 0.1936 < 0.0001 < 0.0001 < 0.0001 < 0.0001 0.0013 < 0.0001
SFA 2012 12.27 ± 1.04ª,b,A,B 13.43 ± 0.06a,A 13.22 ± 0.71a,A 11.07 ± 0.03b,A 0.0065 13.43 ± 0.06a,A 9.58 ± 0.01b,A 10.24 ± 1.15b,A 0.0008 2013 12.05 ± 0.03A 12.14 ± 0.08B 12.03 ± 0.04B 12.01 ± 0.08B 0.1120 12.14 ± 0.08a,B 12.05 ± 0.12a,B 11.74 ± 0.01b,A,C 0.0025 2014 12.90 ± 0.13a,b,A,B 12.68 ± 0.11b,C 13.12 ± 0.03a,A 12.76 ± 0.05b,C 0.0015 12.68 ± 0.11C 13.15 ± 0.61C 13.27 ± 0.17B 0.2022 2015 13.64 ± 0.06a,B 13.39 ± 0.02b,A 13.48 ± 0.12a,b,A 13.45 ± 0.07ª,b,D 0.0214 13.39 ± 0.02a,A 12.97 ± 0.02c,C 13.11 ± 0.02b,B,C < 0.0001
P-value* 0.0235 < 0.0001 0.0052 < 0.0001 < 0.0001 < 0.0001 0.0007
MUFA 2012 81.71 ± 1.53a,b,A 80.07 ± 0.28b,A 80.93 ± 0.98b,A,C 83.95 ± 0.03a,A 0.0046 80.07 ± 0.28b,A 84.45 ± 0.01a,A 83.87 ± 0.99a,A 0.0002 2013 81.93 ± 0.01a,A 81.55 ± 0.19b,B 81.81 ± 0.04a,b,A 81.89 ± 0.16a,B 0.0246 81.55 ± 0.19B 81.17 ± 0.33B 81.40 ± 0.07B 0.2000 2014 79.68 ± 0.14b,c,B 79.92 ± 0.11a,b,A 79.59 ± 0.04c,B 79.94 ± 0.04a,C 0.0031 79.92 ± 0.11a,A 79.26 ± 0.63ª,b,C 78.98 ± 0.02b,C 0.0493 2015 79.66 ± 0.07a,B 80.01 ± 0.01b,A 79.78 ± 0.23a,b,B,C 79.85 ± 0.05a,b,C 0.0473 80.01 ± 0.01c,d,A 80.66 ± 0.11a,C 80.25 ± 0.03b,B,C < 0.0001
P-value* 0.0090 < 0.0001 0.0020 < 0.0001 < 0.0001 < 0.0001 < 0.0001
PUFA 2012 6.00 ± 0.49a,A,C 6.48 ± 0.22a,A 5.83 ± 0.27a,A 4.97 ± 0.00b,A 0.0019 6.48 ± 0.22a,A 5.95 ± 0.01b,A 5.87 ± 0.15b,A 0.0060 2013 5.89 ± 0.01b,A 6.18 ± 0.08a,A 6.00 ± 0.04b,A 5.95 ± 0.05b,B 0.0008 6.18 ± 0.08b,A 6.57 ± 0.13a,B 6.70 ± 0.06a,B 0.0012 2014 7.27 ± 0.04a,B 7.24 ± 0.02a,B 7.11 ± 0.04b,B 7.11 ± 0.07b,C 0.0050 7.24 ± 0.02b,B 7.40 ± 0.04ª,b,C 7.56 ± 0.10a,C 0.0034 2015 6.56 ± 0.02a,C 6.45 ± 0.02b,A 6.51 ± 0.06a,b,B 6.53 ± 0.02a,b,D 0.0229 6.45 ± 0.02a,A 6.22 ± 0.15b,A 6.49 ± 0.02a,B 0.0193
P-value* 0.0005 < 0.0001 < 0.0001 < 0.0001 < 0.0001 < 0.0001 < 0.0001
In each column and for each olive tree planting density, different caps letters mean significant statistical differences of the quality parameter under evaluation, at a 5% significance level (P-value < 0.05), according to multiple comparison Tukey’s HSD test.
In each line and for each crop year, different lower case letters mean significant statistical differences of the quality parameter under evaluation, at a 5% significance level (P-value < 0.05), according to multiple comparison Tukey’s HSD test.
* P-value < 0.05 meaning that the mean value of the evaluated quality parameter of at least one olive tree planting density (for the lines) or of at least one crop year (for the columns) differs from the others, according to the one-way ANOVA results (in this case multiple-comparison tests were performed).
N.
Rodrigues
et
al.
Sci
en
tia H
ort
icu
ltu
rae
2
38
(2
01
8) 2
22
–2
33
the third most abundant fatty acid, varying from 4.51 to 6.94% of the total fatty acids (Table 2). This fatty acid also showed to be significantly influenced by tree density in all years (P≤0.05) and by the crop year (P≤0.001), with a significant increase (P˂≤0.05) with the increase of plants in the row (in 2012 and 2014) and also with the decrease of distance between rows (in 2013, 2014 and 2015). The remaining fatty acids appear in lower values and no evident effect was observed con-cerning the effect of plant density. The sum of SFA, MUFA and PUFA are a direct transposition of these main three fatty acids, also showing variations according the different densities and years (Table 2). The increase of number of plants in the row (in 2012 and 2014) and be-tween rows (2012, 2013 and 2015) showed a significant (P≤0.05) negative effect in the amounts of SFA. On the other side for MUFA, in three the observed situation (2014 for the distance in the rows, and 2012 and 2015 for the distance between rows) its amounts significantly (P≤0.05) increase with the tree density. Whereas for PUFA, in three cases its amount significantly (P≤0.05) decrease (2012 and 2015, distance in the rows, and 2012, distance between rows); and in two cases (2013 and 2014 in the distance between row) its amount sig-nificantly increases (P≤0.05). The obtained results from the cv. Ar-bequina concerning composition and inter-annual variations of olive oils are in line with the obtained in other regions and other authors (Borges et al., 2017a,Farinelli and Tombesi, 2015;Reboredo-Rodríguez et al., 2015;Yousfiet al., 2012) taking to account the consideration mentioned above about the influence of environmental conditions.
3.3. Tocopherols composition
In the present work, three isoforms of tocopherols were identified and quantified in the olive oils, namely α-, β-, and γ-tocopherol (Table 3).α-tocopherol was the major one, representing more than 90% of the total identified as expected in olive oils. The mean values range from 206.5 to 270.9 mg kg−1of oil within the spacing between plants in the row, and from 191.5 to 292.7 mg kg−1
of oil with spacing of plants between rows. Both distance between plants and the crop year infl u-enced statistically the amount of tocopherols (Table 3). For α-toco-pherol, and analyzing the results of different space between plants in the row, we observed a significant decrease (P≤0.05) on its amounts when the number of plants in the rows increases in two consecutive years. However, in 2015, an opposite tendency was observed. If the distance of plants between rows is analyzed, a significantly positive influence was observed in one year (2012) while in another year it was significantly negative (2015).
The crop year seems to be an important factor concerning α-toco-pherol amounts, in general, for all tree densities, the amounts observed in 2013 and 2015 are higher than to the registered in 2012 and 2014. Again, this is consistent with the PV and K232 nm values previously discussed, with lower tocopherol amounts for the samples with the higher oxidation degrees. γ-tocopherol was the second most re-presentative tocopherol with mean values of 4.0 to 29.0 mg kg−1
of olive oil obtained with different row spacing and 3.4 to 28.0 mg kg−1of olive oil in different spacing between rows. Both, distance between plants in the row and between rows, influenced significantly (P≤0.05) the amount ofγ–tocopherol, with a significant decrease in three of the analyzed situations (2012, in the row, and 2014 and 2015 between rows) and one increase (2015, in the row) according to the increase of tree density. The values obtained forβ-tocopherol varied from 0.9 to 13.5 mg kg−1in the row spacing and from 1.2 to 8.7 mg kg−1of olive oil between rows spacing (Table 3). In three situations its amounts were significantly lower (P≤0.05) in the highest densities. Also, for both, γ-tocopherol andβ-tocopherol, the year of production seems to have a significant (P≤0.0001) effect on its amounts. Contrarily to the ob-served forα-tocopherol, the amounts ofγ-tocopherol andβ-tocopherol were in general statistically higher in 2012, but this was only observed in thefirst crop year. The sum of the total tocopherols follows the same tendency (Table 3), being affected by tree densities, nevertheless
without a marked effect. Our results are in agreement with the obtained by other authors to the same olive cultivar (Borges et al., 2017b) and also for the inter-annual variation once the contents of α, β, γ-toco-pherols can be affected by climatic conditions, mainly temperature and rain (Aguilera et al., 2005;Beltrán et al., 2010;Dabbou et al., 2009).
3.4. Antioxidant activity and oxidative stability
The values of antioxidant activity for the two evaluated methods, ABTS+and DPPH, are detailed inTable 4. For the ABTS+method, the percentage of inhibition varied from 84.4% to 99.1%. In 2012, a sig-nificant (P= 0.0033) effect of the space between plants in the row was observed, with a decrease of inhibition with the increase of the tree density, indicative of lower antioxidant capacity. Concerning the spaces between rows, also in two years, 2013 and 2015, there was a significant effect of the density, with again with lower values at higher densities (Table 4). In the DPPH method, the results obtained showed a wider variation, between 27.5% and 95.0% of the inhibition. With the ex-ception of 2014, spacing between plants, either in the row or between rows, had a significant effect (P≤0.0001) on the obtained values, in both studied cases; in 2012 the values of DPPH inhibition significantly increased while in 2013 and 2015 it showed an opposite tendency. For both methodologies, the higher values of inhibition were verified in the year of 2012 and the lower in 2014. The evaluation of the total phenol content showed amounts varying from 96 mg CAE/kg and 226 mg CAE/ kg (Table 4). In the spacing between the rows, the values ranged from 91 mg CAE/kg and 214 mg CAE/kg. In 2012 and 2013, density infl u-enced significantly (P≤0.05) the amount of total phenols content, with a decrease for the higher density in the row, in both years, and between rows in 2013. In 2012, an opposite tendency between rows was ob-served. Lower values were generally observed in 2015 and the highest in 2013, without any tendency observed on these years regarding the effect of tree density.
The oxidative stability (OS) in the present work, varied from 10.46 h and 22.47 h in row spacing and from 9.55 h and 25.21 h with spacing between the rows. There was a significant effect from both, the spacing density in the row (P≤0.004) and between rows (P≤0.0004), and also from the year (P≤0.0001) (Table 4). Analyzing the obtained re-sults from the distance of plants in the row, in two years (2012 and 2014) a significant increase was observed (P≤0.05) from the less to the highest density, while in 2013 and 2014, a significant (P≤0.05) decrease was observed for the same densities. Considering the distance between rows, a negative effect in the OS is more pronounced, with the exception of 2012, with a significantly (P≤0.05) decrease from the higher to the lower distance between rows (2013, 2014 and 2015). In general, the values of OS follow similar tendency to the observed by the antioxidant activity, with a significant effect (P≤0.0001) of the pro-duction year (Table 4). According to the average values, 2014 was the year with lower values of OS, with an average of 11.5 h, while 2012 with the highest, with an average of 20.5 h. The OS of the olive oils is a very important parameter that could help producers to estimate the shelf life of each olive oil. Its value is influenced by different factors, as olive oil composition particularly the fatty acid profile, and also the amount of antioxidant molecules, including tocopherols and poly-phenols, as well as storage conditions (Dabbou et al., 2010). In our work, depending on the years, olive oils present some differences in the fatty acid profile (Table 2) amount of tocopherols (Table 3) and total phenols (Table 4) which could influences the oxidative stability and antioxidant activity once the storage conditions of the olive oils are similar in all the four years and all analyzed within three months after extraction. For the same cultivarBorges et al. (2017a)obtained similar values of OS for olive oils from different Spanish and Brazilian regions.
N. Rodrigues et al. Scientia Horticulturae 238 (2018) 222–233
Table 3
Tocopherols contents (mg kg−1
olive oil) of olive oils extracted from olives produced at different planting densities, crop years 2012–2015 (mean ± standard deviation).
Tocopherols Year Different space between plants in the row (trees ha−1) Di
fferent space of plants between rows (trees ha−1)
4.0 × 2.0 (1250) 4.0 × 1.5 (1667) 4.0 × 1.25 (2000) 4.0 × 1.0 (2500) P-value* 4.0 × 1.5 (1667) 3.5 × 1.5 (1905) 3.0 × 1.5 (2222) P-value*
α-tocoferol 2012 247.92 ± 12.14a,A 214.65 ± 3.42b,A 223.21 ± 4.26b,A 219.78 ± 2.49b,A 0.0014 214.65 ± 3.42c,A 226.67 ± 2.12b,A 247.70 ± 5.87a,A 0.0002 2013 270.20 ± 5.94a,B 268.37 ± 2.53a,B 241.41 ± 7.93b,B 237.32 ± 3.31b,B < 0.0001 268.37 ± 2.53a,b,B 266.53 ± 14.42b,B 292.69 ± 9.45a,B 0.0334 2014 221.09 ± 3.38a,C 206.52 ± 1.13b,A 217.56 ± 3.53a,A 224.61 ± 4.86aA,B 0.0012 206.52 ± 1.13a,A 191.51 ± 9.08b,C 209.83 ± 1.10a,C 0.0120 2015 242.38 ± 0.71b,A 250.10 ± 5.38a,b,C 253.56 ± 6.09a,b,B 265.40 ± 8.95a,C 0.0104 250.10 ± 5.38a,C 240.49 ± 1.55a,b,A 236.02 ± 4.98b,A 0.0188
P-value* 0.0002 < 0.0001 0.0002 < 0.0001 < 0.0001 < 0.0001 < 0.0001
β-tocoferol 2012 13.54 ± 0.20a,A 8.16 ± 0.17b,A 8.11 ± 0.37b,A 8.14 ± 0.08b,A < 0.0001 8.16 ± 0.17b,A 8.74 ± 0.05a,A 8.30 ± 0.26a,b,A 0.0172 2013 1.10 ± 0.03B 1.33 ± 0.43B 0.93 ± 0.03B 1.18 ± 0.28B 0.3378 1.33 ± 0.43B 1.34 ± 0.51B 1.34 ± 0.23B 0.9996 2014 1.41 ± 0.08C 1.29 ± 0.07B 1.28 ± 0.12B 1.40 ± 0.07B 0.2050 1.29 ± 0.07B 1.18 ± 0.10B 1.37 ± 0.05B 0.0604 2015 2.68 ± 0.02a,D 2.51 ± 0.00b,C 2.52 ± 0.03b,C 2.54 ± 0.06b,C 0.0015 2.51 ± 0.00a,C 2.32 ± 0.00b,C 2.35 ± 0.02b,C < 0.0001
P-value* < 0.0001 < 0.0001 < 0.0001 < 0.0001 < 0.0001 < 0.0001 < 0.0001
γ-tocoferol 2012 28.96 ± 0.52a,A 24.97 ± 1.55b,A 20.65 ± 0.30c,A 22.11 ± 0.08c,A < 0.0001 27.97 ± 1.55a,b,A 23.25 ± 0.53b,A 25.88 ± 0.04a,A 0.0322 2013 5.25 ± 0.25B 5.66 ± 0.20B 5.36 ± 0.14B 5.93 ± 0.70B 0.2205 5.66 ± 0.20B 5.74 ± 0.33B 5.79 ± 0.27B 0.8436 2014 4.43 ± 0.23C 4.19 ± 0.02B 4.23 ± 0.25C 4.58 ± 0.19C 0.1170 4.19 ± 0.02a,B 3.43 ± 0.06c,C 3.59 ± 0.08b,C < 0.0001 2015 4.21 ± 0.03b,C 3.98 ± 0.04c,B 4.09 ± 0.09b,c,C 4.44 ± 0.03a,C < 0.0001 3.98 ± 0.04a,B 3.69 ± 0.00b,C 3.59 ± 0.05c,C < 0.0001
P-value* < 0.0001 < 0.0001 < 0.0001 < 0.0001 < 0.0001 < 0.0001 < 0.0001
Vitamin E 2012 290.42 ± 12.86a,A 247.78 ± 2.03b,A 251.96 ± 4.19b,A 250.03 ± 2.49b,A 0.0002 247.78 ± 2.03c,A 258.56 ± 2.70b,A,C 281.87 ± 5.57a,A < 0.0001 2013 276.65 ± 6.19a,A 275.36 ± 2.35a,B 247.70 ± 8.01b,A 244.42 ± 2.87b,A,B < 0.0001 275.36 ± 2.35a,b,B 273.61 ± 13.90b,A 299.82 ± 9.50a,B 0.0297 2014 226.93 ± 3.69a,B 212.00 ± 1.22b,C 223.06 ± 3.90a,B 230.59 ± 5.11a,B 0.0016 212.00 ± 1.22a,C 196.12 ± 9.11b,B 214.79 ± 1.23a,C 0.0107 2015 249.27 ± 0.77b,C 256.59 ± 5.42a,b,D 260.51 ± 6.21a,b,A 272.38 ± 8.93a,C 0.0102 256.59 ± 5.42a,D 246.51 ± 1.55a,b,C 241.96 ± 5.06b,D 0.0164
P-value* < 0.0001 < 0.0001 0.0003 0.0001 < 0.0001 < 0.0001 < 0.0001
In each column and for each olive tree planting density, different caps letters mean significant statistical differences of the quality parameter under evaluation, at a 5% significance level (P-value < 0.05), according to multiple comparison Tukey’s HSD test.
In each line and for each crop year, different lower case letters mean significant statistical differences of the quality parameter under evaluation, at a 5% significance level (P-value < 0.05), according to multiple comparison Tukey’s HSD test.
* P-value < 0.05 meaning that the mean value of the evaluated quality parameter of at least one olive tree planting density (for the lines) or of at least one crop year (for the columns) differs from the others, according to the one-way ANOVA results (in this case multiple-comparison tests were performed).
N.
Rodrigues
et
al.
Sci
en
tia H
ort
icu
ltu
rae
2
38
(2
01
8) 2
22
–2
33
Table 4
Radical scavenging activity by ABTS+ and DPPH (% inhibition), total phenol content (mg caffeic acid equivalent/kg olive oil) and oxidative stability (OS, hours) of olive oils extracted from olive produced at different planting densities, crop years 2012–2015 (mean ± standard deviation).
Antioxidant activity and oxidative stability Year Different space between plants in the row (trees ha−1) Di
fferent space of plants between rows (trees ha−1)
4.0 × 2.0 (1250) 4.0 × 1.5 (1667) 4.0 × 1.25 (2000) 4.0 × 1.0 (2500) P-value* 4.0 × 1.5 (1667) 3.5 × 1.5 (1905) 3.0 × 1.5 (2222) P-value*
ABTS+ 2012 95.03 ± 0.00a,A 95.03 ± 0.00a,A,B 94.96 ± 0.07a,b,A 94.89 ± 0.00b,A 0.0033 95.03 ± 0.00A,B 95.03 ± 0.00A 94.96 ± 0.07A 0.1250 2013 93.53 ± 0.28B 93.60 ± 0.21A 93.32 ± 0.49B 93.32 ± 0.21B 0.6246 93.60 ± 0.21a,A 94.02 ± 0.21a,B 92.27 ± 0.14b,A 0.0014 2014 99.08 ± 0.07C 98.83 ± 0.18B 99.11 ± 0.32C 99.01 ± 0.36C 0.5656 98.83 ± 0.18B 95.77 ± 0.25C 97.02 ± 2.27A 0.0775 2015 92.44 ± 0.94B 91.35 ± 3.03A 94.52 ± 0.14A 93.52 ± 0.86B 0.1817 91.35 ± 3.03a,A 92.65 ± 0.14a,D 84.44 ± 2.88b,B 0.0122
P-value* < 0.0001 0.0020 < 0.0001 < 0.0001 0.0020 < 0.0001 0.0002
DPPH 2012 74.12 ± 0.53c,A 77.96 ± 0.21b,A 93.18 ± 0.21a,A 93.56 ± 0.05a.A < 0.0001 77.96 ± 0.21c,A 94.36 ± 0.00b,A 94.99 ± 0.21a,A < 0.0001 2013 39.82 ± 0.25a,B 39.82 ± 0.13a,B 30.59 ± 0.06b,B 31.78 ± 0.88b,B < 0.0001 39.82 ± 0.13a,B 27.51 ± 0.38c,B 29.27 ± 0.75b,B < 0.0001 2014 37.06 ± 4.34B 28.16 ± 8.25C 29.61 ± 0.89B 32.00 ± 0.28B 0.1805 28.16 ± 8.25C 31.84 ± 2.79C 27.59 ± 2.91B 0.5947 2015 73.91 ± 2.25a,A 58.41 ± 1.38d,D 63.54 ± 1.79c,C 68.43 ± 1.04b,C < 0.0001 58.41 ± 1.38a,D 48.85 ± 1.50b,D 46.08 ± 1.96b,C 0.0002
P-value* < 0.0001 < 0.0001 < 0.0001 < 0.0001 < 0.0001 < 0.0001 < 0.0001
Total phenols contents 2012 152.86 ± 1.51a,b,A 154.68 ± 2.12a.A 153.47 ± 0.91a,b,A 148.03 ± 3.32b,A 0.0241 154.68 ± 2.12c,A 200.92 ± 1.81a,A 179.16 ± 1.81b,A < 0.0001 2013 171.30 ± 12.09b,A 213.61 ± 13.30a,B 226.30 ± 5.44a,B 120.22 ± 0.30c,B < 0.0001 213.61 ± 13.30a,B 205.45 ± 15.41a,A 128.69 ± 0.30b,B 0.0002 2014 163.54 ± 9.24A 160.58 ± 0.09A 166.25 ± 2.51C 168.69 ± 8.00C 0.4640 160.58 ± 0.09A 155.24 ± 4.69B 162.58 ± 2.01C 0.0532 2015 105.47 ± 6.63B 103.04 ± 1.81C 99.04 ± 6.33D 96.50 ± 1.82D 0.1743 103.04 ± 1.81C 90.90 ± 6.19C 93.65 ± 6.63D 0.0704
P-value* < 0.0001 < 0.0001 < 0.0001 < 0.0001 < 0.0001 < 0.0001 < 0.0001
OS 2012 15.51 ± 0.02d,A 16.90 ± 0.11c,A 20.77 ± 0.08b,A 21.45 ± 0.16a,A < 0.0001 16.90 ± 0.11c,A 23.43 ± 0.40b,A 25.21 ± 0.56a,A < 0.0001 2013 16.14 ± 0.27a,B 16.17 ± 0.03a,A 12.51 ± 0.01b,B 12.43 ± 0.07b,B < 0.0001 16.17 ± 0.03a,A 10.10 ± 0.09b,B 9.55 ± 0.23c,B < 0.0001 2014 10.46 ± 0.29b,C 11.39 ± 0.51a,b,B 12.07 ± 0.07a,C 11.62 ± 0.41a,C 0.0035 11.39 ± 0.51b,B 12.93 ± 0.11a,C 10.55 ± 0.25c,C 0.0003 2015 22.47 ± 0.03a,D 19.26 ± 0.28d,C 20.83 ± 0.09d,A 21.85 ± 0.28b,A < 0.0001 19.26 ± 0.28a,C 18.16 ± 0.16b,D 17.51 ± 0.07c,D < 0.0001
P-value* < 0.0001 < 0.0001 < 0.0001 < 0.0001 < 0.0001 < 0.0001 < 0.0001
* P-value < 0.05 meaning that the mean value of the evaluated quality parameter of at least one olive tree planting density (for the lines) or of at least one crop year (for the columns) differs from the others, according to the one-way ANOVA results (in this case multiple-comparison tests were performed). In each column and for each olive tree planting density, different caps letters mean significant statistical differences of the quality parameter under evaluation, at a 5% significance level (P-value < 0.05), according to multiple comparison Tukey’s HSD test. In each line and for each crop year, different lower case letters mean significant statistical differences of the quality parameter under evaluation, at a 5% significance level (P-value < 0.05), according to multiple comparison Tukey’s HSD test.
N.
Rodrigues
et
al.
Sci
en
tia H
ort
icu
ltu
rae
2
38
(2
01
8) 2
22
–2
33
3.5. Discrimination of planting tree densities using based on the olive oils composition, quality and radical scavenging activity data
As pointed out in the previous sections, the univariate analysis showed that the planting tree density as well as the crop year had, in general, statistical significant effects on the composition, quality, ra-dical scavenging activity and oxidative stability of the studied olive oils, although no specific and straightforward trends could be established. Thus, a multivariate approach was applied to identify which parameters could allow discriminating the olive oils according to the type of planting tree densities (i.e., olive trees planted at different distances within each row, which distanced from each other 4 m; or, olive trees planted at 1.5 m distance from each other in the same row but at dif-ferent distances between rows), regardless the crop year.
For thefirst type of planting space configuration, corresponding to a fixed 4 m distance between rows (Fig. 1), four planting tree densities were considered, namely, d1250 (1250 trees ha−1), d1667 (1667 trees ha−1
), d2000 (2000 trees ha−1
) and d2500
(2500 trees ha−1). A LDA-SA model, with three significant discriminant functions (explaining 72.6%, 15.6% and 11.8% of the data variability, respectively) was established based on the experimental data of 19 attributes, including the quality parameters (FA, PV, K232, K270andΔK), tocopherols (β- and γ-tocopherol), fatty acids (C16:1, C17:0, C17:1, C18:1, C18:2, C18:3, C20:0, C20:1, C22:0 and MUFA), the ABTS+and total phenols. The model allowed the correct classification of 98% of the original grouped data (Fig. 2), 88% for the LOO-CV (6 the 48 olive oils misclassified according to the tree planting density) and 87 ± 8% for the repeated K-fold-CV (4 folds × 10 repeats leading to 40 randomly runs, with sensitivities ranging from 75.0% to 100%). These results showed the accuracy of the established multivariate linear classification approach, pointing out that the 19 composition, quality and radical scavenging activity parameters could be used as chemical markers to discriminate olive oils according to the planting tree density, con-firming the supposition that this agricultural production factor may indeed significantly influence the chemical composition and quality of the olive oil. Actually, fromFig. 2it can be observed that each of the four planting tree density evaluated (d1250, d1667, d2000 and d2500) is located in a specific region of the 3D space described by the three linear discriminant functions (LDFs) of the LDA-SA model (d1250: ne-gative regions of the 1st and 2nd LDFs plus positive region of the 3rd LDF; d1667: positive region of the 1st LDF; d2000: negative regions of
the 1st and 3rd LDFs; and, d2500: negative region of the 1st LDF and positive regions of the 2nd and 3rd LDFs). Thus, it could also be in-ferred, based on the magnitude (after scaling) and sign of the coeffi -cients of each parameter included in the LDFs (data not shown) that: (i) ΔK values contributed mostly for the discrimination of the olive oils produced from olive trees planted at a tree density of 1250 trees ha−1; (ii) the K270extinction coefficient values, the contents of C18:2, C18:3 and C20:0 and total MUFA had the main contribution for correctly classifying olive oils produced at a planting density of 1667 trees ha−1; (iii) the C16:1, C17:1, C18:1, C20:1 and C22:0 contents were those that mostly contributed for correctly identifying olive oils produced from olive trees planted at a density of 2000 trees ha−1; andfinally, (iv) the fatty acids C17:0 and C18:3 gave the main contribution for assessing olive oils obtained from olives produced at a planting density of 2500 trees ha−1
. From these overallfindings it could be tentatively stated that, olive oils fatty acids composition as well as the content of the quality physicochemical parameters were the mostly influenced by the panting tree density, although it was not possible to establish an enhancing or reducing effect from the density increase, which could probably be attributed to the uncontrolled crop year effect, due to the climatic effects.
Similarly, a LDA-SA model was also established to distinguish olive oils produced at different planting trees (d1667, d1905, d2222), for which the distance between trees within the same row was fixed at 1.5 m (varying the distance between the planting rows of the olive grove from 3 m to 4 m). From the composition, quality, radical scavenging activity parameters evaluated for each olive oil, 15 para-meters (K232,ΔK, DPPH,Δ-tocopherol, Vitamin E, C16:0, C16:1, C17:0, C17:1, C18:2, C18:3, C20:1, C22:0, SFA and MUFA) were selected using the SA algorithm, which allowed obtaining a multivariate linear clas-sification model with 2 significant LDFs (which explained 98.1% and 1.9% of the data variability). It should be referred that 10 of the se-lected parameters are common to both classification models, showing in this case, the relevant contribution of the fatty acids composition for assessing the correct planting tree density, strengthen the premise that, planting density may greatly influence the olive oils fatty acids con-tents. This latter LDA-SA model also showed a quite satisfactory clas-sification performance, with sensitivities of 100% for original grouped data (Fig. 3) and 97% for LOO-CV internal validation technique (only 1 olive oil misclassified), as well as mean sensitivities of 96 ± 6% for the repeated K-fold-CV procedure (varying from 78% to 100%). Finally, it could be also inferred (Fig. 3) that olive oils obtained from olive pro-duced at tree planting density of 1667 trees ha−1, are mainly located in the negative regions of the 1st and 2nd LDFs, to which greatly con-tribute composition on fatty acids (namely, C16:1, C17:1, C18:2, C18:3, C20:1, total SFA and MUFA). On the contrary, olive oils produced from olive groves with a tree planting density of 1905 trees ha−1
, were lo-cated in the positive region of the 1st LDF and on the negative region of the 2nd LDF, mainly due to the contents of C16:0, C17:1 and C22:0. Lastly, olive oils obtained from olive groves with a planting density of 2222 trees ha−1, were placed on the positive region of the 2nd LDF and near the origin of the 1st LDF, being the synergetic effect ofΔK values, C16:0, C17:0 and C22:0 the main responsible for their discrimination. Once again, the overall contribution of the fatty acids contents towards the successful discrimination of olive oils according to the tree planting densities is unequivocally, showing that olive oil fatty acids composi-tion is highly influenced by the olive grove planting densities.
4. Conclusions
With the present work it was intended to study the effect of olive plant density, with distance planting variations within the row and between rows. For that, olive oils produced from the widespread olive cultivar Arbequina were evaluated, taking into account the olive oil quality, composition and oxidative stability along the first years of production. The results allow concluding that the number of trees per
Fig. 2.Discrimination of commercial olive oils according to the olive tree planting density using a LDA-SA model with 3 linear discriminant functions, based on the olive oils contents of FA, PV, K232, K270,ΔK,β- andγ-tocopherols, C16:1, C17:0, C17:1, C18:1, C18:2, C18:3, C20:0, C20:1, C22:0, total MUFA, ABTS+and total phenols. Olive tree planting densities for which the distance between tree planting rows in the olive grove was set equal to 4 m, varying the distance between trees within the same row from 1.0 to 2.0 m (d1250: 1250 trees ha−1, d1667: 1667 trees ha−1, d2000: 2000 trees ha−1and d2500: 2500 trees ha−1).
N. Rodrigues et al. Scientia Horticulturae 238 (2018) 222–233