Impact of Weight Variation on the Metabolic Stability of Cardiac
Transplant Patients in the State of Ceara
Daniele Maria de Oliveira Carlos
1,2,3, Francisco Clineu Queiroz França
1,4, João David de Sousa Neto
3, Carlos Antonio
Bruno da Silva
1,2Universidade Federal do Rio Grande do Norte1, Universidade de Fortaleza2, Hospital de Messejana Dr. Carlos Alberto Studart Gomes3, Faculdade Integrada do Ceará4, Fortaleza, CE - Brazil
Mailing address: Carlos Antonio Bruno da Silva •
Jose Vilar, 2.865 - Dionísio Torres - 60125-001 - Fortaleza, CE - Brasil E-mail: [email protected]
Manuscript received October 30, 2006; revised manuscript received May
Summary
Background: Weight changes frequently occur after cardiac transplantation (CT) and increase the risk of secondary diseases.
Objective: To determine the impact of weight variation on serum levels of glucose, triglyceride, total cholesterol, LDL, HDL and triglycerides of cardiac transplant patients.
Methods: Retrospective documentary study conducted with 82 adult patients undergoing CT between October 1997 and December 2005 in the State of Ceara, Brazil. A total of 83% of the patients were male and the mean age was 45.06±12.04 years. The variables studied were biopathological profile, weight, and body mass index (BMI) in relation to biochemical and metabolic changes. Data were described using frequencies, measures of central tendency, Student’s t test and Pearson’s correlation coefficient.
Results: The mean overall BMI increased from 23.77±3.68kg/m2 prior to CT, to 25.48±3.92kg/m2 in the first year and
to 28.38±4.97kg/m2 in the fifth. Overweight/obese patients (BMI > 25 kg/m2) showed mean values of glucose, total
cholesterol, low-density lipoprotein (LDL) and triglycerides higher than those of normal-weight/underweight patients (BMI < 25 kg/m2).
Conclusion: There was a direct and significant correlation of nutritional status and weight variation with the metabolic profile of cardiac transplant patients. (Arq Bras Cardiol 2008; 90(4): 268-273)
Key words: Heart transplantation; obesity; body mass index; metabolism.
Significant weight gain is frequently described in patients undergoing organ transplantation. The development or worsening of overweight and obesity has been demonstrated in these patients and may affect the therapeutic success of some types of transplants3. Whereas in lung transplant patients weight gain has been associated with longer survival, in cardiac transplant patients it has been the opposite4.
Excessive weight gain has been reported in the follow-up of CT, affecting approximately 50% of the patients5. On average, these patients gain approximately 10 kg within the first year after the procedure, thus increasing the risk of development of secondary diseases such as hypertension, diabetes and dislipidemias4.
Obesity is a chronic condition characterized by excess body fat, and body mass index (BMI) is the most widely used marker for its quantification5. Obese patients (BMI > 30 kg/m2) present 2 to 5-fold higher mortality than normal-weight (21-27 kg/m2) and overweight (IMC 27-30 kg/m2) patients6.
The objective of this study was to determine the impact of weight variation on serum levels of glucose, triglycerides, total cholesterol, LDL, HDL and triglycerides of cardiac transplant
Introduction
Cardiac transplantation (CT) represents one of the most revolutionary medical advances of our time. It is the treatment of choice for patients with severe heart failure (HF), New York Heart Association (NYHA) class III or IV, with disabling symptoms, or high death risk within one year and with no possible alternative clinical or surgical treatment1.
Methods
Study population
A retrospective analysis was made of 91 medical records of adult patients undergoing CT between October 1997 and December 2005 in Hospital de Messejana Dr. Carlos Alberto Studart Gomes in the State of Ceara, Brazil. For data analysis, nine patients were excluded because their weight and height records prior to CT were missing, so that 82 patients remained in the study. The total follow-up time was 99 months.
Data collection
Data were obtained from medical records, and weight (kg), height (m), gender, age and pretransplant diagnosis were the variables considered for this study.
The follow-up time points considered were: immediately post CT, 1, 3, 6, 12, 24, 36, 48, and 60 months after surgery. Laboratory parameters such as blood glucose, triglycerides, total cholesterol, LDL, HDL and triglycerides were also considered and compared in the same period.
Weight classiication
For the analysis of body weight, we used body mass index (BMI), as calculated by the formula: weight (kg) ÷ [height (m)]2. The patients were then classified according to the World Health Organization – 1997 as: underweight (< 18.5 kg/m2), normal-weight (18.5 to 24.9 kg/m2), overweight (25 to 29.9 kg/m2) and obese (≥ 30 kg/m2).
Patient distribution according to pretransplant diagnosis
Regarding the profile of the underlying myocardial disease, the group was divided into idiopathic, ischemic, chagasic dilated cardiomyopathy (DCMP), and other causes.
Statistical analysis
Data were described using descriptive statistical techniques which involve measures of central tendency, dispersion, frequency and distribution, and were expressed as mean ± standard deviation and quartiles (BMI).
Correlation analysis between BMI and metabolic profile, both global, was performed with Pearson’s coefficient using the SPSS software. The Student’s t test was used for comparison of two means of the metabolic profile of the two groups. The level of significance was set at p < 0.05 for all tests.
Ethical aspects
This study was submitted to and approved by the Institutional Ethics Committee and was based on resolution 196/96 of the National Research Ethics Commission (Comissão Nacional de Ética em Pesquisa - CONEP) of the National Health Council (CNS), preserving the anonymity and privacy of the participants. Process no. 186/04 approved in the meeting of the Research Ethics Committee of Hospital de Messejana Dr. Carlos Alberto Studart Gomes – Ceara, held on 10/01/04.
Results
Baseline characteristics
All patients were studied as a single group regardless of gender, comprising a total of 82 individuals. Of these, 68 (83%) were males and 14 (17%) were females. The mean age of the group was 45.06±12.04 years, ranging from 20 to 73 years.
Patients were distributed according to the etiology of heart failure as follows: idiopathic dilated cardiomyopathy in 36 (43.9%) patients, ischemic cardiomyopathy in 12 (14.63%), chagasic cardiomyopathy in 13 (15.85%) and of other causes in 21 (25.6%) distributed in cardiomyopathies due to heart valve disease 7 (8.5%), peripartum 2 (2.43%), alcohol 8 (9.75%), congenital 2 (2.43%), hypertensive 1 (1.2%) and hypertrophic 1 (1.2%).
Pre and post-cardiac transplantation nutritional status
Based on the analysis of BMI changes related to time, we observed that prior to CT the patients were: underweight 3 (3.65%), normal-weight 48 (58.53%), overweight 26 (31.7%) and obese 5 (2.5%). After transplantation, the patients progressed with weight gain, thus the number of normal-weight patients decreased and that of overnormal-weight and obese patients increased in the period of 12 months (47.05% normal-weight, 38.23% overweight and 14.5% obese) and 60 months (37.5% normal-weight, 25% overweight and 37.5% obese).
Post-cardiac transplantation weight and overall BMI variation
Weight variation was analyzed using mean BMI, standard deviation and quartiles.
A reduction in body mass index in relation to the pre-CT period was observed in the first and third postoperative months, followed by a progressive gain until the end of the 60-month post-transplantation follow-up, and this was corroborated by the percentiles (Table 1).
Table 1 - Post-cardiac transplantation weight and overall BMI variations in percentiles. Fortaleza, 2005
Period
(months) BMI (Kg/m
2) BMI
P25 BMI
P50 BMI P75 Weight (kg)
Pre-transplant 23.77± 3.68 20.70 23.92 25.89 63.80± 11.07
1 23.44± 2.89 21.10 22.92 25.75 62.72± 9.08
3 23.01± 3.52 20.50 22.54 24.32 62.66± 10.36
6 24.46± 3.79 21.87 24.11 25.87 66.89± 12.87
12 25.48± 3.92 23.02 25.06 28.37 68.04± 12.37
24 26.70± 3.94 24.57 26.67 28.80 69.54± 13.58
36 26.53± 3.45 24.75 25.53 27.89 68.97± 8.72
48 27.47± 3.85 25.39 27.52 33.38 71.37± 10.53
60 28.38± 4.97 24.61 28.21 33.38 73.18 ± 11.68
< 25 kg/m2 BMI Pre-CT
Patients with BMI < 25 kg/m2 progressed with increase in blood glucose levels only in the first month post-CT; these levels remained unchanged in the other periods. Total cholesterol and LDL, in turn, started to increase as from the third month, and triglyceride as from the sixth month. HLD remained at adequate levels during all the follow-up period and dropped at the 60th month (Table 2).
≥ 25 kg/m2 BMI Pre-CT
Patients with ≥ 25 kg/m2 BMI presented increased blood glucose in the first month, 12th month and at 48th month post-transplantation. Cholesterol and triglycerides levels were already abnormal as from the first month and LDL as from the sixth month post-transplantation. HDL levels remained adequate during all the follow-up period (Table 2).
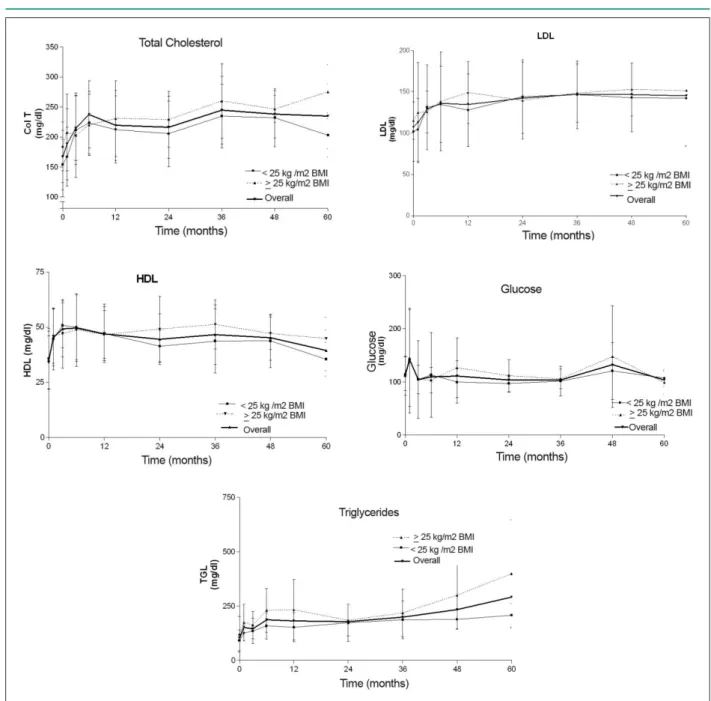
The two groups of patients - < 25 kg/m2 BMI and ≥ 25 kg/m2 BMI progressed with increased body weight and abnormal levels of total cholesterol, LDL and triglycerides in the follow-up of CT (Figure 1).
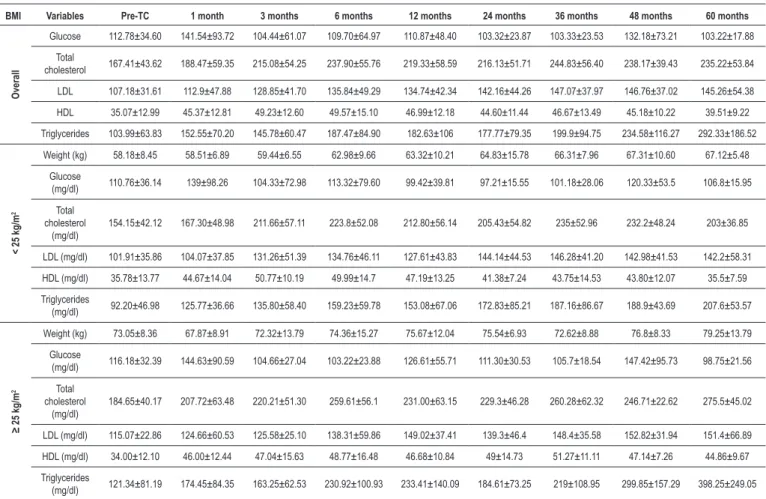
Table 2 - Pre and post-CT progression of the metabolic proile according to the groups: overall, < 25 kg/m2 BMI pre-CT, and ≥ 25 kg/m2 BMI pre-CT. Fortaleza, 2005
BMI Variables Pre-TC 1 month 3 months 6 months 12 months 24 months 36 months 48 months 60 months
O
ver
all
Glucose 112.78±34.60 141.54±93.72 104.44±61.07 109.70±64.97 110.87±48.40 103.32±23.87 103.33±23.53 132.18±73.21 103.22±17.88
Total
cholesterol 167.41±43.62 188.47±59.35 215.08±54.25 237.90±55.76 219.33±58.59 216.13±51.71 244.83±56.40 238.17±39.43 235.22±53.84
LDL 107.18±31.61 112.9±47.88 128.85±41.70 135.84±49.29 134.74±42.34 142.16±44.26 147.07±37.97 146.76±37.02 145.26±54.38
HDL 35.07±12.99 45.37±12.81 49.23±12.60 49.57±15.10 46.99±12.18 44.60±11.44 46.67±13.49 45.18±10.22 39.51±9.22
Triglycerides 103.99±63.83 152.55±70.20 145.78±60.47 187.47±84.90 182.63±106 177.77±79.35 199.9±94.75 234.58±116.27 292.33±186.52
< 25 kg/m
2
Weight (kg) 58.18±8.45 58.51±6.89 59.44±6.55 62.98±9.66 63.32±10.21 64.83±15.78 66.31±7.96 67.31±10.60 67.12±5.48
Glucose
(mg/dl) 110.76±36.14 139±98.26 104.33±72.98 113.32±79.60 99.42±39.81 97.21±15.55 101.18±28.06 120.33±53.5 106.8±15.95
Total cholesterol
(mg/dl)
154.15±42.12 167.30±48.98 211.66±57.11 223.8±52.08 212.80±56.14 205.43±54.82 235±52.96 232.2±48.24 203±36.85
LDL (mg/dl) 101.91±35.86 104.07±37.85 131.26±51.39 134.76±46.11 127.61±43.83 144.14±44.53 146.28±41.20 142.98±41.53 142.2±58.31
HDL (mg/dl) 35.78±13.77 44.67±14.04 50.77±10.19 49.99±14.7 47.19±13.25 41.38±7.24 43.75±14.53 43.80±12.07 35.5±7.59
Triglycerides
(mg/dl) 92.20±46.98 125.77±36.66 135.80±58.40 159.23±59.78 153.08±67.06 172.83±85.21 187.16±86.67 188.9±43.69 207.6±53.57
≥ 25 kg/m
2
Weight (kg) 73.05±8.36 67.87±8.91 72.32±13.79 74.36±15.27 75.67±12.04 75.54±6.93 72.62±8.88 76.8±8.33 79.25±13.79
Glucose
(mg/dl) 116.18±32.39 144.63±90.59 104.66±27.04 103.22±23.88 126.61±55.71 111.30±30.53 105.7±18.54 147.42±95.73 98.75±21.56
Total cholesterol
(mg/dl)
184.65±40.17 207.72±63.48 220.21±51.30 259.61±56.1 231.00±63.15 229.3±46.28 260.28±62.32 246.71±22.62 275.5±45.02
LDL (mg/dl) 115.07±22.86 124.66±60.53 125.58±25.10 138.31±59.86 149.02±37.41 139.3±46.4 148.4±35.58 152.82±31.94 151.4±66.89
HDL (mg/dl) 34.00±12.10 46.00±12.44 47.04±15.63 48.77±16.48 46.68±10.84 49±14.73 51.27±11.11 47.14±7.26 44.86±9.67
Triglycerides
(mg/dl) 121.34±81.19 174.45±84.35 163.25±62.53 230.92±100.93 233.41±140.09 184.61±73.25 219±108.95 299.85±157.29 398.25±249.05
Pre-CT - pre-cardiac transplantation.
Correlation between BMI and metabolic proile
Considering the overall means of the metabolic profile (Table II), no correlation was found between BMI and glucose (RR = 0.214 and p = 0.581) and between BMI and HDL (RR = 0.185 and p = 0.633). A correlation was found between BMI and total cholesterol, but it was not statistically significant (RR= 0.637 and p = 0.06). A strong and statistically significant correlation was found between BMI and LDL (RR = 0.810 and p = 0.008) and between BMI and triglycerides (RR = 0.866 and p = 0.003).
Patients with ≥ 25 kg/m2 BMI pre-CT were demonstrated to have higher serum levels of glucose, total cholesterol, LDL and triglycerides (Table 3).
Discussion
Figure 1 - Progression of the overall metabolic proile and in the groups with < 25 kg/m2 BMI and ≥ 25 kg/m2 BMI. Values: mean ± standard deviation. Fortaleza, 2005.
Table 3 - Comparison between means ± standard deviation of biochemical parameters according to the groups: < 25 kg/m2 BMI pre-CT and ≥ 25 kg/m2 BMI pre-CT. Fortaleza, 2005
Variables < 25 kg/m
2 BMI pre-CT
(n = 51)
≥ 25 kg/m2 BMI pre-CT
(n = 31) P
Glucose 110.26±13.01 117.60±18.07 0.047
Total cholesterol 205.03±27.63 234.99±28.65 0.014
LDL (mg/dl) 130.57±16.84 138.28±16.63 0.008
HDL (mg/dl) 44.84±4.59 44.79±6.0 NS
Triglycerides (mg/dl) 158.06±36.06 225.0±82.54 0.005
and the mean age was 45.06 years. Considering the diseases that led to transplantation, our data are consistent with those of the international literature9, where a predominance of idiopathic and ischemic dilated cardiomyopathy is observed. In our setting, the chagasic etiology was also found2,10.
In the first month post-transplantation the patients had a tendency to lose weight. In the study sample, this tendency was also verified (mean weight of 62.72 ± 9.09 kg, ranging from 46 to 97 kg), despite the use of high doses of glucorticoids as part of the immunosuppressive therapy to which the weight gain of these patients has been attributed. The weight loss that occurs in this period could be associated with the catabolic effects of surgery, fluid loss or decreased food ingestion in the immediate postoperative period4.
Obesity has been associated with several etiologic factors including genetic factors, sedentary lifestyle, unbalanced diet, use of medications and neuroendocrine disorders5. Its effects on morbidity and mortality have been investigated, and it has been usually found associated with hypertension, dislipidemias, coronary artery disease, insulin resistance, non-insulin dependent diabetes mellitus, gallbladder disease, respiratory dysfunction, joint diseases and some malignancies in the general population3,8,11.Despite the controversies regarding the relationship between obesity and mortality, it has been demonstrated that obesity is an independent risk factor of mortality from coronary artery disease11.
Excessive weight gain resulting in obesity has been observed after transplantation12. This already starts to occur as from the first year post procedure13, as has been demonstrated in some studies: in 158 patients studied in Columbia Presbyterian Medical Center, the mean weight gain was 8 Kg in six months and approximately 10 Kg in one year after the procedure4. In another study, 47 patients followed up in Henry Ford Hospital also presented a mean weight gain of 10 kg14. In our study sample, in turn, the weight gain was lower, with a mean of 4.24 kg in this period. However, the patients progressed with overweight in the first year (mean BMI 25.48± 3.92 kg/m2). Weight changes continued to occur throughout the years and in the fifth year post-transplantation overweight was higher (28.38± 4.97 kg/m2), thus almost borderline obesity.
The development of coronary artery disease is a serious limiting factor in the long-term follow-up of CT patients, and accelerated graft atherosclerosis remains the main late complication due to its high morbidity and mortality15.
Most transplant recipients show increased cholesterol and/or triglyceride levels. The etiology of dislipidemia is multifactorial and also seems to play an important role in graft atherosclerosis15.
In 1999, Kocher et al8 studied 612 patients to evaluate the impact of overweight and obesity on CT and demonstrated
that the group of overweight and obese patients (BMI ≥ 27
kg/m2) tends to have higher cholesterol and triglyceride levels in the pre and post-transplantation period than the group of patients with low and normal weight (IMC < 27 kg/m2), although their results were not statistically significant.
Rezende et al’s study16 determined the association of BMI and abdominal circumference with risk factors for cardiovascular diseases in 231 non-transplant patients and
verified that with the increase in BMI (overweight BMI 25-29.99 kg/m2 and obesity BMI ≥ 30 kg/m2) there was an elevation in blood glucose and triglycerides and a reduction in HDL, but total cholesterol and LDL remained practically unchanged.
When we analyzed the frequency of the metabolic profile of the case series studied, we verified that overweight/obese
patients (BMI ≥ 25 kg/m2) had mean blood glucose and triglyceride levels higher than those of normal-weight/ underweight patients (BMI < 25 kg/m2), and unlike in a previous study16 they also presented higher total cholesterol and LDL levels (p < 0.05). In both groups total cholesterol, LDL and triglyceride levels increased during the follow-up of CT, and the overweight/obese group showed more significant and earlier changes.
CT is a well-established therapeutic modality; however, it results in weight change already in the first year4, which was corroborated in this case series. This condition has been related to increased obesity and its complications such as dislipidemias, hypertension, renal dysfunction, infections, and neoplasias resulting from the maintenance immunosuppressive therapy15.
In view of the results demonstrated in this study, we conclude that overweight/obese patients are more prone to present higher levels of glucose, total cholesterol, LDL and triglycerides than normal-weight/underweight patients.
We therefore point out the need for a multidisciplinary and well-structured team comprising clinicians, surgeons, nutritionists, nurses, psychologists, social assistants, dentists, physical therapists, physical educators and occupation therapists in transplant centers in order to achieve an effective clinical and nutritional monitoring. Thus, increasingly more satisfactory results both in the short and in the long-term can be offered, and quality of life can also be ensured to these patients.
Limitations
Considering the retrospective design of this study, its major limitation was the difficulty to obtain pre-transplant and follow-up data because of the time gap between protocol, clinical and laboratory routine implementation and the performance of an integrated outpatient follow-up. Furthermore, patients who had been referred from other health units returned to those units, thus interrupting the follow-up in the transplant center.
Potential Conflict of Interest
No potential conflict of interest relevant to this article was reported.
Sources of Funding
There were no external funding sources for this study.
Study Association
References
1. Guimarães JI, Mesquita ET, Bocchi EA, Vilas-Boas F, Montera MW, Moreira MCV, et al. Revisão das II Diretrizes da Sociedade Brasileira de Cardiologia para o diagnóstico e tratamento da insuficiência cardíaca. Arq Bras Cardiol. 2002; 79 (supl 4): 3-30.
2. Assef MAS, Valbuena PFMF, Neves Jr MT, Correia EB, Vasconcelos M, Manrique R, et al. Transplante cardíaco no Instituto Dante Pazzanese de Cardiologia: análise de sobrevida. Rev Bras Cir Cardiovasc. 2001; 18: 289-304.
3. Grady KL, Costanzo MR, Fisher S, Koch D. Preoperative obesity is associated with decreased survival after heart transplantation. J Heart Lung Transplant. 1996; 15: 863-71.
4. Williams JJ, Lund LH, LaManca J, Kunavarapu C, Cohen DJ, Heshka S, et al. Excessive weight gain in cardiac transplant recipients. J Heart Lung Transplant. 2001; 25: 36-41.
5. Johnson DW, Isbel NM, Brown AM, Kay TD, Franzen K, Hawley CM, et al. The effect of obesity on renal transplant outcomes. Transplantation. 2002; 74: 60-1.
6. Lietz K, John R, Burke EA, Ankersmit JH, McCue JD, Naka Y, et al. Pretransplant cachexia and morbid obesity are predictor of increased mortality after heart transplantation. Transplantation. 2001; 72 (2): 277-83.
7. Moraes Neto F, Tenório D, Gomes CA, Tenório E, Hazin S, Magalhães M, et al. Transplante cardíaco: a experiência do Instituto do Coração de Pernambuco com 35 casos. Rev Bras Cir Cardiovasc. 2001; 16 (2): 152-9.
8. Kocher AA, Ankersmit A, Ofner P, Zuckerman A, Grimm M, Shlechta B, et al. Effect of obesity on outcome after cardiac transplantation. Transplant Proc. 1999; 31: 3187-9.
9. Hosenpud JD, Bennett LE, Keck BM, Fiol B, Boucek MM, Novick RJ. The registry of the International Society for Heart and Lung Transplantation: fourteenth official report – 1999. J Heart Lung Transplant. 1999; 18: 611-26.
10. Couto JW, Branco JNR, Almeida D, Carvalho AC, Vick R, Teles CA, et al. Transplante cardíaco e infecção. Rev Bras Cir Cardiovasc. 2001; 16 (2): 41-51.
11. Grady KL, White-Williams C, Naftel D, Costanzo MR, Pitts D, Rayburn B, et al. Are preoperative obesity and cachexia risk factors for post heart transplant morbidity and mortality: a multi-institutional study of preoperative weight-height indices. J Heart Lung Transplant. 1999; 18: 750-63.
12. Climato TR, Jessup M. Recipient selection in cardiac transplantation: contraindications and risk factors for mortality. J Heart Lung Transplant. 2002; 21: 1161-73.
13. Leaf DA, Kobashigawa J, Gleeson M, Laks H, Defining obesity in patients undergoing ortotopic heart transplantation: body mass index versus percent body fat. J Heart Lung Transplant. 1997; 16: 563-5.
14. Baker AM, Levine TB, Goldberg AD, Levine AB. Natural history and predictors of obesity after orthotopic heart transplantation. J Heart Lung Transplant. 1992; 11: 1156-9.
15. Aanholt DV, Costa RC, Meale MMS, Marcilio CS, Nakasato M, Kinchoku H, et al. I Diretrizes nutricionais em cardiologia. Rev Soc Cardiol Estado de São Paulo. 2001; 11 (supl A): 21-57.