1
A Work Project, presented as part of the requirements for the Award of an
International Master in Finance
from the
NOVA
–
School of Business and Economics
and a
Professional Master in Finance
from the
Fundação Getúlio Vargas
–
São Paulo School of Economics
WORKING CAPITAL MANAGMEENT AND PERFORMANCE OF
LISTED SMALL AND BIG COMPANIES: EVIDENCE FROM LATIN
AMERICA
Riccardo Bozzeda
Nova SBE Student Number: 29371
FGV-EESP Student Number: 338970
A project carried out on the Double Degree EESP-FGV,
under the supervision of:
Professor Fernando Anjos (Nova SBE, Lisbon, Portugal)
Professor Joelson Sampaio (EESP-FGV, São Paulo, Brazil)
Date:
2
WORKING CAPITAL MANAGMEENT AND PERFORMANCE OF
LISTED SMALL AND BIG COMPANIES: EVIDENCE FROM LATIN
AMERICA
Abstract
This paper provides evidence of the effect of Working Capital Management (WCM) on the performance of Latin America companies. The study also investigates whether the effect of WCM on performance differs between “small” and “big” firms. The paper employs Panel data regression analysis on a sample of 117 non-financial firms over an eleven-year period (2005-2015). The results show that WCM has a convex relationship with performance. However, the results suggest that WCM is relatively more important for the performance of “big” companies than “small” companies. Overall, the study proves that WCM components do affect the performance of Latin America firms.
3
Table of Contents
1) Introduction ... 4
2) Theoretical Framework ... 6
2.1) Conceptual Definitions ... 6
2.2) Influent Factors of Working Capital Management ... 7
2.3) Literature Review and Hypothesis Development ... 8
2.3.1) CashManagement ... 8
2.3.2)InventoryManagement ... 9
2.3.3) AccountReceivableManagement ... 10
2.3.4) Account PayableManagement ... 10
2.3.5) SME’sAnalysis ... 11
3) Data Collection ... 12
4) Variable Descriptions ... 12
4.1) Dependent Variables ... 12
4.2) Independent Variables ... 13
4.3) Controlling Variables ... 14
4.4) Summary Statistics ... 14
5) Models and Analysis ... 15
4.1) Correlation Analysis ... 15
4.2) Regression Models ... 16
4.3) Regression Analysis of the General Model ... 17
4.4) Analysis of the CCC Components ... 18
4.5) Analysis of “Small” and “Big” Companies ... 19
6) Conclusions ... 20
7) Bibliography ... 22
4 1.
Introduction
The goal of this paper is to study the relationship between working capital management and the performance of “small” and “big” firms in a specific developing market: Latin America. Additionally, this study analyses whether there is an optimal level of working capital at which firm profitability gets maximised. The relationship between working capital management and corporate performance has been a focus of substantial amount of empirical researches in the last years. However, no study to the best of my knowledge, has ever compared the different impact of the working capital management on firm performance in this wide market.
According to the results of the survey conducted in Europe by KPMG (2005), 74% of the leading companies reveal that working capital management is of great significance. In fact, current assets constitute more than half of the total assets of a business firm (Atseye, Ugwu, & Takon, 2015). Smith (1987) argues that WCM is crucial for both liquidity and profitability. It involves planning and controlling current assets and currents liabilities in such a way that eliminates the risk of insolvency in the short term and avoids overinvestment in these assets (Eljelly, 2004).
The survey carried out by Payne and Bustos (2008) and the study conducted by Elizalde (2003) affirmed that Latin American companies are not adequately managing their working capital level. Given the uncertainty with regard to the payments and collections as well as the poor implementation of sales projections, Latin American firms have overinvested in working capital. According to Mongrut et al. (2014), another possible explanation of this overinvestment by companies in Latin America could be related to the short-term investment horizon. Given the high growth and political instability that characterized these countries in the past years,
5
Furthermore, Lamberson (1995) argues that many financial managers struggle to identify the important drivers and the optimal level of working capital to positively influence profitability. On the one hand, large inventories and generous credits may generate positive effect. For instance, larger inventory reduces the risk of a stock-out whereas granting credits may lead to higher sales because it allows customers to evaluate the product quality before paying (Deloof & Jeger, 1996). Moreover, in a high interest rate environment such as the Latin American one, the trade credit can be regarded as an inexpensive source of short-term debt for customers. On the other hand, allowing credits and keeping high inventories would, in turn, lock up big quantity of money in the working capital.
Deloof (2003) found a negative relationship between working capital management and corporate profitability for the biggest Belgian companies, whereas Akoto et al. (2013) found that the cash conversion cycle significantly positively affects the profitability of listed manufacturing firms in Ghana.
Although there is strong evidence in literature which indicates that working capital management is crucial for companies, albeit, the big question is whether the working capital management importance on firm’s profitability varies between “small” and “big” firms. According to a study conducted by Ernst & Young (2011), size significantly affects the way companies manage their working capital management.
6
The paper proceeds as follows. In the next section, a review of the theoretical background and previous findings is presented. In section 3, the sample and the data used in the empirical analysis are introduced. Section 4 presents the variables and the hypothesis. Section 5 discusses the model and the obtained results. Finally, section 6 concludes.
2. Theoretical Framework
2.1 Conceptual Definitions
Working Capital, also called Net Working Capital, refers to the money used by companies in their daily activities. Mathematically, it is given by the difference between current assets and current liabilities. Depending on the level of the current assets and liabilities, the value of net working capital is positive or negative.
Gross Working Capital refers to the sum of all of a company’s current assets. It includes assets such as cash, savings account balances, account receivable, inventory and marketable securities.
7
2.2 Influent Factors of Working Capital Management
One of the most prominent theories about capital structure is the Pecking Order Model popularised by Myers and Majluf (1984). According to this theory, the cost of financing increases with asymmetric information. Based on this, companies prioritise their sources of financing, first preferring internal financing, and then raising debt and finally issuing equity as last source to reduce adverse signals that might be emitted. This theory implies that companies do not have a target debt-equity ratio as they choose their leverage ratio according to their financial needs. Furthermore, the theory also implies that when a company increases its internal funds, its leverage falls. In summary, managers should, in order to reduce the adverse selection, try to maintain a surplus of internal funding to boost profitability (Wasiuzzaman & Chettiar, 2013).
8
2.3 Literature Review and Hypothesis Development
2.3.1 Cash Management
The effect of cash is not only on the company’s cash position, but it rather affects the company’s profit (Abuzar, 2004). It is therefore important for a firm to have a wide understanding about the relation between the cash conversion cycle (CCC) and corporate performance.
Enqvist et al. (2013), who investigated the influence of working capital management (WCM) on performance of Finnish listed companies over an 18-year period and used regression analysis to determine the relationship between working capital management and performance of the same companies, found out that there exists a negative relationship between the cash conversion cycle and profitability.
Akoto et al. (2013), while analysing the relationship between working capital management and corporate profitability of all the 13 listed manufacturing firms in Ghana during the period from 2005 to 2009, found a significant positive relationship between the cash conversion cycle and profitability.
Additionally, it seems relevant to study whether an optimal level of working capital exists. Very few researches were conducted on this specific topic.
Afrifa et al. (2015) studied the effect of working capital management (WCM) on the performance of listed Small and Medium Enterprises (SMEs). The authors employed Panel data regression analysis on a sample of 141 Alternative Investment Market listed SMEs during the period from 2007 to 2014. The results show that there is evidence of a non-linear relationship (concave) between the WCM components and firm profitability.
9
data and the Generalised Method of Moments (GMM), the authors found out that there is a non-monotonic relationship (concave) between the two variables, which indicates that SMEs do have an optimal working capital level that maximises their profitability.
Based on the results of empirical studies, the first set of hypothesis states that: Hypothesis 1: There is a positive/negative relationship between CCC and ROA
Hypothesis 1a: There is a non-linear relationship between CCC and ROA
2.3.2 Inventory Management
Inventories (DIO) refer to the stock available within the asset structure and encompass raw materials, work-in-progress and finished goods (Hassan, Maturi, & Mberia, 2017).
Taghizadeh et al. (2012) studied the impact of working capital management on firm’s performance among 50 Iranian companies during the period from 2006 to 2009. Pearson correlation technique and Ordinary Least Square (OLS) regression technique were used. In this study, the authors found out that there is a negative coefficient relationship between the inventory conversion period and profitability.
Mathuva (2010) has examined a sample of 30 Kenyan firms listed on Nairobi Stock Exchange over the period from 1996 to 2008 to study the influence of working capital management components on corporate profitability. Based on the correlation and regression analysis, he established a strong positive relationship between the inventory conversion period and profitability. The author argued that to reduce the costs of possible interruptions in the production process and loss of business due to scarcity of products, the firm needs to maintain high level of inventory.
10
2.3.3 Account Receivables Management
Account receivable (DSO) refers to the money the company is owed from its client. Receivable is a line of credit extended by the company due within a time period, which depends on the payment terms (up to a year).
Deloof (2003) did a study on the relationship between working capital management (WCM) and corporate profitability among the biggest Belgian companies. He used a sample of 1009 large Belgian non-financial firms during the period from 2008 to 2012. Based on the correlation and regression analysis, he found a negative relationship between the number of days in account receivables and gross operating income.
Almazari (2014) conducted a study on the relationship between working capital management (WCM) and company profitability for Saudi cement manufacturing firms. The sample included 8 Saudi cement manufacturing firms listed on the Saudi Stock Exchange during the period from 2008 to 2012. Pearson correlation technique and Ordinary Least Square (OLS) regression technique were used. In this study, the author found a negative relationship between the number of days in account receivables and gross operating profit.
Based on the results of the empirical studies, the third hypothesis states that: Hypothesis 3: There is a negative relationship between DSO and ROA
2.3.4 Account Payable Management
Account payable (DPO), another important component of working capital management, refers to the money the company owes to its suppliers. Payable is a short-term debt to the company’s creditors.
11
6 years from 2006 to 2012. Based on the correlation and regression analysis, they found a positive relationship between the number of days in account payable and profitability.
Deloof (2003) did a study on the relationship between working capital management (WCM) and corporate profitability among the biggest Belgian companies. He used a sample of 1009 large Belgian non-financial firms during the period from 2008-2012. Based on the correlation analysis and the regression analysis, he found a negative relationship between the number of days in account payable and gross operating income.
Based on the results of empirical studies, the fourth hypothesis states that: Hypothesis 4: There is a positive/negative relationship between DPO and ROA
2.3.5 SMEs’ Analysis
According to a report published by Ernst & Young (2011), the size of a company is usually a good measure of the relative efficiency of its working capital performance. Their authors argued that big companies have easier access to resources (i.e. qualified personnel who manages the WC) and for this reason manage their working capital more effectively and efficiently than small companies do.
12
importance of working capital management should be more significant in “small” companies than in “medium” companies.
Based on the results of empirical studies, the fifth hypothesis states that:
Hypothesis 5: There is a significant difference in the effect of CCC on performance between
“small” and “big” firms
3. Data Collection
In order to analyse the paper’s proposition, a sample of 117 listed companies of the major Latin American stock exchanges during the period from 2005 to 2015 was used. In more detail, companies from Argentina, Brazil, Chile, Colombia and Mexico distributed across all industries except the financial firms have been included. Because Return on Assets was used as a proxy for company performance, and financial institutions have mainly financial assets on their balance sheet, the final result would be biased inasmuch as the operating activities of such companies will contribute very little to the overall return on assets (Deloof M. , 2003). All data are collected via Bloomberg.
4. Variable Descriptions
4.1 Dependent Variables
As previously utilised by Enqvist et al. (2013), Wang (2002) and José et al. (1996), Return on Assets (ROA), measured as the ratio of net income to total assets, was used as a proxy for company performance. ROA is a good measure of the company’s overall profitability and it is not obscured by special items or altered by the capital structure of the company (Barber & Lyon, 1996).
13
inasmuch as no significant relationship between the variables was found, the results will be presented only in the appendix (see tables 6-8 in the appendix).
4.2 Independent Variables
Following on the previous studies (e.g. Deloof (2003) and Enqvist et al. (2013)), Cash Conversion Cycle (CCC) was used as a measurement of the WCM. The CCC is a tool used to
gauge the overall financial health of a company. In specific, it measures how fast, in days, the company is able to convert cash into inventory and account payable, through sales and account receivable, and then back into cash.
𝐶𝐶𝐶 = 𝐷𝐼𝑂 + 𝐷𝑆𝑂 − 𝐷𝑃𝑂
Days Inventory Outstanding (DIO) = How many days it takes to sell all outstanding
inventory (𝐼). 𝐷𝐼𝑂 = ( 𝐼
𝐶𝑂𝑆𝑇 𝑂𝐹 𝐺𝑂𝑂𝐷𝑆 𝑆𝑂𝐿𝐷) ∗ 365
Days Sales Outstanding (DSO) = How many days it takes to collect the money from the account receivable (AR). 𝐷𝑆𝑂 = ( 𝐴𝑅
𝑆𝐴𝐿𝐸𝑆) ∗ 365
Days Payable Outstanding (DPO) = How many days it takes to pay off the account payable
(AP). 𝐷𝑃𝑂 = ( 𝐴𝑃
𝐶𝑂𝑆𝑇 𝑂𝐹 𝐺𝑂𝑂𝐷𝑆 𝑆𝑂𝐿𝐷) ∗ 365
14
Conversely, excess inventories and longer account receivable cycles would increase the CCC, making the working capital less efficient.
Furthermore, CCC^2 was introduced into the regression to study the quadratic relationship between CCC and ROA.
4.3 Controlling Variables
Following previous studies (e.g. Deloof (2003) and Enqvist et al. (2013)), the company Size (Total Assets), Leverage (Total debt/Total Assets, LEV) and Tangibility (Net Fixed Asset/total asset, TANG) were included as variables that are likely to affect the relationship between WCM and corporate performance.
Additionally, a dummy variable was created to create two new variables. The Dummy takes the value 1 (“big” firms) for companies with Size (total assets) greater than the median of the variable Size of the sample, and it takes the value 0 otherwise (“small” firms). Firstly, CCC_Dummy, which is given by the product between the CCC and the variable Dummy, was calculated to study whether there is a difference degree of influence of working capital management on profitability between “small” and “big” companies. Secondly, a Time Fixed Effect (year dummy) was created to better control the effect of macro-economic variables on financial firms’ variables (see appendix).
4.4 Summary Statistics
15 Table 1 - Summary Statistics
MEAN MEDIAN MAX MIN
ROA 0.10 0.09 0.47 -0.33
Tobin’s Q 1.66 1.37 23.95 0.35
CCC 47.16 36.03 637.81 -573.81
CCC^2 10649.65 2229.79 406806.10 0.01
DIO 66.15 50.54 1509.93 0.00
DSO 54.21 45.61 286.79 1.50
DPO 68.26 54.76 1509.93 0.00
SIZE 210581.10 12758.97 15921322.00 50.12
LEV 0.28 0.28 1.02 0.00
TANG 40.50 40.05 89.66 0.03
5. Models and Analysis
5.1 Correlation Analysis
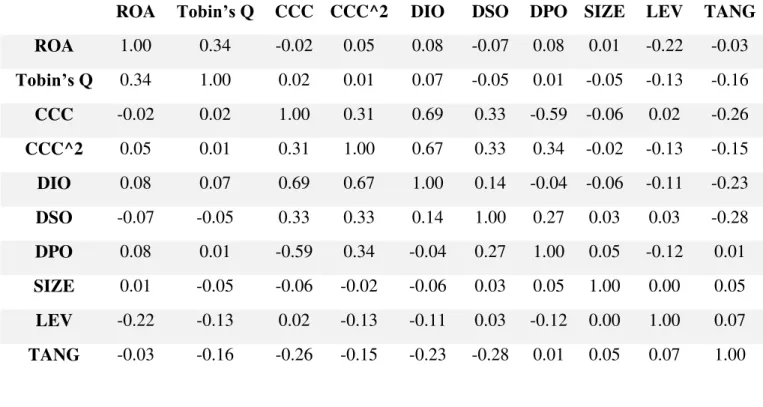
Table 2 represents the correlation matrix for of all the variables. It is worth noticing that the
negative relationship between the Cash Conversion Cycle and profitability (ROA) that have been found in the Latin American market seems to be consistent with the previous findings (Enqvist, Graham, & Nikkinen, 2013). However, a simple correlation matrix does not take into account the correlations between each selected variable and the entire independent variables (Padachi, 2006). For this reason, more suitable multivariate regression models will be used to accomplish the purpose of the paper.
16
Conversion Cycle. Nonetheless, it does not exceed the threshold. Therefore, it is possible to
conclude that no multicollinearity is present in the model.
Table 2 - Correlation Matrix
ROA Tobin’s Q CCC CCC^2 DIO DSO DPO SIZE LEV TANG
ROA 1.00 0.34 -0.02 0.05 0.08 -0.07 0.08 0.01 -0.22 -0.03
Tobin’s Q 0.34 1.00 0.02 0.01 0.07 -0.05 0.01 -0.05 -0.13 -0.16 CCC -0.02 0.02 1.00 0.31 0.69 0.33 -0.59 -0.06 0.02 -0.26 CCC^2 0.05 0.01 0.31 1.00 0.67 0.33 0.34 -0.02 -0.13 -0.15 DIO 0.08 0.07 0.69 0.67 1.00 0.14 -0.04 -0.06 -0.11 -0.23 DSO -0.07 -0.05 0.33 0.33 0.14 1.00 0.27 0.03 0.03 -0.28 DPO 0.08 0.01 -0.59 0.34 -0.04 0.27 1.00 0.05 -0.12 0.01 SIZE 0.01 -0.05 -0.06 -0.02 -0.06 0.03 0.05 1.00 0.00 0.05 LEV -0.22 -0.13 0.02 -0.13 -0.11 0.03 -0.12 0.00 1.00 0.07 TANG -0.03 -0.16 -0.26 -0.15 -0.23 -0.28 0.01 0.05 0.07 1.00
5.2 Regression Models
Following the structure of the previous studies, three models can be developed to achieve the goals of the paper:
Model 1:
𝑅𝑂𝐴𝑎 = 𝐶0+ 𝐶1𝐶𝐶𝐶𝑎+ 𝐶2𝐶𝐶𝐶𝑎2+ 𝐶3𝑆𝐼𝑍𝐸𝑎+ 𝐶4𝐿𝐸𝑉𝑎+ 𝐶5𝑇𝐴𝑁𝐺𝑎+ 𝐶6𝐷𝑢𝑚𝑚𝑦𝑎
+ 𝐶7𝑇𝐹𝐸𝑎
Model 2:
𝑅𝑂𝐴𝑎 = 𝐶0+ 𝐶1𝐷𝐼𝑂𝑎+ 𝐶2𝐷𝑆𝑂𝑎+ 𝐶3𝐷𝑃𝑂𝑎+ 𝐶4𝑆𝐼𝑍𝐸𝑎+ 𝐶5𝐿𝐸𝑉𝑎+ 𝐶6𝑇𝐴𝑁𝑎
17 Model 3:
𝑅𝑂𝐴𝑎 = 𝐶0+ 𝐶1𝐶𝐶𝐶𝑎+ 𝐶2𝐶𝐶𝐶𝑎2+ 𝐶3𝐶𝐶𝐶_𝐷𝑢𝑚𝑚𝑦𝑎+ 𝐶4𝑆𝐼𝑍𝐸𝑎+ 𝐶5𝐿𝐸𝑉𝑎+ 𝐶6𝑇𝐴𝑁𝐺𝑎
+ 𝐶7𝐷𝑢𝑚𝑚𝑦𝑎+ 𝐶8𝑇𝐹𝐸𝑎
5.3 Regression Analysis of the General Model
Next, regression analysis was used to study the effect of working capital management on profitability. The regressions were estimated by using Ordinary Least Square (OLS). The results of Model 1 can be found below in Table 3. The coefficient of the Cash Conversion Cycle is negative and has a significance level of 5%, hence implying that an increase of number of days of the Cash Conversion Cycle by 1 day is associated with a decline in Return on Assets by 0.00495%. This result is consistent with the studies conducted by Enqvist et al. (2013) and Deloof (2013) but significantly differs from that carried out by Akoto et al. (2013) which found a significant positive relationship between the cash conversion cycle and profitability.
The coefficient of CCC^2 is found to be positively correlated with ROA and significant at 10% level, therefore providing support to Hypothesis 1a. In contrast with the previous researches (e.g. Banos-Caballero et al. (2012) and Afrifa et al. (2015)), this result suggests that the CCC and ROA have a convex relationship, hence, an optimal level of working capital was not found. Specifically, increases in the CCC worsen companies’ performance up to a “critical point”, after which, increases in the CCC improve performance. That is, the working capital and firm profitability are expected to relate negative at low levels of working capital and positively at higher levels.
Leverage is negatively correlated with the ROA, indicating that in order to maximise the
18
and a fragile market (clients might be insolvent), could lead profitable companies into bankruptcy.
Finally, Size and Tangibility do not significantly differ from 0.
Table 3 – Regression Analysis of Model 1
5.4 Analysis of the CCC Components
Table 4 below reports the results of the regression model 2 investigating the relationship between the components of the Cash Conversion Cycle and corporate performance (ROA). The coefficient of Days Inventory Outstanding (DIO) is positive and significant at 10% level, hence implying that an increase of the level of inventory generates a positive effect on profitability. High inventory can reduce the cost of possible interruptions in the production and protect the manufacturing firms from dealing with commodity price fluctuations (Mathuva D. , 2010). This result is consistent with the study carried out by Mathuva (2010) but significantly differs from that conducted by Taghizadeh et al. (2012) which found a significant negative relationship between the DIO and corporate performance.
The relationship between the Days Sales Outstanding (DSO) and Return on Assets (ROA) was found to be negative and statistically significant at 1% level, thereby implying that the faster the company collects its receivable, leading to lower investment in working capital, the higher
Variable Coefficient Probability
C(0) 0.104077 0.0000
CCC -4.95E-05 0.0448
CCC^2 1.16E-07 0.0947
SIZE -8.03E-11 0.9603
LEV -0.106153 0.0000
19
the company’s performance. Consistent with Almazari (2014) and Deloof (2003), this finding implies that companies can increase the profitability by reducing the credit period granted to their customers.
Finally, the coefficient of Days Payable Outstanding (DPO) is positive and highly significant at 1% level. This suggests that an increase of number of days of the account payable by 1 day is associated with an increase in Return on Assets by 0.0164%. Furthermore, it can be inferred from the results that Latin American companies should use the account payable trade credit as a source of financing. This result is consistent with the study carried out by Gul et al. (2013) but significantly differs from that conducted by Deloof (2003) which found a significant negative relationship between DPO and corporate performance.
Table 4 – Regression Analysis of Model 2
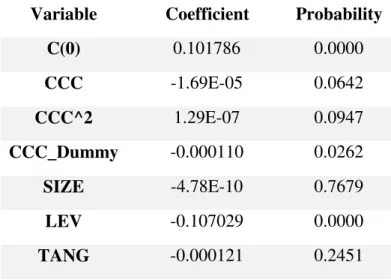
5.5 Analysis of “Small” and “Big” Companies
In order to investigate whether working capital management is more relevant in “small” or
“big” companies, a multivariate regression has been developed in Model 3. In this model, in addition to the variables previously used in Model 1, CCC_Dummy was introduced. Table 4 below gives the results of this study. The regression result shows a significant negative relationship between the new variable and ROA (p<0.05). Thus, unlike previous findings
Variable Coefficient Probability
C(0) 0.119535 0.0000
DIO 5.43E-05 0.0515
DSO -0.000189 0.0027
DPO 0.000164 0.0000
SIZE 1.54E-10 0.9239
LEV -0.001062 0.0000
20
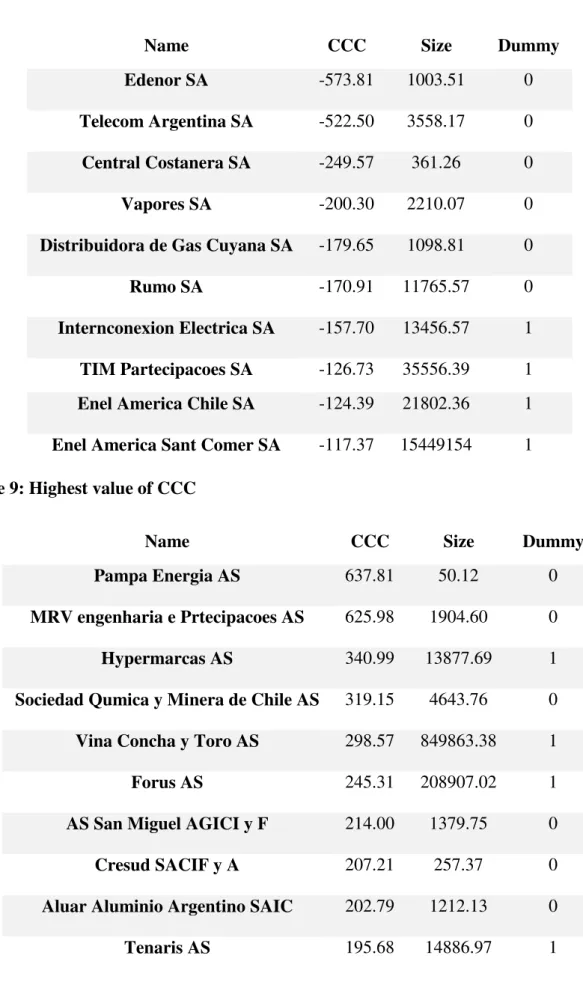
(Tauringana & Tingbani, 2015), inasmuch as the coefficient of CCC is bigger for “Big” companies, it would seem that the effect of working capital on profitability is more important in “big” firms than in “small” ones. By looking at the data set (see table 8-9 in appendix), it can be noticed that among the 10 companies with the lowest and highest level of working capital (CCC), which according to the convex relationship between CCC and ROA are the most efficient, only 40% are considered as “big” companies. This analysis supports the fact that
“small” Latin American companies are, at least on average in this sample, managing their working capital more efficiently, and therefore, the effect of working capital on profitability is more important in “big’ firms.
Table 5 – Regression Analysis of Model 3
6. Conclusions
The goal of this study was to examine the effect of working capital management (WCM) on the performance of “small” and “big” companies in Latin America. The study was based on Panel data regression analysis of the data of 117 companies distributed across all industries, except the financial one, over an eleven-year period (2005-2015). A significant negative relationship between the Cash Conversion Cycle and Return on Assets was found. This result confirms the
Variable Coefficient Probability
C(0) 0.101786 0.0000
CCC -1.69E-05 0.0642
CCC^2 1.29E-07 0.0947
CCC_Dummy -0.000110 0.0262
SIZE -4.78E-10 0.7679
LEV -0.107029 0.0000
21
idea according to which the working capital management is relevant for the company profitability and, hence, should be taken into account during the financial planning. Next, unlike previous researches, the study found out the existence of a quadratic relationship between the
Cash Conversion Cycle and Return on Assets. Specifically, the two variables have a U shape
relationship (convex) which indicates that both low and high levels of working capital are associated with a higher profitability. With regard to the WCM components, the results suggest that managers should aim at maximising the investment in inventories and account payable and minimising the account receivable. Finally, the paper provides evidence of the effect of working capital management on performance of “small” and “big” firms. It turned out that, on average,
“small” companies in Latin America manage their working capital more efficiently than “big” companies. The results seem to imply that the WCM is relatively more important for the performance of “big” firms than “small” firms.
When interpreting the results, the following limitations of this study should be taken into account. First, the analysis is limited to 117 non-financial firms from 5 different countries that met the author’s criteria. Second, the sample was divided between “small” and “big” companies without following any academic definition.
22
Bibliography
Abuzar, E. (2004). "Liquidity-Profitability Tradeoff: An empirical investigation in an emerging market". International Journal of Commerce and Management, 40-60. Afrifa, G., Tauringana, V., & Tingbani, I. (2015). "Working Capital Management and
Performance of Listed SMEs". Journal of Small Business & Entrepreneurship, Forthcoming, 25-55.
Akoto, R., Awunko-Vitor, A., & Angmor, P. (2013). "Working capital management and profitability: Evidence from Ghanaian listed manufacturing firms". Journal of Economics and International Fianance, 374-379].
Almazari, A. (2014). "The relationship between working capital management and
profitability: Evidence from Saudi Cement Companies". British Journal of Economics, Management & Trade, 146-157.
Anand, G. (2001). "Industry Related Differences in Working Capital Managment". MidAmerican Journal of Business , 11-18.
Atseye, F., Ugwu, J., & Takon, S. (2015). "Determinants of Working Capital Management". International Journal of Economics, Commerce and Management, 1-11.
Banos-Caballero, S., Garcia-Teruel, P., & Martinez-Solano, P. (2012). "How does working capital management affect profitability of Spanish SMEs?". Small Business
Economics, 517-529.
Barber , B., & Lyon, J. (1996). "Detecting abnormal operating performance: The empirical power and specification of test statistics". Journal of Financial Economics, 359-399. Baumol, W. (1952). "The Transaction Demand for Cash: An inventory theoretic approach".
The Quartely Journal of Economics , 25-30.
Blinder, &. (1991). "The resurgence of inventory research: What have we learned?". Journal of Economic Survey, 291-328.
Chiou, j., & Chen, L. (2006). "The determinants of Working Capital Management". Journal of American Accademy of Business, 149-155.
Deloof, M. (2003). "Does Working Capital Management Affect Profitability of Belgian Firms?". Journal of Business Finance & Accounting, 573-587.
Deloof, M., & Jeger, M. (1996). "Trade Credit, Product Quality, and Intragroup Trade: Some European Evidence". Financial Management, Vol. 25, No. 3, pp. 945-968.
Demirgunes , K. (2008). "The Effect of Working Capital Management on Firm Profitability: Evidence from Turkey". The International Journal of Applied Economics & Finance, 44-50.
Elizalde, C. (2003). "Working Capital Management in Latin America: The Receivables Opportunities". Citygroup.
Eljelly, A. (2004). "Liquidity - Profitability Trade Off: An Empirical Investment in an Emerging Market". International Journal of Commerce and Management, 48-61. Enqvist, J., Graham, M., & Nikkinen, J. (2013, August 30). "The impact of working capital
management on firm profitability in different business cycles: evidence from Finland".
Research in International Business and Finance, 36–49. Retrieved from
https://papers.ssrn.com/sol3/papers.cfm?abstract_id=1794802
Field, A. (2005). " Discovering statistics using SPSS". London: Sage Pubblicationa Ltd. Ghanavati, C., Mohsen, A., Mohammadreza, E., & Taghzadeh, K. (2012). "Working capital
management and corporate performance: evidence from Iranian companies". Social and Behavioral Sciences, 1313-1318.
23
Gitman , L. (1974). "Estimating corporate liquidity requirement: A simplified approach.". Finance Revision Journal, 26-35.
Gul, S., Rehman, S., Khan, M., Khan, M., Khan, M., & Khan, W. (2013). "Working capital management and perfomance sme sector". European Jorunal of Business and Management, vol.5,N0.1, 60-69.
Hassan, U., Maturi, W., & Mberia, H. (2017). "Effect of working capital management on firm's finacial performance: a survey of water processing firms in Puntland". International Journal of Economics, Commerce and Management, 479-497. Hill, M., Kelly, G., & Highlighted, M. (2010). "Net operating working capital Behavior: a
first look". Financial Management, 783-805.
Jakpar, S., Tinggi, M., Siang, T., Johari, A., Myint, K., & Sadique, M. (2017). "Working capital management and profitability: evidence from manufacturing sector in Malaysia". Journal of Business & Financial Affairs, 2-9.
Jensen, M. (1986). "Agency Costs of Free Cash Flow, Corporate Finance, and Takeovers". The American Economic Review, 323-329.
Jose, M., Lancaster, C., & Stevens, J. (1996). "Corporate returns and cash conversion cycles". Journal of Economics and Finance, 33-46.
KPMG. (2005). "Working Capital Management Survey: How do European Companies Manage their Working Capital". 2005: KPMG LLP.
Lamberson, M. (1995). "Changes in Working Capital of Small Ffirms in the Relations to Changes in Economic Activity". Mid-American Journal of Business, 45-50.
Mansoori, E., & Muhammad, J. (2012). "Determinants of working capital Management : casa of Singapore firms". Journal of Fianance and Accounting, 15-23.
Mathuva, D. (2010). "Influence of working capital components on corporate profitability: a survey on Keyan listed firms". Research Journal of Business Management, 3(1), 1-11. Mathuva, D. (2010). "Influence of working capital components on corporate profitability: a
survey on Keyan listed firms". Research Journal of Business Management, 3(1), 1-11. Mogaka, D., & Jagongo, A. (December 2013). "Working Capital Management and Firm
Profitability: Empirical Evidence from manufacturing and construction Firms Listed on Nairobi Securities exchange, Kenya". International Journal of Accounting and Taxation, Vol. 1 No. 1.
Mongrut, S., & Wong, D. (2005). "Un examen empirico de las praticas de presupuesto de capital en el Peru". Estudios Gerenciales, 95-111.
Mongrut, S., Fuenzalida, D., & Cubillas, C. (2014). "Determinants of Working Capital Management in Latin American companies". Innovar, 5-15. Retrieved from University of Barcelona: http://www.ub.edu
Myers, S., & Majluf, N. (1984). "Corporate financing and investment decisions when firms have information that investors do not have". Journal of Financial Economics, 187-221.
Nakamura, W., & Palombini, N. (2012). "Key factors in working capital management in the Brazilian market". Revista de Administração de Empresas, 1-17.
Opler, T., Pinkowitz, L., Stultz, R., & Williamson, R. (1999). "The determinants and the implications of corporate cash holdings". Journal of Finacial Economics, vol 52., no.1, pp 33-46.
Padachi, K. (2006). "Trends in working capital management and its impact on firm's performance: an analysis of Mauritian small manufacturing firms". International Review of Business Research Papers, 45-58.
24
Payne, S., & Morris, J. (2011). "Size matter in working capital. Capital agenda insights.". Ernst and Young.
Raheman, A., & Nasr, M. (2007). "Working Capital Management And Profitability – Case Of pakistani Firms". International Review of Business Research Papers, 279 - 300. Smith, k. (1987). "Trade Credit and Informational Asymettry". Journal of Finance, 863-872. Snober, D. (2014). "Effect of Working Capital Management on SME’s Performance in
Pakistan". European Journal of Business and Management, 206-220.
Tauringana, V., & Tingbani, I. (2015). "Working capital management and performance of listed SMEs". Journal of Small Business & Entrepreneurship, 557-578.
Wang, Y. (2002). "Liquidity management, operating performance and corporate value: Evidence from Japan and Taiwan.". Journal of Multinational Financial Management, 159-169.
25
Appendix
Table 3: Regression analysis of Model 1
Dependent Variable: ROA
Method: Panel Least Squares
Date: 08/15/17 Time: 14:45
Sample: 2005 2015
Periods included: 11
Cross-sections included: 115
Total panel (unbalanced) observations: 1199
Variable Coefficient Std. Error t-Statistic Prob.
CCC -4.95E-05 2.46E-05 -2.008704 0.0448
_CCC__2 1.16E-07 6.96E-08 1.672488 0.0947
SIZE -8.03E-11 1.61E-09 -0.049818 0.9603
LEV -0.106153 0.014669 -7.236530 0.0000
TANG -0.000139 0.000104 -1.338299 0.1811
DUMMY 0.014337 0.004318 3.320488 0.0009
D_2005 0.039426 0.010113 3.898396 0.0001
D_2006 0.042822 0.009863 4.341521 0.0000
D_2007 0.038860 0.009794 3.967919 0.0001
D_2008 0.046190 0.009696 4.763719 0.0000
D_2009 0.010538 0.009579 1.100200 0.2715
D_2010 0.025706 0.009572 2.685517 0.0073
D_2011 0.024547 0.009552 2.569826 0.0103
D_2012 0.002962 0.009516 0.311304 0.7556
D_2013 0.012849 0.009503 1.352169 0.1766
D_2014 0.006332 0.009504 0.666271 0.5054
C 0.104077 0.009473 10.98714 0.0000
R-squared 0.096634 Mean dependent var 0.096948
Adjusted R-squared 0.084406 S.D. dependent var 0.074422
S.E. of regression 0.071212 Akaike info criterion -2.432239
Sum squared resid 5.994065 Schwarz criterion -2.360082
Log likelihood 1475.127 Hannan-Quinn criter. -2.405057
F-statistic 7.902494 Durbin-Watson stat 0.643340
26 Table 4: Regression analysis of Model 2
Dependent Variable: ROA
Method: Panel Least Squares
Date: 08/15/17 Time: 14:52
Sample: 2005 2015
Periods included: 11
Cross-sections included: 115
Total panel (unbalanced) observations: 1201
Variable Coefficient Std. Error t-Statistic Prob.
DIO 5.43E-05 2.78E-05 1.950022 0.0514
DSO -0.000189 6.27E-05 -3.010257 0.0027
DPO 0.000164 3.65E-05 4.490335 0.0000
SIZE 1.54E-10 1.61E-09 0.095598 0.9239
LEV -0.093802 0.014688 -6.386270 0.0000
TANG -0.000187 0.000106 -1.764827 0.0779
DUMMY 0.013475 0.004353 3.095425 0.0020
D_2005 0.045253 0.010059 4.498816 0.0000
D_2006 0.045896 0.009810 4.678432 0.0000
D_2007 0.041977 0.009774 4.294907 0.0000
D_2008 0.048252 0.009669 4.990538 0.0000
D_2009 0.012848 0.009529 1.348316 0.1778
D_2010 0.028340 0.009534 2.972443 0.0030
D_2011 0.026942 0.009517 2.830949 0.0047
D_2012 0.005562 0.009480 0.586694 0.5575
D_2013 0.014916 0.009462 1.576431 0.1152
D_2014 0.007322 0.009458 0.774164 0.4390
C 0.095134 0.010982 8.662942 0.0000
R-squared 0.111086 Mean dependent var 0.097155
Adjusted R-squared 0.098312 S.D. dependent var 0.074610
S.E. of regression 0.070848 Akaike info criterion -2.441690
Sum squared resid 5.937972 Schwarz criterion -2.365390
Log likelihood 1484.235 Hannan-Quinn criter. -2.412950
F-statistic 8.696311 Durbin-Watson stat 0.662249
27 Table 5: Regression analysis of Model 3
Dependent Variable: ROA
Method: Panel Least Squares
Date: 08/15/17 Time: 14:49
Sample: 2005 2015
Periods included: 11
Cross-sections included: 115
Total panel (unbalanced) observations: 1199
Variable Coefficient Std. Error t-Statistic Prob.
CCC -1.69E-05 2.86E-05 -0.589357 0.5557
_CCC__2 1.29E-07 6.97E-08 1.852273 0.0642
CCC_DUMMY -0.000110 4.93E-05 -2.225750 0.0262
SIZE -4.78E-10 1.62E-09 -0.295205 0.7679
LEV -0.107029 0.014650 -7.305767 0.0000
TANG -0.000121 0.000104 -1.163030 0.2451
DUMMY 0.019974 0.005000 3.995203 0.0001
D_2005 0.040122 0.010101 3.971931 0.0001
D_2006 0.042866 0.009847 4.353223 0.0000
D_2007 0.038985 0.009777 3.987282 0.0001
D_2008 0.046468 0.009681 4.799958 0.0000
D_2009 0.010818 0.009563 1.131235 0.2582
D_2010 0.025724 0.009556 2.691849 0.0072
D_2011 0.024446 0.009536 2.563469 0.0105
D_2012 0.002694 0.009501 0.283534 0.7768
D_2013 0.012698 0.009487 1.338485 0.1810
D_2014 0.006288 0.009489 0.662667 0.5077
C 0.101786 0.009513 10.69997 0.0000
R-squared 0.100408 Mean dependent var 0.096948
Adjusted R-squared 0.087458 S.D. dependent var 0.074422
S.E. of regression 0.071093 Akaike info criterion -2.434757
Sum squared resid 5.969027 Schwarz criterion -2.358355
Log likelihood 1477.637 Hannan-Quinn criter. -2.405976
F-statistic 7.753931 Durbin-Watson stat 0.651040
28
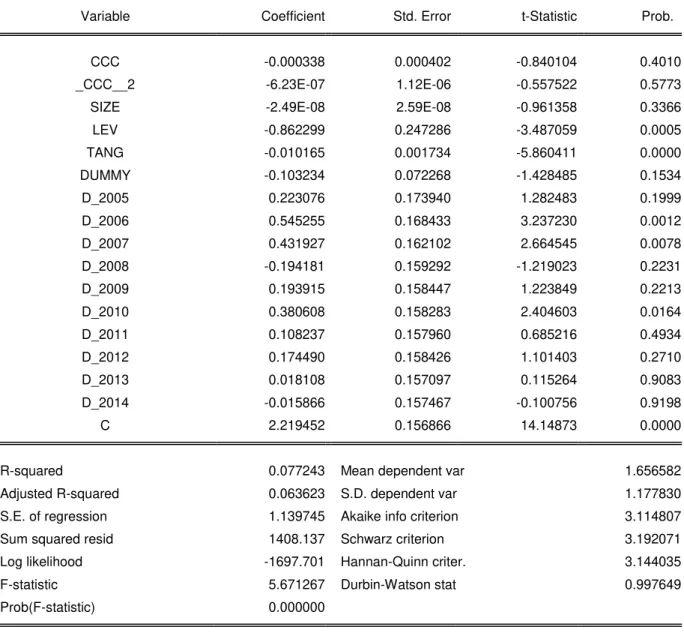
Table 6: Regression analysis of Model 1 with Tobin’s Q as a dependent variable
Dependent Variable: TOBIN_S_Q
Method: Panel Least Squares
Date: 08/30/17 Time: 11:21
Sample: 2005 2015
Periods included: 11
Cross-sections included: 115
Total panel (unbalanced) observations: 1199
Variable Coefficient Std. Error t-Statistic Prob.
CCC -0.000338 0.000402 -0.840104 0.4010
_CCC__2 -6.23E-07 1.12E-06 -0.557522 0.5773
SIZE -2.49E-08 2.59E-08 -0.961358 0.3366
LEV -0.862299 0.247286 -3.487059 0.0005
TANG -0.010165 0.001734 -5.860411 0.0000
DUMMY -0.103234 0.072268 -1.428485 0.1534
D_2005 0.223076 0.173940 1.282483 0.1999
D_2006 0.545255 0.168433 3.237230 0.0012
D_2007 0.431927 0.162102 2.664545 0.0078
D_2008 -0.194181 0.159292 -1.219023 0.2231
D_2009 0.193915 0.158447 1.223849 0.2213
D_2010 0.380608 0.158283 2.404603 0.0164
D_2011 0.108237 0.157960 0.685216 0.4934
D_2012 0.174490 0.158426 1.101403 0.2710
D_2013 0.018108 0.157097 0.115264 0.9083
D_2014 -0.015866 0.157467 -0.100756 0.9198
C 2.219452 0.156866 14.14873 0.0000
R-squared 0.077243 Mean dependent var 1.656582
Adjusted R-squared 0.063623 S.D. dependent var 1.177830
S.E. of regression 1.139745 Akaike info criterion 3.114807
Sum squared resid 1408.137 Schwarz criterion 3.192071
Log likelihood -1697.701 Hannan-Quinn criter. 3.144035
F-statistic 5.671267 Durbin-Watson stat 0.997649
29
Table 7: Regression analysis of Model 2 with Tobin’s Q as a dependent variable
Dependent Variable: TOBIN_S_Q
Method: Panel Least Squares
Date: 08/30/17 Time: 11:25
Sample: 2005 2015
Periods included: 11
Cross-sections included: 115
Total panel (unbalanced) observations: 1199
Variable Coefficient Std. Error t-Statistic Prob.
DIO 0.000440 0.000452 0.972956 0.3308
DSO -0.003885 0.001031 -3.769491 0.0002
DPO 0.000814 0.000595 1.367390 0.1718
SIZE -1.70E-08 2.58E-08 -0.657586 0.5109
LEV -0.714729 0.248369 -2.877689 0.0041
TANG -0.011300 0.001767 -6.395117 0.0000
DUMMY -0.139717 0.072998 -1.913968 0.0559
D_2005 0.242915 0.173322 1.401521 0.1613
D_2006 0.544731 0.167936 3.243675 0.0012
D_2007 0.447453 0.161681 2.767509 0.0057
D_2008 -0.189962 0.158720 -1.196832 0.2316
D_2009 0.217311 0.157522 1.379564 0.1680
D_2010 0.405194 0.157518 2.572375 0.0102
D_2011 0.129938 0.157264 0.826241 0.4088
D_2012 0.204375 0.157701 1.295964 0.1953
D_2013 0.057414 0.156400 0.367097 0.7136
D_2014 0.004775 0.156662 0.030478 0.9757
C 2.326139 0.180550 12.88364 0.0000
R-squared 0.088339 Mean dependent var 1.656582
Adjusted R-squared 0.074029 S.D. dependent var 1.177830
S.E. of regression 1.133395 Akaike info criterion 3.104525
Sum squared resid 1391.204 Schwarz criterion 3.186334
Log likelihood -1691.041 Hannan-Quinn criter. 3.135473
F-statistic 6.173061 Durbin-Watson stat 1.014869
30
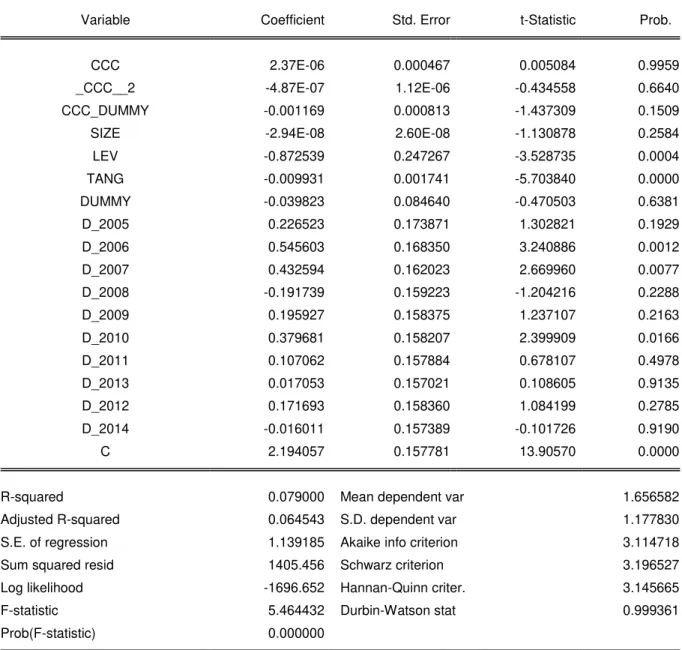
Table 8: Regression analysis of Model 3 with Tobin’s Q as a dependent variable
Dependent Variable: TOBIN_S_Q
Method: Panel Least Squares
Date: 08/30/17 Time: 11:28
Sample: 2005 2015
Periods included: 11
Cross-sections included: 115
Total panel (unbalanced) observations: 1199
Variable Coefficient Std. Error t-Statistic Prob.
CCC 2.37E-06 0.000467 0.005084 0.9959
_CCC__2 -4.87E-07 1.12E-06 -0.434558 0.6640
CCC_DUMMY -0.001169 0.000813 -1.437309 0.1509
SIZE -2.94E-08 2.60E-08 -1.130878 0.2584
LEV -0.872539 0.247267 -3.528735 0.0004
TANG -0.009931 0.001741 -5.703840 0.0000
DUMMY -0.039823 0.084640 -0.470503 0.6381
D_2005 0.226523 0.173871 1.302821 0.1929
D_2006 0.545603 0.168350 3.240886 0.0012
D_2007 0.432594 0.162023 2.669960 0.0077
D_2008 -0.191739 0.159223 -1.204216 0.2288
D_2009 0.195927 0.158375 1.237107 0.2163
D_2010 0.379681 0.158207 2.399909 0.0166
D_2011 0.107062 0.157884 0.678107 0.4978
D_2013 0.017053 0.157021 0.108605 0.9135
D_2012 0.171693 0.158360 1.084199 0.2785
D_2014 -0.016011 0.157389 -0.101726 0.9190
C 2.194057 0.157781 13.90570 0.0000
R-squared 0.079000 Mean dependent var 1.656582
Adjusted R-squared 0.064543 S.D. dependent var 1.177830
S.E. of regression 1.139185 Akaike info criterion 3.114718
Sum squared resid 1405.456 Schwarz criterion 3.196527
Log likelihood -1696.652 Hannan-Quinn criter. 3.145665
F-statistic 5.464432 Durbin-Watson stat 0.999361
31
Best CCC performance of the following companies during the period 2005-2015
Table 9: Lowest value of CCC
Table 9: Highest value of CCC
Name CCC Size Dummy
Edenor SA -573.81 1003.51 0
Telecom Argentina SA -522.50 3558.17 0 Central Costanera SA -249.57 361.26 0
Vapores SA -200.30 2210.07 0
Distribuidora de Gas Cuyana SA -179.65 1098.81 0
Rumo SA -170.91 11765.57 0
Internconexion Electrica SA -157.70 13456.57 1 TIM Partecipacoes SA -126.73 35556.39 1 Enel America Chile SA -124.39 21802.36 1 Enel America Sant Comer SA -117.37 15449154 1
Name CCC Size Dummy
Pampa Energia AS 637.81 50.12 0
MRV engenharia e Prtecipacoes AS 625.98 1904.60 0
Hypermarcas AS 340.99 13877.69 1
Sociedad Qumica y Minera de Chile AS 319.15 4643.76 0 Vina Concha y Toro AS 298.57 849863.38 1
Forus AS 245.31 208907.02 1
AS San Miguel AGICI y F 214.00 1379.75 0
Cresud SACIF y A 207.21 257.37 0
Aluar Aluminio Argentino SAIC 202.79 1212.13 0