0
A Work Project, presented as part of the requirements for the Award of a Masters Degree in Economics from the NOVA – School of Business and Economics.
IMPACT OF HEALTH CONDITIONS ON ABSENTEEISM FROM WORK
VÂNIA CARDOSO MARTA1 Student Number 427
A Project carried out on the Masters in Economics, under the supervision of: Professor Pedro Pita Barros
JUNE 2012
1
Impact of Health Conditions on Absenteeism from Work Abstract
Every year many workers fail to turn up to work due to health problems or disability. The loss of working days affects negatively individuals’ wellbeing, employers, and society in general. If on the one hand employers feel that they support most of the costs while workers are absent due to illness, on the other hand disabled employees face discrimination in labor market as employers believe that they are more likely to be absent from work. Using data from the 2005/2006 Portuguese National Health Survey, the goal of this work project is to investigate the role of health conditions on absence days reported by workers. The results, obtained from a probit model, confirm what has been found in economic literature for other countries. Disability has a positive impact on probability of absenteeism. However, in Portugal this effect is small; it amounts to a marginal increase of at most 1 day in a year.
2
1. Introduction
There are over a billion people in the world living with some form of disability and almost everyone will experience some sort of disability at some point in life. The aging of the population, the higher risk of disability in older people and the global increase in chronic health conditions such as diabetes, cardiovascular disease, cancer and mental health disorders (WHO, 2011) have made disability a matter of an increasing concern. The concept of disability is very complex and has been subject of many discussions. The World Health Organization refers to it as “…the umbrella term for impairments, activity limitations and participation restrictions, referring to the negative aspects of the interaction between an individual (with a health condition) and that individual’s
contextual factors (environmental and personal factors) (19).” (WHO, 2011: p.4).
Disability brings with it economic and social costs such as cost of health care, loss of taxes, social protection, labor market programmes, and loss productivity (WHO, 2011). Concerning the loss of productivity, among other reasons, it is caused by absenteeism; some groups of workers with disability may be more absent from work due to their health status (type and severity of their disability). And because of that, they are often discriminated by employers.
3
The aim of this study is to investigate the impact of individuals’ health status on absenteeism from work; in this regard data from 2005/2006 Portuguese National Health Survey was used. As a starting point for the analysis, it was replicated the paper "The influence of disability on absenteeism: an empirical analysis with Spanish data", by Garcia-Serrano and Malo (2008). I find in this study, with a probit model, that disability has a positive but small impact on absenteeism. However, with a negative binomial model, which allows to address the number of days absent from work, I find that disabled workers are less absent from work. Thus, with these results, labor market discrimination against disabled workers cannot be traced back to economic effects or impact. Equal treatment should be granted even if equity issues are set aside.
Thus, this work project gives a contribution on the study of the role of health on work absences reported by workers in Portugal. It is divided in 6 sections, being the first this one, which will try to address this issue the best way. Section 2 presents a brief literature review on the determinants of sickness absence. The data and methodology are described in Section 3. Section 4 contains the descriptive statistics and Section 5 presents and discusses the results. Lastly, in Section 6 is presented the final remarks.
2. Literature Review
Disabled People and the Labor Market
4
Labor market theory suggests that the employment rate of people with disabilities is lower than the employment rate of people without disabilities. According to OECD (2010), their employment rate is, on average, 44%, almost half of the one for people without disability (75%). And the unemployment rate is almost 2.5 times higher, 49% for people with disability and 20% for the ones without disability. Among disabled people employment rates vary according to the type and severity of the disability. Once employed, disabled workers face other barriers. They have much lower wages, around 15% lower than the national average (OECD, 2010). Among disabled employed workers there are differences, the incomes of disabled women are lower than the ones for disabled men. Another problem that some of them may face is the lack of access, e.g. they may not be able to bear the costs of travelling to and from work (WHO, 2011). The Determinants of Sickness Absence
There are several studies on the determinants of sickness absence and from them it is possible to identify three major groups of determinants: individual personal characteristics, firm characteristics, and job characteristics.
5
Turning to job and firm characteristics, those individuals working at public sector, larger firms, in elementary or unskilled occupations, and part-time workers are more likely to be absent from work (Black D. et al, 2011). According to Winkelmann R. (1999), those working in larger firms are predicted to have 1.8 more absent days than workers in smaller firms after wage effects are controlled for. Labriola M. et al (2006) find that sickness absence is associated with working with repetitive monotonous work, low skill discretion, low decision authority, and public employer.
Regarding the economic literature, there are limited numbers of studies on sickness absence from the workplace. Most of the studies relates the sickness absence with benefits and neglects its relation with health conditions (e.g. Ichino and Riphahn, 2004). An exception to that is the study by Bonato and Lusinyan (2004), it examines the determinants of sickness absence on a panel of 18 European countries during the period 1983–2003. Their results show that life expectancy (a proxy of good health) and low labor force participation are important determinants and they reduce sickness absence. The study by Garcia-Serrano and Malo (2008) is another exception; the paper tries to fill the gap of economic literature in the study of the impact of health and disability on absenteeism reported by workers. They use data from the European Community Household Panel for Spain covering the period 1995-2001 to examine the impact of disability on absence from workplace, concluding that workers with disability are more absent from work and the total effect of disability on absenteeism amounts to a marginal increase of 6-10 days per year.
6
most of the jobs and with the right accommodations they can be productive and less absent. Thus, employers have the challenge to build a skilled workforce that include both people with and without disabilities, to adjust their environment to be able to welcome disabled workers, to create management programmes to receive new employees and to allow the return to work of workers that became disabled, and to prepare their staff towards the non-discriminations of these workers. Governments also face many challenges when it comes to improve the access of disabled people to labor market, e.g. laws and regulations, public programmes, and changing of attitudes.
3. Data and Methodology
Data
Since 1987 there has been carried out National Health Surveys (NHSs) at regular intervals. They are designed to provide information on health status and factors that determine it for population residing in Portugal.
7
As mentioned above, the first step is the replication of the study by Garcia-Serrano and Malo (2008). However, differently to that study where they use panel data to investigate the impact of disability on absenteeism, only a cross section sample is available.
The survey includes 15 457 households, representing a total of 41 303 individuals. From the initial sample, individuals under the age of 16 (minimum age for employment), people over the age of 65 (retirement age), unemployed people, and individuals who do not respond to questions that are important for the analysis were excluded.2 Final sample is 719 observations. This population is representative of the eligible sample, there are no much differences and it can be seen in table A.1 from the annex.
Methodology
Although there are few studies correlating absenteeism with health status and disability, theoretical literature support the idea that disabled people may be more absent from work due to their health conditions.
In order to analyze the impact of disability on absenteeism from work, three main models were estimated:
Where and/or define the several possibilities.
2
8
The dependent variable Absent Days is a non-negative count variable (ranging from 0 to 14) while dependent variable Absenteeism is a dichotomous variable that takes value 0 when an individual do not report absence and 1 otherwise. They are constructed from the NHS based on individual response to the question “How many days were you absent from work (school)?” and it refers to the past two weeks.
Concerning the independent variables, Disability was built based on questions on chronic diseases. I consider as disabled individuals the ones that answered “yes” to one or more questions on chronic diseases, for example: “Do/Did you have diabetes?”.3 This definition of disability does not correspond to WHO’s definition which emphasizes the barriers that disability brings to someone’s life and that hindering their full and effective participation in society on an equal basis with others (WHO, 2011). Thus, the number of disabled people in my sample is greater than it would be because it considers as disabled people individuals whose chronic diseases are not severe enough to hinder their day to day lives. It also reduces the comparability with Garcia-Serrano and Malo (2008) study once their selection criterion for disabled people is more restrictive. The independent variables Visits to Any Doctor and Visits to Emergency Services or Maternity are control variables for health status and will be used in interaction with Disability. They are generated from individuals’ answers to the following questions: “In the past three months, how many times did you visit a doctor?” and “Which doctor did you visit?” and “Where was the appointment?”, respectively.
The survey has a question that assesses the individuals’ general perception of their physical and psychological health. The response to the question “How do you perceive
3
9
your health in general?” ranged from 1 (very good) to 5 (very bad) and is used as a measure of subjective health status. Self-rated health is one of the most simple and widely used measures of perceived health. There are evidences that it is an important predictor of future disability and health problems. So, it is reasonable to believe that there is an association between poor subjective health and disability i.e. that the predictors of subjective health and disability are likely to be similar. The variable Bad Health can help characterize the information given by the disability measure. And for the econometric analysis, it is dichotomized, taking value 1 if the individual answered bad or very bad and value 0 otherwise.
Regarding the other independent variables, the first group concerns Personal Characteristics and includes individuals’ age, gender, marital status, educational level attained, and immigration status and years of residence. The variables on migration were generated based on a Human Development Research Paper by Barros et al (2009). There were considered eight variables that correspond to eight different groups of immigrants (based on country of origin) and one variable that corresponds to the number of years individuals reside in Portugal. Individuals from Brazil, other Latin American and Caribbean country, and Other Countries (individuals not included in other categories) were excluded from the estimations because they were not enough to allow the identification of the effect.
10
Extraterritorial Organizations and Bodies, and Armed Force were excluded from the estimations since they were not enough to allow the identification of the effect. Agriculture industry was also excluded from the estimation due to its strong correlation (0.85) with variable Skilled Agricultural and Fishery Workers (occupation).
The third group presents the Job Characteristics and covers the type of occupation, job category (if an individual is self-employed or not), and the working hours. The variables on type of occupation were built on the basis of International Standard Classification of Occupations (ISCO-88) by International Labor Organization. An additional variable, income, was included in the analysis. Income was built on the basis of OECD equivalence scales; It was used the square root scale which divides household income by the square root of household size. Since in the NHS the monthly household income was divided into ten classes, a small transformation was performed so to use that information. It was considered for the calculations the midpoint of each class and once the last class had not a maximum point, 3500€ was considered its midpoint.4
The three models aim to provide a better understanding of the contribution of disability on the probability of absenteeism/number of absent days from work. The models, besides the variable disability and control variables for personal, job, and firm characteristics, have control variables for health status that are included in the estimations in interaction with the disability measure. The reason for including these
4 I also tried to include another variable, years of schooling, but due to its strong correlation with educational levels (University and Primary or no studies) it was excluded from in the econometric
11
variables is that sickness episodes can happen to everybody. Since not all disabled workers visited a doctor, or visited an emergency service or maternity or considered their health status as bad or very bad, not all non-disabled workers did not visit a doctor, or visit an emergency service/maternity or considered their health status as good or very good. It is also important to call attention to the fact that these variables only appear in interaction with disability. This is because the effects of each variable alone are included in the vector of personal characteristics, and then excluded from the estimations due to lack of contribution of explanatory power.
As said before, the dependent variable, absenteeism, is a dichotomous variable that takes value 0 when an individual do not report absence and 1 otherwise and absent days is a non-negative count variable (ranging from 0 to 14). Therefore, in the econometric procedure I use a Probit Model and a Negative Binomial Model to estimate the impact of disability on probability of absenteeism and on the number of absence days respectively.
The coefficients from the probit model indicate the sign of the impact of disability and other explanatory variables on absenteeism. But they cannot be mistaken as the real impact of each explanatory variable on probability of absenteeism. Thus, it will be presented the marginal effects which provide more interesting information.
The Negative Binomial Model is also used since its results allow knowing the average days of absence for each group of individuals.
4. Descriptive Statistics
12
ones with and without disability. The individuals were splitted into these groups to avoid possible correlations between absenteeism and other variables.
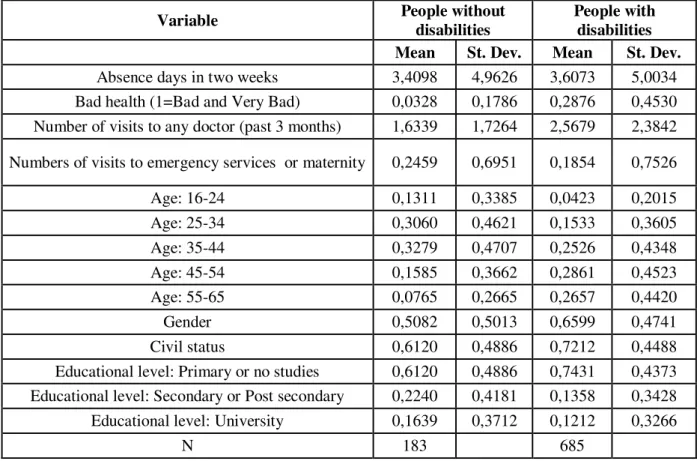
From the table we can see that, contrarily to what one might expect, the mean of absent days for people with and without disabilities is more or less the same (about 3.5 days). Compared to the Spanish case where the means are 3.41 and 5.34 (absence days per month) for non-disabled and disabled people respectively, these numbers are large. This is mostly justified by the fact that our time frame is quite short, so there is a considerable number of individuals that answered 14 (days absent), pulling up the means. However, if we exclude those individuals, the number of absent days is much closer to the Spanish one (see table A.3 from the annex).
Table 1. Descriptive Statistics. Portuguese NHS 2005/2006.
Variable People without
disabilities
People with disabilities
Mean St. Dev. Mean St. Dev.
Absence days in two weeks 3,4098 4,9626 3,6073 5,0034 Bad health (1=Bad and Very Bad) 0,0328 0,1786 0,2876 0,4530 Number of visits to any doctor (past 3 months) 1,6339 1,7264 2,5679 2,3842
Numbers of visits to emergency services or maternity 0,2459 0,6951 0,1854 0,7526
Age: 16-24 0,1311 0,3385 0,0423 0,2015
Age: 25-34 0,3060 0,4621 0,1533 0,3605
Age: 35-44 0,3279 0,4707 0,2526 0,4348
Age: 45-54 0,1585 0,3662 0,2861 0,4523
Age: 55-65 0,0765 0,2665 0,2657 0,4420
Gender 0,5082 0,5013 0,6599 0,4741
Civil status 0,6120 0,4886 0,7212 0,4488 Educational level: Primary or no studies 0,6120 0,4886 0,7431 0,4373 Educational level: Secondary or Post secondary 0,2240 0,4181 0,1358 0,3428 Educational level: University 0,1639 0,3712 0,1212 0,3266
N 183 685
13
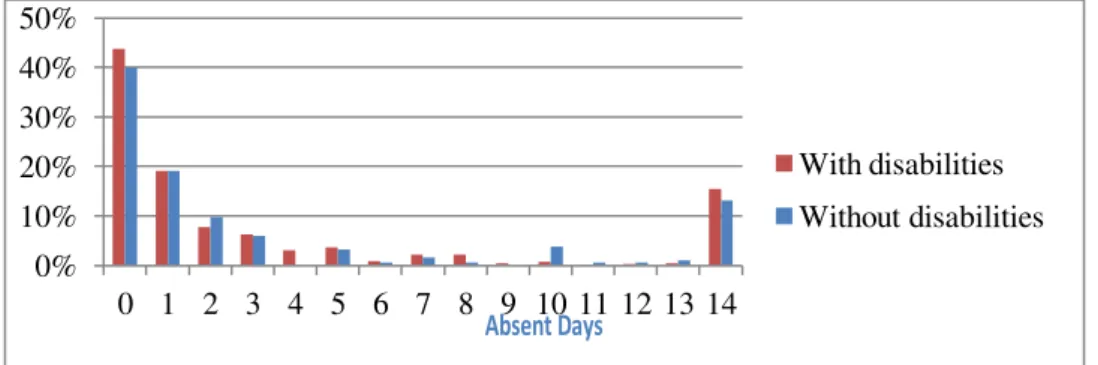
Graphic 1. Distribution of absenteeism by disability status. Portuguese NHS 2005/2006.
The responses are concentrated in zero, one, and fourteen days, over half of the individuals responded zero or one in both groups. Over 10% of individuals on both groups were absent fourteen days; as said above this is due to the fact that responses are confined to two weeks recall time. Thereby the data is somewhat skewed.
So far, there is no evidence that disability is related with absenteeism. Disabled people differ in type and severity of their disability and this may be one of the reason why there are not much differences between the two groups (disabled and non-disabled people), in my sample, concerning absenteeism.
Back to Table 1, as expected, people with disability went to a doctor more times (3 times) than people without disability (2 times) in past 3 months. The correlation between absent days and visits to any doctor is positive and statistically significant, but not strong (0.2). Regarding subjective health status, 30% of disabled people reported bad or very bad health status, while only 3% of people without disability reported bad or very bad health status. This result was expected since it is reasonable to believe that there is an association between disability and poor health status. The empirical analysis includes a proxy of objective health status that is the numbers of visits to emergency services or maternity, the objective of this variable is to capture the bad health periods. However, the results are a bit different from the expected; the mean of the visits is zero for both groups. From the table we can also see that individuals with disabilities have
0% 10% 20% 30% 40% 50%
0 1 2 3 4 5 6 7 8 9 10 11 12 13 14
With disabilities Without disabilities
14
lower educational level, 74% of them have primary or no studies; and have lower wages, 7% lower than the wages of non-disabled people.
Finally, one can notice that the number of disabled individuals is larger than the number of non-disabled individuals. This is due to the broad definition of disability that is applied in this study.
5. Discussion of Results
In order to have better estimates of the impact of disability on absenteeism/days absent, people that reported 14 days of absence were excluded from the estimations. Table 2 presents the results of the three models. It reports the marginal effects of disability variable and the interactions of disability with subjective health status, visits to any doctor, and visits to the emergency or maternity on absenteeism. Besides these variables, the models also include controls for individual, job, and firm characteristics, and an additional variable on income. A summary of marginal effects5 and regression coefficients for model 1 are reported in table 4 (version 3).
Table 2. Average marginal effects of disability variables on probability of absenteeism
estimated from Probit models. Portuguese NHS 2005/2006.
Disability Bad
Health*Disability
Visits to any doctor*Disability
Visits to the emergency*Disability
Modelo 1 0,030 0,030
Modelo 2 0,007 0,011 0,012
Modelo 3 0,023 0,030 0,043
Considering the literature review, in all different specifications, disability presents the expected signs. Although not statistically significant and small, disability coefficients are positive which indicates that disabled workers have higher probability of being
5
15
absent from work. The effect of disability on absenteeism amounts to a marginal increase of at most 16 day in a year. These results may be reflecting the fact that disabled people are different in type and severity of their disabilities and some people are included in the disabled group when their disabilities do not affect their day to day lives. Regarding the interaction of disability with other variables, which are aimed to catch health problems, they also have the expected impact. One can notice that the interaction of disability with bad health has the same or higher impact on probability of absenteeism than disability. Workers who report bad or very bad health status have at most 3% higher probability of being absent from work in two weeks. This is reflecting what was said, that self-rated health is an important predictor of disability and health problems. Although the estimate result is very small and not statistically significant, the coefficient of the interactions of disability with visits to any doctor has the expected sign. Workers with a disability that visit a doctor have 1% higher probability of absenteeism. The small impact may be justified by the fact that in the data used there is not a big difference in the number of visits to a doctor between disabled and non-disabled people. A stronger impact can be seen when looking at the interaction of disability with visits to emergency services or maternity. Disabled workers that visit emergency services or maternity are 1 day per year more absent than non-disabled ones. The predicted probabilities of absenteeism for both groups of workers are presented in table 3 for a better understanding of the joint effect of disability for people with and without disability. It displays the means, standard deviations, minima and maxima for the three probit models.
6
16
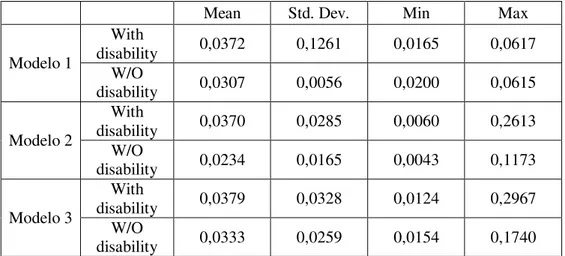
The predicted probabilities were obtained by computing the average marginal effects after probit. When using average marginal effect, a marginal effect is computed for each individual, and then all the computed effects are averaged. Hence, the marginal effects for absenteeism (a categorical variable) show how P (absenteeism=1) changes as disability (also a categorical variable) changes from 0 to 1 holding all other variables equals, i.e.:
Table 3. Predicted average effect of disability on probability of absenteeism
Mean Std. Dev. Min Max
Modelo 1
With
disability 0,0372 0,1261 0,0165 0,0617 W/O
disability 0,0307 0,0056 0,0200 0,0615
Modelo 2
With
disability 0,0370 0,0285 0,0060 0,2613 W/O
disability 0,0234 0,0165 0,0043 0,1173
Modelo 3
With
disability 0,0379 0,0328 0,0124 0,2967 W/O
disability 0,0333 0,0259 0,0154 0,1740
From the table, one can see that there are no much differences in results between people with and without disabilities and between the three models. We predict that both groups of individuals increase their probability of being absent when going from a situation of non-disability to a disability situation. Although positive, it is important to point out that the impact of disability on probability of absenteeism is lower than we would expect (3% increase for non-disabled people and 4% increase for disabled people).
17
different story when comparing to the ones in Garcia-Serrano and Malo (2008), where disability has a marginal impact on absenteeism of 6-10 days.
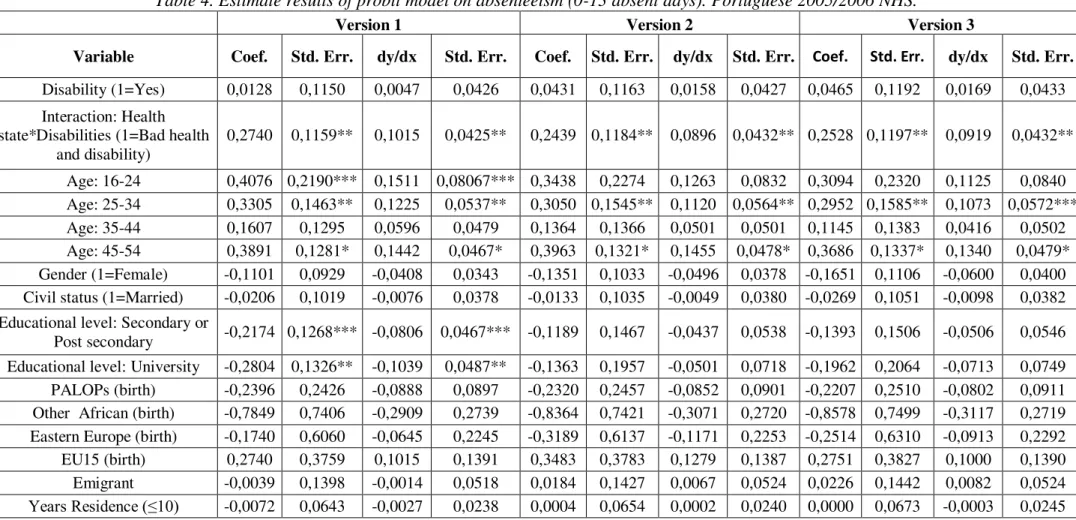
Table 4 below shows the estimated results for 3 versions of model 1 so one can see the changes of the variables on personal, job, and firm characteristics, and on migration and income (full estimates are presented in table A.4 from the annex). Concerning individuals’ age, it can be seen that there is a positive correlation between age and
18
Table 4. Estimate results of probit model on absenteeism (0-13 absent days). Portuguese 2005/2006 NHS.
Version 1 Version 2 Version 3
Variable Coef. Std. Err. dy/dx Std. Err. Coef. Std. Err. dy/dx Std. Err. Coef. Std. Err. dy/dx Std. Err.
Disability (1=Yes) 0,0128 0,1150 0,0047 0,0426 0,0431 0,1163 0,0158 0,0427 0,0465 0,1192 0,0169 0,0433 Interaction: Health
state*Disabilities (1=Bad health and disability)
0,2740 0,1159** 0,1015 0,0425** 0,2439 0,1184** 0,0896 0,0432** 0,2528 0,1197** 0,0919 0,0432**
Age: 16-24 0,4076 0,2190*** 0,1511 0,08067*** 0,3438 0,2274 0,1263 0,0832 0,3094 0,2320 0,1125 0,0840 Age: 25-34 0,3305 0,1463** 0,1225 0,0537** 0,3050 0,1545** 0,1120 0,0564** 0,2952 0,1585** 0,1073 0,0572*** Age: 35-44 0,1607 0,1295 0,0596 0,0479 0,1364 0,1366 0,0501 0,0501 0,1145 0,1383 0,0416 0,0502 Age: 45-54 0,3891 0,1281* 0,1442 0,0467* 0,3963 0,1321* 0,1455 0,0478* 0,3686 0,1337* 0,1340 0,0479* Gender (1=Female) -0,1101 0,0929 -0,0408 0,0343 -0,1351 0,1033 -0,0496 0,0378 -0,1651 0,1106 -0,0600 0,0400 Civil status (1=Married) -0,0206 0,1019 -0,0076 0,0378 -0,0133 0,1035 -0,0049 0,0380 -0,0269 0,1051 -0,0098 0,0382 Educational level: Secondary or
Post secondary -0,2174 0,1268*** -0,0806 0,0467*** -0,1189 0,1467 -0,0437 0,0538 -0,1393 0,1506 -0,0506 0,0546 Educational level: University -0,2804 0,1326** -0,1039 0,0487** -0,1363 0,1957 -0,0501 0,0718 -0,1962 0,2064 -0,0713 0,0749 PALOPs (birth) -0,2396 0,2426 -0,0888 0,0897 -0,2320 0,2457 -0,0852 0,0901 -0,2207 0,2510 -0,0802 0,0911 Other African (birth) -0,7849 0,7406 -0,2909 0,2739 -0,8364 0,7421 -0,3071 0,2720 -0,8578 0,7499 -0,3117 0,2719 Eastern Europe (birth) -0,1740 0,6060 -0,0645 0,2245 -0,3189 0,6137 -0,1171 0,2253 -0,2514 0,6310 -0,0913 0,2292 EU15 (birth) 0,2740 0,3759 0,1015 0,1391 0,3483 0,3783 0,1279 0,1387 0,2751 0,3827 0,1000 0,1390 Emigrant -0,0039 0,1398 -0,0014 0,0518 0,0184 0,1427 0,0067 0,0524 0,0226 0,1442 0,0082 0,0524
Years Residence (≤10) -0,0072 0,0643 -0,0027 0,0238 0,0004 0,0654 0,0002 0,0240 0,0000 0,0673 -0,0003 0,0245
19
The estimations for the Negative Binomial model are presented below. From this model we can have the impact of each variable on the number of absent days and also the predicted number of absent days for each group. Table 5 presents the coefficients of the marginal effects of the main variables on the number of absent days for the three different specifications. The average marginal effects are generated on the same basis as the ones for the probit model.
Table 5. Average marginal effects of disability variables on number of absence days
estimated from Negative Binomial models. Portuguese NHS 2005/2006.
Disability Bad
Health*Disability
Visits to any doctor*Disability
Visits to the emergency*Disability
Modelo 1 -0,288 0,049
Modelo 2 -0,4912 -0,1208 0,0995
Modelo 3 -0,347 0,0413 0,2497
Differently to the expected, given the above results, disability has a negative impact on absent days. All disability coefficients are negative, but not statistically significant, which means that non-disabled individuals are more absent from work than disabled individuals. And the marginal effect amounts to 7-11 days less absent.
20
Table 6, below, presents the predicted number of absent days for both disabled and non-disabled people. The results were obtained from the average marginal effects computed after negative binomial. The marginal effects for absent days show how the number of absent days (a continuous variable) changes as disability (a categorical variable) changes from 0 to 1 holding all other variables equals, i.e.:
Table 6. Predicted number of absent days.
Mean Std. Dev. Min Max
Modelo 1 With disability -0,2957 0,1266 -0,7327 -0,0518
W/O disability -0,2701 0,1022 -0,6578 -0,0595
Modelo 2 With disability -0,2869 0,2962 -1,3714 1,5808
W/O disability -0,3128 0,1837 -0,7812 0,5185
Modelo 3 With disability -0,2789 0,3714 -0,8135 3,3479
W/O disability -0,2542 0,2259 -0,7682 1,2493
By looking at the table it becomes clear that non-disabled people are more absent from work than disabled people. If a person goes from a disability to a non-disability situation, he/she increases the number of absent days by 7 days in a year. However, if a person goes from a non-disability to a disability situation, he/she is 7 days less absent per year. This is different from the results we got from the descriptive statistics and probit models. One explanation for that are the ones who reported 10 days of absence which can be long-term absence, like the ones who reported 14 days but were excluded from the estimations to not excessively skew the results.
21
quantitatively more important. That is, the absence of effects should be read as saying that in the short-term absence there is little difference between the two groups, since nothing can be said about long-term absenteeism.
Part of the estimations of the three versions of model 1 is presented below in table 7 (full estimations can be found in annex – table A. 5). Control variables were added to the models to allow the visualization of changes in coefficients and significance levels. Confirming the results obtained in probit models, women report higher absenteeism in versions 2 and 3. In turn, people with higher educational level display lower number of absent days. People born in PALOPs and in other African countries (different from PALOPs) exhibit lower levels of absenteeism while people born in Eastern Europe countries exhibit higher levels. In versions 1 and 2 emigrants still exhibit higher absenteeism levels, confirming the results from probit. People with longer years of residence are 12 days (in a year) more absent from workplace which contradicts the result obtained with probit model where those people are less absent.
22
Table 7. Estimate results of Negative Binomial model on absenteeism (0-13 absent days). Portuguese 2005/2006 NHS.
Version 1 Version 2 Version 3
Variable Coef. Std. Err. dy/dx Std. Err. Coef. Std. Err. dy/dx Std. Err. Coef. Std.
Err. dy/dx Std. Err.
Disability (1=Yes) -0,157 0,145 -0,560 0,520 -0,179 0,147 -0,640 0,529 -0,178 0,150 -0,640 0,540 Interaction: Health
state*Disabilities (1=Bad health and disability)
0,447 0,139* 0,159 0,517* 0,477 0,140* 0,171 0,527* 0,527 0,142* 1,890 0,540*
Age: 16-24 -0,334 0,276 -0,119 0,990 -0,455 0,287 -0,163 0,104 -0,307 0,289 -1,101 1,040 Age: 25-34 0,114 0,182 0,405 0,648 0,016 0,189 0,057 0,676 0,062 0,192 0,224 0,690 Age: 35-44 -0,003 0,162 -0,010 0,578 -0,086 0,170 -0,309 0,609 -0,054 0,170 -0,194 0,610 Age: 45-54 0,234 0,155 0,833 0,558 0,178 0,159 0,638 0,571 0,204 0,159 0,731 0,573 Gender (1=Female) -0,041 0,117 -0,145 0,418 0,013 0,130 0,045 0,464 -0,035 0,144 -0,125 0,516 Civil status (1=Married) 0,102 0,126 0,363 0,452 0,094 0,128 0,335 0,459 0,071 0,128 0,254 0,460 Educational level: Secondary or
Post secondary -0,197 0,158 -0,703 0,565 -0,206 0,178 -0,736 0,643 -0,230 0,185 -0,826 0,670 Educational level: University -0,279 0,167*** -0,995 0,604*** -0,484 0,251*** -0,173 0,914*** -0,635 0,274** -2,277 1,007**
PALOPs (birth) -0,276 0,317 -0,983 1,132 -0,309 0,318 -0,110 0,114 -0,115 0,318 -0,412 0,114 Other African (birth) -1,191 1,042 -0,424 0,373 -0,908 1,055 -0,325 0,378 -0,746 1,051 -2,672 3,770 Eastern Europe (birth) 0,949 0,794 0,338 0,284 0,826 0,797 0,296 0,286 0,924 0,791 3,311 2,846 EU15 (birth) -0,058 0,438 -0,208 0,156 0,044 0,446 0,158 0,160 0,152 0,447 0,545 1,605 Emigrant -0,061 0,173 -0,218 0,618 -0,021 0,174 -0,075 0,624 0,024 0,174 0,086 0,625
23
Using Negative Binomial models I have also estimated the predicted number of absent days for those individuals, from both groups, who were absent. Results are presented below.
Table 8. Predicted number of absent days (for those who have absenteeism.) Mean Std. Dev. Min Max
Modelo 1
With
disability -0,9283 0,3039 -2,0762 -0,3156 W/O
disability -0,7785 0,2598 -1,5627 -0,3184
Modelo 2
With
disability -0,9186 0,3406 -2,0689 0,1473 W/O
disability -0,7999 0,2520 -1,5338 -0,3553
Modelo 3
With
disability -0,9157 0,4059 -1,9381 1,3881 W/O
disability -0,7633 0,3294 -1,6498 0,3596
While the predicted number of absent days for disabled individuals who were absent increases by 21 days in a year if they change to a non-disability situation. The predicted number of absent days for non-disabled ones decreases by 18 days per year if they change to a disability situation.
6. Final Remarks
Absenteeism from work is a terrible scourge in Europe. Portugal has one of the highest absence rates in Europe with serious socio-economic costs. A great part of this absenteeism is justified by workers health problems. Every year, sickness absence costs millions to the economy and society in general mainly in lost output. However, this issue has been overlooked in economic literature. Thus, the present work project intended to give a contribution on the study of the role of health on work absences reported by workers in Portugal.
24
negative binomial model, they suggested that non-disabled workers are 7-11 days more absent per year than disabled workers. Additionally, workers with disabilities who visit the emergency services or maternity are 6 days more absent in a year while disabled workers who visit a doctor are 2 days more absent.
The outcomes are different and do not allow me to fully support the suggested in literature about impact of health conditions on absenteeism and about disabled individuals in labor market. Those tells us that people with disability may be more absent from work due to their condition and suggest discrimination from the employers’ side due to concerns about disabled workers’ productivity and qualification.
Based on the results of this study, labor market discrimination against disabled workers cannot be traced back to economic effects or impact. Equal treatment should be granted even if equity issues are set aside. So, Governments still have to improve the access of disabled people to labor market throughlaws and regulations, public programmes, and changing of attitudes.
25
26
Annex A
Tables
Table A.1
Descriptive Statistics (26477 obsevations). Portuguese NHS 2005/2006.
Variable People without
disabilities
People with disabilities
Mean St. Dev. Mean St. Dev.
Age: 16-24 0,27486 0,44646 0,08833 0,28378 Age: 25-34 0,25210 0,43424 0,12238 0,32773 Age: 35-44 0,23287 0,42268 0,20309 0,40231 Age: 45-54 0,15851 0,36523 0,26876 0,44333 Age: 55-65 0,08166 0,27386 0,31744 0,46550 Gender 0,44384 0,49686 0,56166 0,49620 Civil status 0,50936 0,49993 0,69125 0,46199 Educational level: Primary or no studies 0,63155 0,48241 0,77466 0,41782 Educational level: Secondary or Post secondary 0,22523 0,41775 0,11907 0,32389 Educational level: University 0,14323 0,35032 0,10626 0,30819
27 Table A.2
Descriptive Statistics (0-14 days absent). Portuguese NHS 2005/2006.
Variable People without
disabilities
People with disabilities
Mean St. Dev. Mean St. Dev.
Absence days in two weeks 3,4098 4,9626 3,6073 5,0034 Bad health (1=Bad and Very Bad) 0,0328 0,1786 0,2876 0,4530 Number of visits to any doctor (past 3 months) 1,6339 1,7264 2,5679 2,3842
Numbers of visits to emergency services or
maternity 0,2459 0,6951 0,1854 0,7526
Age: 16-24 0,1311 0,3385 0,0423 0,2015
Age: 25-34 0,3060 0,4621 0,1533 0,3605
Age: 35-44 0,3279 0,4707 0,2526 0,4348
Age: 45-54 0,1585 0,3662 0,2861 0,4523
Age: 55-65 0,0765 0,2665 0,2657 0,4420
Gender 0,5082 0,5013 0,6599 0,4741
Civil status 0,6120 0,4886 0,7212 0,4488 Educational level: Primary or no studies 0,6120 0,4886 0,7431 0,4373 Educational level: Secondary or Post secondary 0,2240 0,4181 0,1358 0,3428 Educational level: University 0,1639 0,3712 0,1212 0,3266
Armed Force 0,0055 0,0739 0,0000 0,0000
Legislators, Senior Officials and Managers 0,0164 0,1273 0,0672 0,2505 Professionals 0,0984 0,2986 0,0774 0,2674 Technicians and Associate Professionals 0,0601 0,2383 0,0380 0,1912 Office Clerks 0,1311 0,3385 0,1051 0,3069 Service Workers and Shop and Market Sales
Workers 0,1858 0,3900 0,1679 0,3740
Skilled Agricultural and Fishery Workers 0,0820 0,2751 0,1504 0,3577 Craft and Related Trades Workers 0,2514 0,4350 0,1577 0,3647 Plant and Machine Operators and Assemblers 0,0383 0,1923 0,0438 0,2048 Elementary Occupations 0,1038 0,3059 0,1693 0,3753 Working hours (per week) 40,1257 8,0213 41,1985 14,6703
Self employed 0,1366 0,3444 0,2818 0,4502 Institutional sector (1=Private firm) 0,8087 0,3944 0,8088 0,3936 Income 1.081,9310 852,3350 1.012,1980 812,1658 Agriculture 0,0601 0,2383 0,1460 0,3533
Fishing 0,0109 0,1043 0,0058 0,0762
28 Cont. Table A.2
Variable People without
disabilities
People with disabilities
Mean St. Dev. Mean St. Dev.
Wholesale and retail trade; repair of motor vehicles,
motorcycles and personal and household goods 0,1967 0,3986 0,1460 0,3533 Hotels and Restaurants 0,0765 0,2665 0,0788 0,2697 Transport, storage and communications 0,0328 0,1786 0,0248 0,1557 Financial intermediation 0,0000 0,0000 0,0263 0,1601 Real estate, renting and business activities 0,0328 0,1786 0,0219 0,1465 Public administration and defense; compulsory social
security 0,0656 0,2482 0,0774 0,2674
Education 0,1093 0,3129 0,1080 0,3106
Health and social work 0,0601 0,2383 0,0526 0,2233 Other community, social and personal service
activities 0,0437 0,2050 0,0584 0,2347
Activities of private households as employers and undifferentiated production activities of private
households
0,0383 0,1923 0,0569 0,2319
Extraterritorial organizations and bodies 0,0000 0,0000 0,0015 0,0382 Portugal (birth) 0,8798 0,3261 0,9372 0,2427 PALOPs (birth) 0,0492 0,2168 0,0350 0,1840 Other African (birth) 0,0109 0,1043 0,0015 0,0382 Brazil (birth) 0,0109 0,1043 0,0000 0,0000 Other Lac (birth) 0,0109 0,1043 0,0000 0,0000 Eastern Europe (birth) 0,0164 0,1273 0,0058 0,0762 EU15 (birth) 0,0109 0,1043 0,0175 0,1313 Other Countries (birth) 0,0000 0,0000 0,0015 0,0382
Emigrant 0,0765 0,2665 0,1241 0,3299
Years Residence (≤10) 9,7924 1,0693 9,8964 0,8197
29 Table A.3
Descriptive Statistics (0-13 absent days). Portuguese NHS 2005/2006.
Variable People without
disabilities
People with disabilities
Mean St. Dev. Mean St. Dev.
Absence days in two weeks 1,8113 2,9600 1,7047 2,4882 Bad health (1=Bad and Very Bad) 0,0314 0,1751 0,2522 0,4346 Number of visits to any doctor (past 3 months) 1,4088 1,4374 2,3592 2,3424
Numbers of visits to emergency services or
maternity 0,2516 0,7201 0,1934 0,7830
Age: 16-24 0,1447 0,3529 0,0484 0,2147
Age: 25-34 0,3019 0,4605 0,1589 0,3659
Age: 35-44 0,3333 0,4729 0,2504 0,4336
Age: 45-54 0,1384 0,3464 0,2763 0,4476
Age: 55-65 0,0818 0,2749 0,2660 0,4422
Gender 0,5346 0,5004 0,6684 0,4712
Civil status 0,6038 0,4907 0,7081 0,4550 Educational level: Primary or no studies 0,5849 0,4943 0,7409 0,4385 Educational level: Secondary or Post secondary 0,2390 0,4278 0,1364 0,3436 Educational level: University 0,1761 0,3821 0,1226 0,3283
Armed Force 0,0063 0,0793 0,0000 0,0000
Legislators, Senior Officials and Managers 0,0189 0,1365 0,0639 0,2448 Professionals 0,0943 0,2932 0,0794 0,2707 Technicians and Associate Professionals 0,0629 0,2435 0,0363 0,1871 Office Clerks 0,1384 0,3464 0,1088 0,3117 Service Workers and Shop and Market Sales
Workers 0,2075 0,4068 0,1762 0,3813
Skilled Agricultural and Fishery Workers 0,0755 0,2650 0,1554 0,3626 Craft and Related Trades Workers 0,2264 0,4198 0,1537 0,3610 Plant and Machine Operators and Assemblers 0,0440 0,2058 0,0380 0,1914 Elementary Occupations 0,0943 0,2932 0,1693 0,3753 Working hours (per week) 39,8931 7,9401 41,1865 15,1018
Self employed 0,1447 0,3529 0,2902 0,4542 Institutional sector (1=Private firm) 0,8113 0,3925 0,8238 0,3813 Income 1.112,8610 869,3728 1.014,5980 834,3078 Agriculture 0,0566 0,2318 0,1485 0,3559
Fishing 0,0063 0,0793 0,0052 0,0719
30 Cont. Table A.3
Variable People without
disabilities
People with disabilities
Mean St. Dev. Mean St. Dev.
Wholesale and retail trade; repair of motor vehicles,
motorcycles and personal and household goods 0,2075 0,4068 0,1554 0,3626 Hotels and Restaurants 0,0881 0,2843 0,0829 0,2760 Transport, storage and communications 0,0377 0,1912 0,0225 0,1483 Financial intermediation 0,0000 0,0000 0,0259 0,1590 Real estate, renting and business activities 0,0377 0,1912 0,0242 0,1537 Public administration and defense; compulsory social
security 0,0692 0,2546 0,0777 0,2680
Education 0,1132 0,3178 0,1002 0,3005
Health and social work 0,0629 0,2435 0,0518 0,2218 Other community, social and personal service
activities 0,0440 0,2058 0,0553 0,2287
Activities of private households as employers and undifferentiated production activities of private
households
0,0440 0,2058 0,0604 0,2385
Extraterritorial organizations and bodies 0,0000 0,0000 0,0017 0,0416 Portugal (birth) 0,8805 0,3254 0,9344 0,2478 PALOPs (birth) 0,0503 0,2193 0,0380 0,1914 Other African (birth) 0,0126 0,1118 0,0017 0,0416 Brazil (birth) 0,0063 0,0793 0,0000 0,0000 Other Lac (birth) 0,0126 0,1118 0,0000 0,0000 Eastern Europe (birth) 0,0126 0,1118 0,0069 0,0829 EU15 (birth) 0,0126 0,1118 0,0155 0,1238 Other Countries (birth) 0,0000 0,0000 0,0017 0,0416
Emigrant 0,0755 0,2650 0,1244 0,3303
Years Residence (≤10) 9,7925 1,0796 9,8774 0,8904
31 Table A.4
Estimate results of probit model on absenteeism (0-13 absent days). Portuguese 2005/2006 NHS
Version 1 Version 2 Version 3
Variable Coef. Std. Err. dy/dx Std. Err. Coef. Std.
Err. dy/dx
Std.
Err. Coef.
Std.
Err. dy/dx Std. Err.
Disability (1=Yes) 0,013 0,115 0,005 0,043 0,043 0,116 0,016 0,043 0,047 0,119 0,017 0,043 Interaction: Health
state*Disabilities (1=Bad health and disability)
0,274 0,116** 0,102 0,043** 0,244 0,118** 0,090 0,043** 0,253 0,120** 0,092 0,043**
Age: 16-24 0,408 0,219*** 0,151 0,081*** 0,344 0,227 0,126 0,083 0,309 0,232 0,112 0,084 Age: 25-34 0,330 0,146** 0,122 0,054** 0,305 0,155** 0,112 0,056** 0,295 0,159** 0,107 0,057*** Age: 35-44 0,161 0,130 0,060 0,048 0,136 0,137 0,050 0,050 0,114 0,138 0,042 0,050 Age: 45-54 0,389 0,128* 0,144 0,047* 0,396 0,132* 0,146 0,048* 0,369 0,134* 0,134 0,048* Gender (1=Female) -0,110 0,093 -0,041 0,034 -0,135 0,103 -0,050 0,038 -0,165 0,111 -0,060 0,040 Civil status (1=Married) -0,021 0,102 -0,008 0,038 -0,013 0,104 -0,005 0,038 -0,027 0,105 -0,010 0,038 Educational level: Secondary or
Post secondary -0,217 0,127*** -0,081 0,047*** -0,119 0,147 -0,044 0,054 -0,139 0,151 -0,051 0,055 Educational level: University -0,280 0,133** -0,104 0,049** -0,136 0,196 -0,050 0,072 -0,196 0,206 -0,071 0,075 PALOPs (birth) -0,240 0,243 -0,089 0,090 -0,232 0,246 -0,085 0,090 -0,221 0,251 -0,080 0,091 Other African (birth) -0,785 0,741 -0,291 0,274 -0,836 0,742 -0,307 0,272 -0,858 0,750 -0,312 0,272 Eastern Europe (birth) -0,174 0,606 -0,064 0,225 -0,319 0,614 -0,117 0,225 -0,251 0,631 -0,091 0,229 EU15 (birth) 0,274 0,376 0,102 0,139 0,348 0,378 0,128 0,139 0,275 0,383 0,100 0,139 Emigrant -0,004 0,140 -0,001 0,052 0,018 0,143 0,007 0,052 0,023 0,144 0,008 0,052
Years Residence (≤10) -0,007 0,064 -0,003 0,024 0,000 0,065 0,000 0,024 0,000 0,067 0,000 0,024
32 Cont. Table A.4
Version 1 Version 2 Version 3
Variable Coef. Std.
Err. dy/dx
Std.
Err. Coef.
Std.
Err. dy/dx
Std.
Err. Coef.
Std.
Err. dy/dx
Std. Err.
Technicians and Associate
Professionals 0,3794 0,3316 0,1398 0,1218 0,3376 0,3477 0,1228 0,1262 Office Clerks 0,4399 0,3069 0,1621 0,1125 0,5713 0,33*** 0,2078 0,12*** Service Workers and Shop and
Market Sales Workers 0,6864 0,29** 0,2529 0,11** 0,7102 0,30** 0,2583 0,11** Skilled Agricultural and Fishery
Workers 0,5193 0,30** 0,1913 0,11*** 0,7101 0,42*** 0,2583 0,15*** Craft and Related Trades Workers 0,6868 0,30** 0,2530 0,11*** 0,6472 0,32** 0,2354 0,12**
Plant and Machine Operators and
Assemblers 0,8114 0,40** 0,2989 0,15** 0,8916 0,42** 0,3243 0,15** Elementary Occupations 0,5374 0,31*** 0,1980 0,11*** 0,6349 0,33** 0,2310 0,12** Working hours (per week) -0,0057 0,0049 -0,0021 0,0000 -0,0047 0,0051 -0,0017 0,0019 Self employed -0,1176 0,1555 -0,0433 0,0572 -0,1358 0,1609 -0,0494 0,0584 Income 0,0001 0,0001 0,0000 0,0000 0,0001 0,0001 0,0000 0,0000 Institutional sector (1=Private firm) -0,0004 0,2003 -0,0001 0,0729
Manufacturing -0,0004 0,2003 0,0653 0,1342
Construction 0,3807 0,4068 0,1385 0,1477
Wholesale and retail trade; repair of motor vehicles, motorcycles and
personal and household goods
0,3007 0,3486 0,1094 0,1265
Hotels and Restaurants 0,0127 0,3798 0,0046 0,1381
Transport, storage and
33 Cont. Table A.4
Version 1 Version 2 Version 3
Variable Coef. Std.
Err. dy/dx
Std.
Err. Coef.
Std.
Err. dy/dx
Std.
Err. Coef.
Std.
Err. dy/dx
Std. Err.
Financial intermediation -0,1707 0,5035 -0,0621 0,1831
Real estate, renting and business
activities 0,4722 0,4740 0,1718 0,1719
Public administration and defense;
compulsory social security 0,3750 0,1086 0,0395 0,1364
Education 0,3835 0,3820 0,1395 0,1386
Health and social work 0,1110 0,4012 0,0404 0,1459
Other community, social and
personal service activities 0,1459 0,3874 0,0531 0,1409 Activities of private households as
employers and undifferentiated production activities of private
households
-0,0075 0,3814 -0,0027 0,1387
Constant 1,5167 1,1946 1,0495 1,2769 0,7926 1,3626
34 Table A.5
Estimate results of Negative Binomial model on absenteeism (0-13 absent days). Portuguese 2005/2006 NHS
Version 1 Version 2 Version 3
Variable Coef. Std. Err. dy/dx Std. Err. Coef. Std. Err. dy/dx Std. Err. Coef. Std. Err. dy/dx Std. Err.
Disability (1=Yes) -0,157 0,145 -0,560 0,520 -0,179 0,147 -0,640 0,529 -0,178 0,150 -0,640 0,540 Interaction: Health
state*Disabilities (1=Bad health and disability)
0,447 0,139* 0,159 0,517* 0,477 0,140* 0,171 0,527* 0,527 0,142* 1,890 0,540*
Age: 16-24 -0,334 0,276 -0,119 0,990 -0,455 0,287 -0,163 0,104 -0,307 0,289 -1,101 1,040 Age: 25-34 0,114 0,182 0,405 0,648 0,016 0,189 0,057 0,676 0,062 0,192 0,224 0,690 Age: 35-44 -0,003 0,162 -0,010 0,578 -0,086 0,170 -0,309 0,609 -0,054 0,170 -0,194 0,610 Age: 45-54 0,234 0,155 0,833 0,558 0,178 0,159 0,638 0,571 0,204 0,159 0,731 0,573 Gender (1=Female) -0,041 0,117 -0,145 0,418 0,013 0,130 0,045 0,464 -0,035 0,144 -0,125 0,516 Civil status (1=Married) 0,102 0,126 0,363 0,452 0,094 0,128 0,335 0,459 0,071 0,128 0,254 0,460 Educational level: Secondary or
Post secondary -0,197 0,158 -0,703 0,565 -0,206 0,178 -0,736 0,643 -0,230 0,185 -0,826 0,670 Educational level: University -0,279 0,167*** -0,995 0,604*** -0,484 0,251*** -0,173 0,914*** -0,635 0,274** -2,277 1,007**
PALOPs (birth) -0,276 0,317 -0,983 1,132 -0,309 0,318 -0,110 0,114 -0,115 0,318 -0,412 0,114 Other African (birth) -1,191 1,042 -0,424 0,373 -0,908 1,055 -0,325 0,378 -0,746 1,051 -2,672 3,770 Eastern Europe (birth) 0,949 0,794 0,338 0,284 0,826 0,797 0,296 0,286 0,924 0,791 3,311 2,846 EU15 (birth) -0,058 0,438 -0,208 0,156 0,044 0,446 0,158 0,160 0,152 0,447 0,545 1,605 Emigrant -0,061 0,173 -0,218 0,618 -0,021 0,174 -0,075 0,624 0,024 0,174 0,086 0,625
Years Residence (≤10) 0,135 0,090 0,481 0,324 0,128 0,091 0,457 0,326 0,141 0,091 0,505 0,328
35 Cont. Table A.5
Version 1 Version 2 Version 3
Variable Coef. Std.
Err. dy/dx
Std.
Err. Coef. Std. Err. dy/dx Std. Err. Coef. Std. Err. dy/dx Std. Err.
Technicians and Associate
Professionals -0,302 0,337 -0,108 0,121 -0,318 0,355 -1,138 1,275 Office Clerks -0,470 0,276*** -0,168 0,100*** -0,552 0,302*** -1,977 1,097*** Service Workers and Shop and
Market Sales Workers -0,473 0,272*** -0,169 0,985*** -0,555 0,281** -1,988 1,023** Skilled Agricultural and Fishery
Workers -0,455 0,273*** -0,163 0,987*** -0,590 0,387 -2,114 1,401 Craft and Related Trades Workers -0,204 0,269 -0,730 0,966 -0,363 0,296 -1,301 1,068
Plant and Machine Operators and
Assemblers -0,166 0,347 -0,595 0,124 -0,178 0,365 -0,637 1,311 Elementary Occupations -0,318 0,283 -0,114 0,102 -0,316 0,295 -1,322 1,060 Working hours (per week) -0,001 0,005*** -0,005 0,017*** 0,001 0,005 0,002 0,017 Self employed -0,276 0,167 -0,986 0,604 -0,209 0,168 -0,750 0,605
Income 0,000 0,000 0,000 0,000 0,000 0,000 0,000 0,000
Institutional sector (1=Private firm) -0,515 0,229** -1,845 0,840**
Manufacturing 0,082 0,381 0,292 1,367
Construction 0,038 0,399 0,136 1,430
Wholesale and retail trade; repair of motor vehicles, motorcycles and
personal and household goods
-0,157 0,348 -0,563 1,247
Hotels and Restaurants -0,310 0,378 -1,112 1,359
Transport, storage and
36 Cont. Table A.5
Version 1 Version 2 Version 3
Variable Coef. Std.
Err. dy/dx
Std.
Err. Coef.
Std.
Err. dy/dx Std. Err. Coef. Std. Err. dy/dx
Std. Err.
Financial intermediation -0,30 0,62 -0,58 1,20
Real estate, renting and business
activities 0,54 0,55 1,04 1,06
Public administration and defense;
compulsory social security 0,39 0,45 0,76 0,88
Education 0,64 0,44 1,23 0,86
Health and social work 0,57 0,47 1,11 0,91
Other community, social and
personal service activities 0,61 0,43 1,17 0,83
Activities of private households as employers and undifferentiated
production activities of private households
-0,06 0,45 -0,11 0,86
Constant 0,77 1,06 0,46 1,16 0,32 1,25
/lnalpha 0,40 0,09 0,37 0,10 0,33 0,10
Alpha 1,49 0,14 1,45 0,14 1,40 0,14
37
Annex B
List of the main questions that lead to reduction in the number of observations
and
List of conditions to consider a person as disabled individual
List of main questions that lead to reduction in the number of observations
When excluding individuals under the age of 16 and over the age of 65, 14805 observations are deleted.
Regarding the question “How many days were you absent from work (school)?”, 25 162 individuals did not respond and were excluded from the estimations.
Concerning the question “How do you perceive your health in general?”, 366 individuals were excluded because they did not respond to the question.
List of conditions to consider a person as disabled individual
The variable Disability was built based on questions on chronic diseases. I consider as disabled individuals the ones that answered “yes” to one or more of the following questions:
Q 5.1 - Do/Did you have diabetes?
Q 5.10 - Do/Did you have asthma?
Q 5.16 - Do/Did you have high blood pressure?
Q 5.21 - Do/Did you have chronic pain?
38 1. Rheumatic disease (osteoarthritis, tendinitis) 2. Osteoporosis
3. Glaucoma
4. Retinopathy (retinal disease) 5. Malignant tumor or Cancer 6. Kidney stone
7. Renal failure 8. Chronic anxiety
9. Chronic wound (leg ulcers, sores)
10.Emphysema (chronic obstructive pulmonary disease), chronic bronchitis 11.Stroke
12.Obesity 13.Depression
39
References
Barros, P. and I. Pereira. 2009. Health Care and Health Outcomes of Migrants: Evidence from
Portugal. Human Development Research Paper, 28. UNDP.
Black, C. and D. Frost. 2011. Health at Work - An Independent Review of Sickness Absence.
Department for Work and Pension, UK Government.
Bonato, L. and L. Lusinyan. 2004. Work Absence in Europe. IMF Working Paper No. 193.
García-Serrano, C. and M. Malo. 2008. The Influence of Disability on Absenteeism: An
Empirical Analysis Using Spanish Data. Institute for Social and Economic Research, 29.
Hatletveit, J.. 2010. Education as a Determinant of Temporary Absenteeism: Results from the
Norwegian Labour Force Survey, 2006-2009. Norwegian School of Economics.
Ichino, A. and R. Riphahn. 2004. The Effect of Employment Protection on Worker Effort: A
Comparison of Absenteeism During and After Probation. IZA Discussion Paper No. 385.
Laaksonen, M., Mastekaasa A., Martikainen P., et al. 2010. Gender Differences in Sickness
Absence – The Contribution of Occupation and Workplace. Scandinavian Journal of Work,
Environment and Health, 36: 394-403.
Labriola, M., T. Lund and H. Burr. 2006. Prospective Study of Physical and Psychosocial Risk
Factors for Sickness Absence.Occupacional Medicine, 56: 469–474.
Norton, E., H. Wang and C. Ai. 2004. Computing Interaction Effects and Standard Errors in
Logit and Probit models. The STATA Journal No2: 154-167.
OECD. 2010. Sickness, Disability and Work: Breaking the Barriers. A Synthesis of Findings
Across OECD Countries. OECD.
WHO. 2011. World Report on Disability. WHO.
Winkelmann, R.. 1999. Wages, Firm Size and Absenteeism. Applied Economics Letters,