ECOLOGY, BEHAVIOR AND BIONOMICS
Changes in Brazilian Drosophilidae (Diptera) Assemblages Across an
Urbanisation Gradient
M
ARCOS. G
OTTSCHALK1, D
ANIELAC. D
ET
ONI2, V
ERAL.S. V
ALENTE1,3ANDP
AULOR.P. H
OFMANN21Lab. de Drosophila, Depto. Genética, IB, Univ. Federal do Rio Grande do Sul, C. postal 15.053, 91501-970
Porto Alegre, RS, [email protected]
2Lab. de Drosofi lídeos, Depto. Biologia Celular, Embriologia e Genética, CCB, Univ. Federal de Santa Catarina
88036-400, Florianópolis, SC, [email protected], [email protected]
3Programa de Pós-Graduação em Biologia Animal, IB, Univ. Federal do Rio Grande do Sul, [email protected]
Neotropical Entomology 36(6):848-862 (2007)
Mudanças em Assembléias Brasileiras de Drosophilidae (Diptera) em um Gradiente de Urbanização
RESUMO - O presente estudo objetiva caracterizar as assembléias de Drosophilidae amostradas em quatro pontos sujeitos a diferentes níveis de urbanização, na cidade de Florianópolis, Sul do Brasil. Foram realizadas cinco amostragens entre agosto/2000 e agosto/2001 e cinco entre agosto/2002 e agosto/2003 em cada ponto. Uma mudança gradual nas espécies dominantes foi observada no gradiente de urbanização, com acréscimo na abundância relativa das espécies exóticas nas áreas urbanas. Entre as espécies nativas, houve um decréscimo expressivo na abundância relativa de Drosophila capricorni Dobzhansky & Pavan. Por outro lado, a riqueza no ponto de baixa urbanização aumentou, provavelmente devido à presença de áreas verdes na cidade. O índice de diversidade não variou signifi cativamente entre os pontos, mas sua correlação com a eqüitabilidade e a riqueza se alterou.
PALAVRAS-CHAVE: Drosophila, Zaprionus, ecologia, diversidade, riqueza
ABSTRACT - The present study aims to characterise the assemblages of Drosophilidae sampled from four sites subject to different levels of urbanisation, in the city of Florianópolis, South Brazil. Five samples were collected between August 2000 and August 2001 and fi ve between August 2002 and August 2003 in each site. A gradual change in the dominant species was observed in the urbanisation gradient, with an increase in relative abundance of exotic species in urban areas. Among the native species, the relative abundance of Drosophila capricorni Dobzhansky & Pavan had an expressive decrease. In the other hand the richness in the low urbanisation site increased, probably due to the presence of urban gardens. The diversity index did not vary signifi cantly among sites, but its correlation with evenness and richness changed.
KEY WORDS: Drosophila, Zaprionus, ecology, diversity, richness
Cities and neighbouring areas can be considered as a particular ecosystem (Marcus & Detwyler 1972). Bryson & Ross (1972) suggested three main factors distinguishing cities from other environments: physical changes in soil surface, which promotes an increase in environmental aridity; air turbidity, which is the reduction in luminosity due to air pollution; and variation in heat production, which makes cities warmer than other environments. This variation in heat production is a consequence of the lower air circulation through buildings and of the paving of the soil, and is also infl uenced by air turbidity (Danni 1980).
Another important consequence of urbanisation is the biotic homogenisation, caused by the eradication of the wild fauna and fl ora by the introduction of exotic ones associated with the urbanisation process itself (Sukopp & Werner 1982, McKinney & Lockwood 1999, Pickett et al.
2001). For instance, several species of Drosophilidae are found in association with environments under anthropic infl uence (Parsons & Stanley 1981). These environmental changes usually defi ne a gradient from wild to urbanised areas. Ruszczyk (1986/1987) identifi ed this gradient in the city of Porto Alegre, southernmost Brazil, and suggested a classifi cation for the different urbanisation levels based on the extent of plant covers and the kind and height of buildings.
in the frequency of some genetic markers as chromosomal inversions, courtship patterns, and enzymatic polymorphisms in native species of Drosophila.
A number of other studies have recently investigated the urban fauna of Drosophilidae in the New World (Goñi et al. 1998, Avondet et al. 2003, Ferreira & Tidon 2005). All studies showed that the structures of these assemblages were similar, with a high predominance of the exotic species in detriment of the native species.
Considering that the urban ecosystem has not yet been suffi ciently studied, despite its intrinsic importance, the present study aimed to characterise and compare the Drosophilidae assemblages inhabiting sites at different transitions points from wild to urbanised environments in southern Brazil.
Material and Methods
Study area. Collections were carried out in the Santa Catarina Island, city of Florianópolis, Santa Catarina State, southern Brazil. This island measures approximately 424
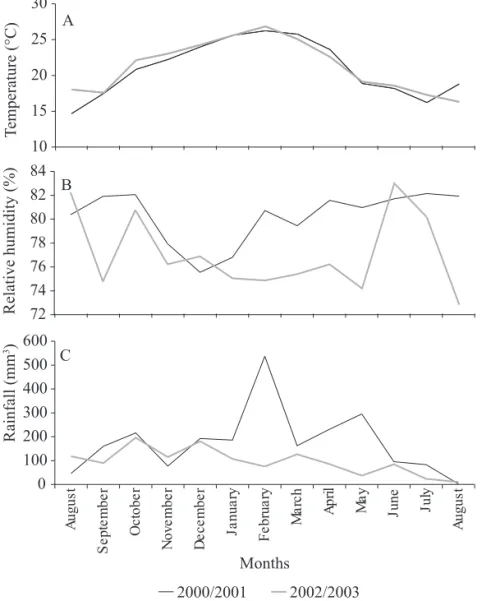
km² and is the location of the largest part of the city of Florianópolis, home to about 300,000 inhabitants. According to the Köeppen criteria, the climatic classifi cation of the area is type Cfa, located in subtropical intermediate zone and belongs to the mesothermic humid group (Prefeitura Municipal de Florianópolis 2005). The variation of the monthly average of daily temperature and relative humidity, the total monthly rainfall measured in the collection period at the Meteorological Station of Instituto Nacional de Meteorologia (27º35’S; 48º34’W; altitude of 2m) are shown in Fig. 1.
Four collection sites were chosen and characterized for the urbanisation degree (Fig. 2A and B), in agreement with Ruszczyk’s parameters (1986/1987): percentage of plant cover, and type and height of houses and buildings. As control, we sampled one site within a remaining area of the Atlantic Rain Forest at Morro da Lagoa da Conceição (27°35’268”S; 48°28’329”W), without urban influence (NU-not urbanised).
The low urbanisation site (LU) is in Morro da Cruz (27°35’040”S; 48°31’040”W) and is characterised by the occurrence of a degraded Atlantic Rain Forest surrounded
2000/2001 2002/2003 0 100 200 300 400 500 600 Au g u s t S e pt e m be r Oc to b e r No v e m b e r De c e m b e r J a nua ry Fe br ua ry Ma rc h Ap ri l Ma y Ju n e Ju ly Au g u s t Months 72 74 76 78 80 82 84 10 15 20 25 30 A B C Rainfall (mm 3)
Relative humidity (%)
T
emperature (°C)
by one-storey houses. The sampling site with a medium urbanisation level (MU) is in the Universidade Federal de Santa Catarina campus (27°36’129”S; 48°31’219”W), which is surrounded by several residential buildings up to four storeys high. The high urbanisation level site (HU) is in the 14ª Brigada Motorizada da Infantaria (27°35’273”S; 48°33’023”W). This area is circled by tall commercial and residential buildings over four storeys, although a small area covered by native species of trees survives in the zone.
Collection and identifi cation of specimens. Ten samples
were collected between August 2000 and August 2003. The samples were categorised as winter/2000 (collections between August 7th and September 1st), spring/2000 (October 25th to December 1st), summer/2001 (January 8th to February
7th), autumn/2001 (March 12th to April 21st), winter/2001 (July 9th to August 13th), winter/2002 (August 16th to September 7th), spring/2002 (November 7th to 22nd), summer/2003 (February 15th to 21st), autumn/2003 (April 9th to 16th) and winter/2003 (August 11th to 16th).
Flies were captured using 50 traps per sample, according to Tidon & Sene (1988), containing 5 kg of mashed bananas enriched with commercial yeast (Fleishmann®). Traps were hung 1.5 m high for three days.
The species identification was based on external morphology and on male genitalia (prepared according to Wheeler & Kambysellis 1966). When possible, a series of specimens of each species was deposited in the Museu de Ciências Naturais da Fundação Zoobotânica do Rio Grande do Sul.
NU LU
HU MU
500 m
0 20 40 60 80 100
NU LU MU HU
Sample sites
Buildings + pavement Grassland
Trees + shrubs A
B
Area percentage
Ecological and statistical analysis. The parameters used for diversity analysis were: number of individuals belonging to exotic species from the Neotropical area (Nexot), number of native species individuals (Nnat), number of exotic (Sexot) and native (Snat) species, the Shannon-Wiener diversity index (H’) (Magurran 1988, Krebs 1999), number of species estimated for 20 individuals with a rarefaction analysis (Srar) (Magurran 1988, Krebs 1999), and the Smith-Wilson evenness index (Evar) (Smith & Wilson 1996). Rarefaction curves were also built for each site (Magurran 1988, Krebs 1999). Comparisons between sites and seasons of the parameters available were accomplished by the MANOVA test, followed by a Tukey test (Krebs 1999, Zar 1999), and by Pearson correlations tests between H’ and the other indices (Zar 1999). The Shapiro-Wilk test and Levene’s test were used to verify normality and homogeneity of variances, respectively. For statistical analysis, we used natural logarithmic transformations in number of individuals (LnN).
The importance of the spatial and temporal variables in the total heterogeneity index value was measured by niche analysis according Levins (1968), with the calculations of H’between = H’total – (∑Nj*H’j)/N; where H’between is the value of H’ to a given component; H’total is the value of H’ considering all the samples together; N is the total number of individuals in all samples, Nj is the number of individuals in component j and H’j is H’ within component j. Two main components were available: spatial component (collection sites – NU, LU, MU and HU), and temporal component (years – 2000/2001 and 2002/2003, and seasons – winter, spring, summer, autumn). The interaction between spatial and temporal components (residual), which considered the variation between each collection individually, was also established. For comparisons between each collection we used the similarity Morisita’s index (Krebs 1999), followed by the construction of an UPGMA dendrogram (Sneath & Sokal 1973).
The statistical analysis used the software Statistica ‘98 edition (Statsoft 1998). Diversity indices and dendrogram construction were carried out using the Past version 1.34 (Hammer et al. 2001) and the Ecological Methodology version 5.2 (Krebs 1999) softwares.
Results
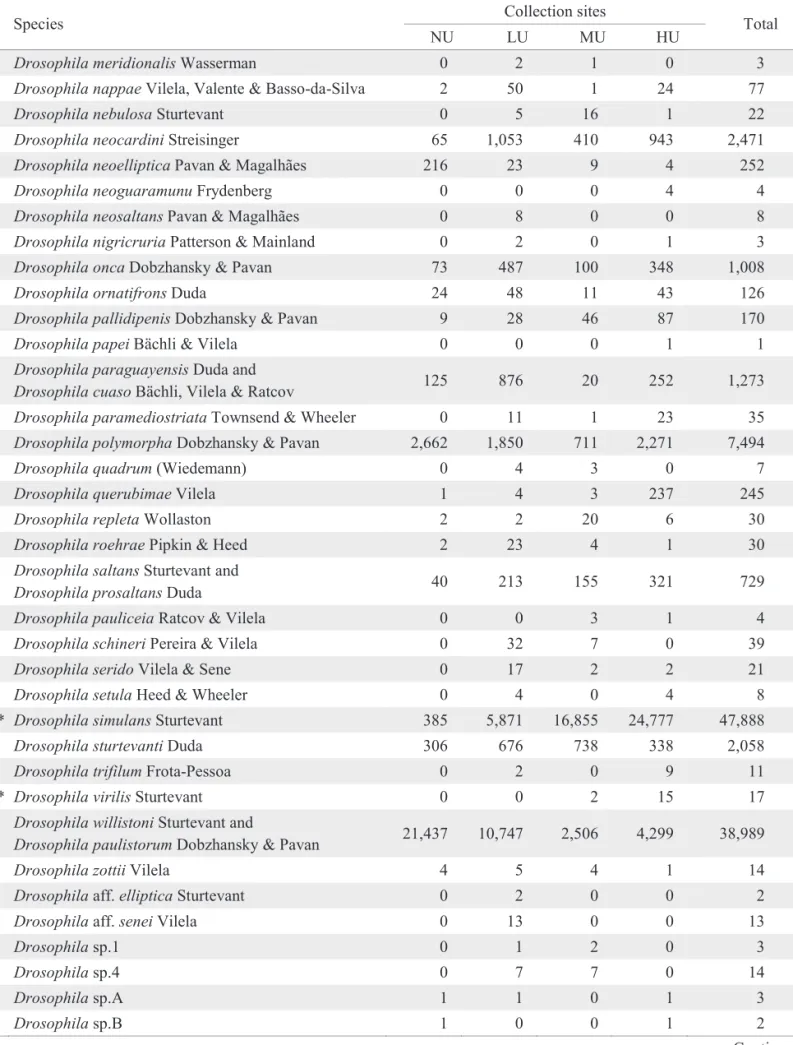
A total of 253,374 specimens belonging to 105 Drosophilidae species were collected and analysed. The absolute abundances of the collected species in each site are shown in Table 1.
The relative abundance (pi)of the species that reached values above 5% of the total per sample in each site is shown in Fig. 3. In NU (Fig. 3A), Drosophila capricorni Dobzhansky & Pavan was the best-represented species in winter, followed by the willistoni subgroup (D. willistoni Sturtevant and D. paulistorum Dobzhansky & Pavan). The predominance of D. capricorni also occurred in spring 2000. In the remaining samples, the willistoni subgroup was the most representative, followed by D. polymorpha Dobzhansky & Pavan or D. capricorni. In the LU site (Fig. 3B), the willistoni subgroup was the most predominant taxon in winter, and Zaprionus
indianus Gupta was the most representative species in summer and autumn 2001 and in spring 2002, followed either by the willistoni subgroup or by D. simulans Sturtevant. This latter species was predominant in spring 2000, and D. malerkotliana Parshad & Paika, followed by D. simulans prevailed in summer and autumn 2003.
In MU and HU (Fig. 3C and D), the assemblages showed the same dominant species, and in general, D. simulans was more abundant in the winter samples, followed by Z. indianus. An opposite tendency was observed in the spring and summer samples. In autumn, a great increase in the pi of D. malerkotliana was observed, becoming one of the dominant species, along with Z. indianus. D. malerkotliana was also the predominant species in summer 2003 in HU, followed by D. simulans,which was dominant in MU.
These patterns were also observed in the UPGMA dendrogram constructed with the Morisita’s similarity index (Fig. 4). In the majority of MU and HU samples, there are at least two dominant species with pi > 0.20, and the samples collected in LU presented an intermediate situation: in winter the dominance is exerted by the willistoni subgroup, and in the other collections by one of the exotic species D. simulans, Z. indianus or D. malerkotliana.
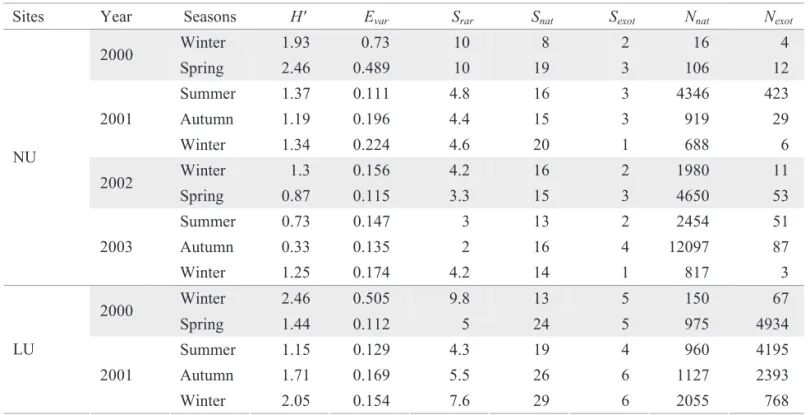
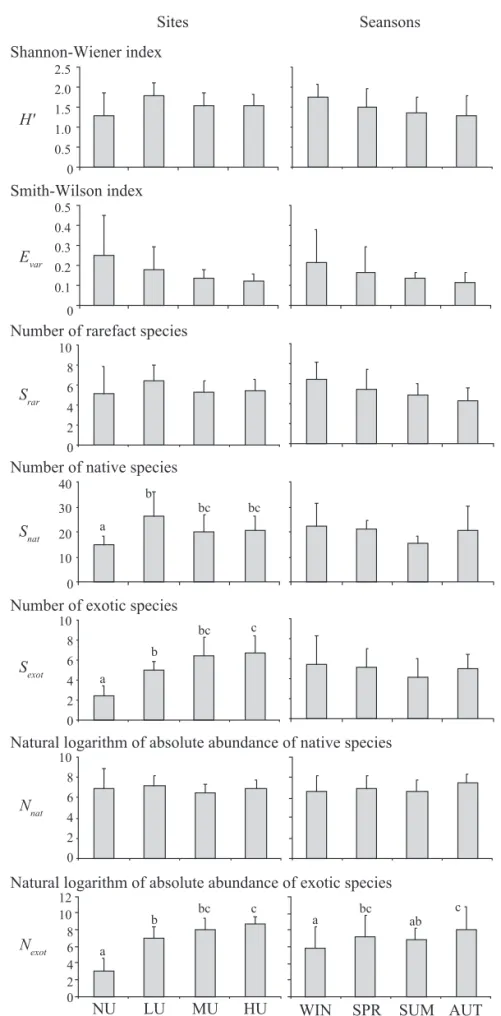
The calculated ecological parameters are shown in Table 2. We observed a signifi cant oscillation with the MANOVA test (between sites F = 7.70; P = 0.000 and between seasons F = 3.53; P = 0.0001). But, when we carried out the Tukey tests, only Nexotvaried signifi cantly between sites and seasons (Fig. 5), where NU was the lowest (P = 0.0002 for all the comparisons), and LU lower than HU (P = 0.002). As for seasons, winter values were lower than spring and the autumn values (P = 0.02 and 0.0002, respectively), and lower in summer than in autumn (P = 0.04). Snat and Sexot variations were signifi cant only in spatial terms, where Snat was lower in NU than in LU (P = 0.007). Additionally, Sexot was lower in NU than in LU, MU and HU (P = 0.03, 0.0003 and 0.0003, respectively) and in LU lower than in HU (P = 0.03). Although H’ and Srar did not vary signifi cantly, they presented higher values in LU and winters and lower values in NU and autumns. In terms of local variation, Evar values were higher in NU and lower in HU. Considering temporal variation, values observed were higher in winters and lower in autumns.
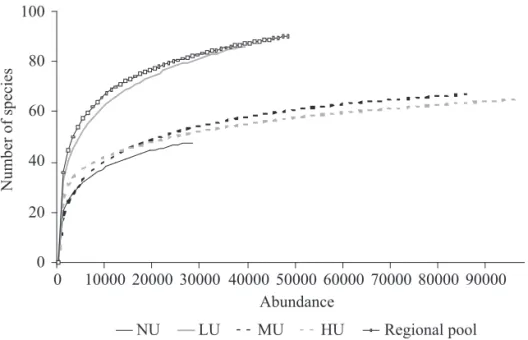
Rarefaction curves are shown in Fig. 6, together with the curve of De Toni et al. (2007). These authors carried out drosophilid collections in eight Atlantic forest sites of the Santa Catarina State during two consecutive years, and the observed total richness was used here as a measurement of regional richness. We observed that LU is the richest site, even when compared with NU, whose anthropic infl uence is much lower. Only the regional richness curve (De Toni et al. 2007) reached comparable values for LU.
Pearson correlation between the values of H’ and of Evar, Srar, Nnat, Nexot, Snat and Sexot are shown in Table 3. In NU, H’ correlated positively with Evar and negatively with Ln Nexot. On the contrary, in MU and HU, H’ correlated positively with Srar and Snat. In like manner, in HU the H’ also correlated positively with Sexot. In LU we found an intermediate situation, where H’ is positively correlated with Evar and Srar.
Table 1. Absolute abundance of the species collected in each site.
Continue Collection sites
Species
NU LU MU HU Total
Amiota sp. 0 4 0 0 4
Diathoneura brasiliensis Duda 0 1 0 0 1
* Drosophila ananassae Doleschall 0 80 527 293 900
Drosophila annulimana Duda 15 11 9 10 45
Drosophila ararama Pavan & da Cunha 0 0 4 6 10
Drosophila arassari da Cunha & Frota-Pessoa 1 1 1 1 4
Drosophila atrata Burla & Pavan 0 2 0 0 2
Drosophila bandeirantorum Dobzhansky & Pavan 8 8 10 75 101
Drosophila bocainensis Pavan & da Cunha 5 32 7 6 50
Drosophila bocainoides Carson 6 0 0 0 6
Drosophila briegeri Pavan & Breuer 0 1 0 0 1
Drosophila bromelioides Pavan & da Cunha 0 5 10 4 19
* Drosophila busckii Coquillett 0 17 12 124 153
Drosophila caponei Pavan & da Cunha 48 66 56 88 258
Drosophila capricorni Dobzhansky & Pavan 2,353 233 29 56 2,671
Drosophila cardini Sturtevant 0 0 3 0 3
Drosophila cardinoides Dobzhansky & Pavan 1 110 1,292 1,208 2,611
Drosophila carolinae Vilela 9 11 4 3 27
Drosophila dreyfusi Dobzhansky & Pavan 10 0 0 0 10
Drosophila fascioloides Dobzhansky & Pavan 0 0 0 4 4
Drosophila flexa Loew 0 1 2 3 6
Drosophila fumipennis Duda 150 105 2 4 261
Drosophila fuscolineata Duda 2 10 11 10 33
Drosophila gaucha Jaeger & Salzano 0 0 1 0 1
Drosophila griseolineata Duda 17 390 39 183 629
Drosophila guaraja King 2 11 1 77 91
Drosophila hydei Sturtevant 4 11 23 152 190
* Drosophila immigrans Sturtevant 34 423 220 669 1,346
* Drosophila kikkawai Burla 0 0 40 129 169
Drosophila limensis Pavan & Patterson 0 7 12 4 23
Drosophila maculifrons Duda 0 2 2 1 5
* Drosophila malerkotliana Parshad & Paika 7 2,386 24,727 21,621 48,741
Drosophila mapiriensis Vilela & Bachli 4 4 0 73 81
Drosophila mediopicta Frota-Pessoa 89 112 4 37 242
Drosophila mediopunctata Dobzhansky & Pavan 85 104 28 83 300
Drosophila mediostriata Duda 0 0 2 3 5
* Drosophila melanogaster Meigen 3 64 50 1,235 1,352
Table 1. Continuation.
Continue Collection sites
Species
NU LU MU HU Total
Drosophila meridionalis Wasserman 0 2 1 0 3
Drosophila nappae Vilela, Valente & Basso-da-Silva 2 50 1 24 77
Drosophila nebulosa Sturtevant 0 5 16 1 22
Drosophila neocardini Streisinger 65 1,053 410 943 2,471
Drosophila neoelliptica Pavan & Magalhães 216 23 9 4 252
Drosophila neoguaramunu Frydenberg 0 0 0 4 4
Drosophila neosaltans Pavan & Magalhães 0 8 0 0 8
Drosophila nigricruria Patterson & Mainland 0 2 0 1 3
Drosophila onca Dobzhansky & Pavan 73 487 100 348 1,008
Drosophila ornatifrons Duda 24 48 11 43 126
Drosophila pallidipenis Dobzhansky & Pavan 9 28 46 87 170
Drosophila papei Bächli & Vilela 0 0 0 1 1
Drosophila paraguayensis Duda and
Drosophila cuaso Bächli, Vilela & Ratcov 125 876 20 252 1,273 Drosophila paramediostriata Townsend & Wheeler 0 11 1 23 35
Drosophila polymorpha Dobzhansky & Pavan 2,662 1,850 711 2,271 7,494
Drosophila quadrum (Wiedemann) 0 4 3 0 7
Drosophila querubimae Vilela 1 4 3 237 245
Drosophila repleta Wollaston 2 2 20 6 30
Drosophila roehrae Pipkin & Heed 2 23 4 1 30
Drosophila saltans Sturtevant and
Drosophila prosaltans Duda 40 213 155 321 729
Drosophila pauliceia Ratcov & Vilela 0 0 3 1 4
Drosophila schineri Pereira & Vilela 0 32 7 0 39
Drosophila serido Vilela & Sene 0 17 2 2 21
Drosophila setula Heed & Wheeler 0 4 0 4 8
* Drosophila simulans Sturtevant 385 5,871 16,855 24,777 47,888
Drosophila sturtevanti Duda 306 676 738 338 2,058
Drosophila trifilum Frota-Pessoa 0 2 0 9 11
* Drosophila virilis Sturtevant 0 0 2 15 17
Drosophila willistoni Sturtevant and
Drosophila paulistorum Dobzhansky & Pavan 21,437 10,747 2,506 4,299 38,989
Drosophila zottii Vilela 4 5 4 1 14
Drosophila aff. elliptica Sturtevant 0 2 0 0 2
Drosophila aff. senei Vilela 0 13 0 0 13
Drosophila sp.1 0 1 2 0 3
Drosophila sp.4 0 7 7 0 14
Drosophila sp.A 1 1 0 1 3
the diversity of spatial and temporal variation were small, of approximately 14% and 7%, respectively. The residual contribution (spatial vs. temporal contribution) explains only 29% of the total value of H’.
Discussion
The present study sheds new light on the role of Drosophilidae as indicators of alterations in urban, transitional and wild environments in the Neotropical region.
The Drosophilidae fauna of urban areas and Atlantic Forest was characterized by their dominant species. The exotic species were quite dominant in the studied urban environments. The association of the melanogaster group with anthropic environments is a consensus among the drosophilists. The species of this group are associated with altered or open environments in Brazil, as cities, cerrados, strand forests and dunes (Sene et al. 1980, Ferreira & Tidon 2005, Tidon 2006).
The great dominance of the recently introduced African fl y Z. indianus in the assemblages of MU and HU and the Table 1. Continuation.
Collection sites Species
NU LU MU HU Total
Drosophila sp.C 1 0 6 0 7
Drosophila sp.D 1 0 3 0 4
Drosophila sp.E 0 0 1 0 1
Drosophila sp.G 0 7 0 0 7
Drosophila sp.G12 0 1 0 2 3
Drosophila sp.G13 0 7 0 0 7
Drosophila sp.G14 0 3 0 0 3
Drosophila sp.G16 1 0 1 0 2
Drosophila sp.GORD 0 1 0 0 1
Drosophila sp.H 0 1 0 0 1
Drosophila sp.M4 0 1 0 0 1
Drosophila sp.Q2 2 3 0 0 5
Drosophila sp.R2 0 0 3 0 3
Drosophila sp.R3 0 1 0 0 1
Drosophila sp.T3 0 1 0 1 2
Hirtodrosophila sp.1 0 1 0 0 1
Hirtodrosophila sp.Z2 3 72 1 0 76
Hirtodrosophila sp.Z3 0 3 0 0 3
Hirtodrosophila sp.Z4 0 5 0 0 5
Rhinoleucophenga obesa (Loew) 0 1 0 0 1
* Scaptodrosophila latifasciaeformis (Duda) 2 1,127 875 70 2,074
* Zaprionus indianus Gupta 248 10,451 35,417 34,069 80,185
Zygothrica bilineata (Williston) 0 1 0 0 1
Zygothrica dispar (Wiedemann) 0 29 0 0 29
Zygothrica orbitalis (Sturtevant) 16 8 10 3 37
Zygothrica prodispar Duda 0 8 0 0 8
Zygothrica vittimaculosa Burla 0 8 1 8 17
Zygothrica sp. C 0 1 0 0 1
Total 28,762 39,241 87,457 97,914 253,374
almost absence in the forest also deserves attention. Tidon et al. (2003), in collections made in wild environments of Central Brazil, observed that Z. indianus is more abundant in open areas of the cerrado, but not in gallery forest environments. Silva et al. (2005a, b) also verifi ed the high abundance of this fl y in the urban areas of the city of Porto Alegre, in the southernmost state of Brazil.
In general, the exotic species are being appointed as indicators of disturbed environments (Ferreira & Tidon 2005; Silva et al. 2005a,b), except D. simulans that, in some studies, was cited as naturalised in the Brazilian environments (Dobzhansky & Pavan 1950, Pavan 1959). Yet, this naturalisation cannot be generalized, since its populations collected in places covered with Atlantic forest vegetation are scarce, in comparison with those sampled in other wild environments like mangroves and strand forests (H.J. Schmitz and L.E.M. Bizzo, personal communication). D. simulans distribution in the urban gradient suggests that perhaps the species cannot so easily establish in wild Atlantic forest.
The willistoni subgroup, typical of forests (Martins 1987, 2001; Saavedra et al. 1995), was very abundant in our collections, including those carried out in urbanized areas. The presence of these species in urban areas was previously related by Valente et al. (1993), by Valiati & Valente (1996),
and recently by Silva et al. (2005a,b), who sampled it at high abundance in Porto Alegre, southernmost Brazil. Moreover, due to the high abundance of the exotic species in the city, the expressiveness of willistoni subgroup is low in areas of medium and high urbanisation.
However, D. capricorni, another member of the willistoni group, had a very pronounced decrease in the city, behaving as a typical urban-sensitive species. Similarly low abundances have been observed in open environments (Sene et al. 1980, Tidon 2006). Due to this high susceptibility to environmental changes, this species appears to be a suitable indicator of preserved areas covered by Atlantic Forest vegetation.
The influence of urbanisation over Drosophilidae assemblages apparently attained its maximum effect in the medium urbanisation site. This observation is in accordance with Ferreira & Tidon (2005), who verifi ed the same effect in Brasília. Apparently, it can be said that the assemblages belonging to the low urbanisation site were characterized as transitory between those belonging to wild and disturbed areas.
The values of H’, Evar and Srar were very close to what was observed in other studies carried out in other environments in the south of Brazil (Saavedra et al. 1995, Silva et al. 2005b, De Toni et al. 2007) and the peak in abundance of Drosophila
Fig. 3. Relative abundance of the main species sampled in each sampling site (pi > 0.05). A) NU – not urbanized site. B) LU
– low urbanisation site. C) MU – medium urbanisation site. D) HU – high urbanisation site.
0 10 20 30 40 50 60 70 80 90 100 0 10 20 30 40 50 60 70 80 90 100 Win ter 2000
Sprin g2000 Sum mer 2001 Autu mn 2001 Winte r 2001
Win ter 2
002
Sprin g2002
Summe r 200
3
Autu mn
2003
Win ter 2
003
Win ter 2
000 Spring 2000 Summe r 2001 Autu mn 2001 Win ter 2001
Win ter 2002
Sprin g20
02
Sum mer 200
3
Autu mn
2003
Win ter 2
003
D. capricorni D. malerkotliana D. polymorpha D. simulans D. willistoni subgroup Z. indianus
Other native species Other exotic species
A
C D
B
Relative abundance (
pi
) (%)
Fig. 4. UPGMA dendrogram constructed with Morisita’s similarity index and the predominant species in each sample. NU – not urbanized site, LU – low urbanisation site, MU – medium urbanisation site, HU – high urbanisation site.
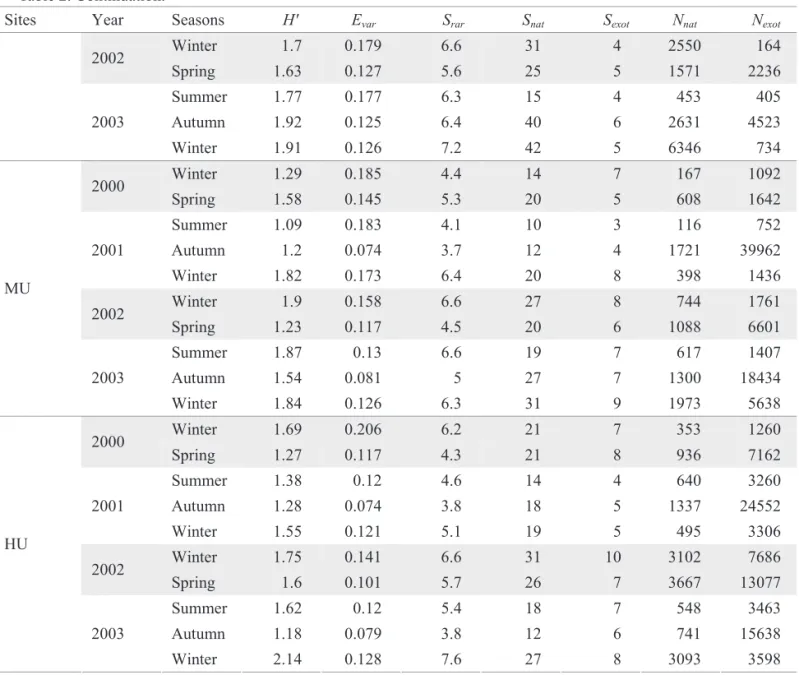
Table 2. Ecological indices calculated for each collection.
Continue
Sites Year Seasons H' Evar Srar Snat Sexot Nnat Nexot
Winter 1.93 0.73 10 8 2 16 4
2000
Spring 2.46 0.489 10 19 3 106 12
Summer 1.37 0.111 4.8 16 3 4346 423
Autumn 1.19 0.196 4.4 15 3 919 29
2001
Winter 1.34 0.224 4.6 20 1 688 6
Winter 1.3 0.156 4.2 16 2 1980 11
2002
Spring 0.87 0.115 3.3 15 3 4650 53
Summer 0.73 0.147 3 13 2 2454 51
Autumn 0.33 0.135 2 16 4 12097 87
NU
2003
Winter 1.25 0.174 4.2 14 1 817 3
Winter 2.46 0.505 9.8 13 5 150 67
2000
Spring 1.44 0.112 5 24 5 975 4934
Summer 1.15 0.129 4.3 19 4 960 4195
Autumn 1.71 0.169 5.5 26 6 1127 2393
LU
2001
Winter 2.05 0.154 7.6 29 6 2055 768
0.2 0.3 0.4 0.5 0.6 0.7 0.8 0.9 1.0
0.1
NU - Winter 2000 NU - Winter 2001 NU - Winter 2002 NU - Winter 2003 NU - Spring 2000 NU - Summer 2001 LU - Winter 2001 LU - Winter 2003 NU - Autumn 2001 NU - Spring 2002 NU - Summer 2003 LU - Winter 2002 NU - Autumn 2003 LU - Winter 2000 LU - Spring 2000 MU - Winter 2000 HU - Winter 2000 HU - Winter 2002 MU - Winter 2002 MU - Summer 2003 MU - Winter 2003 HU - Winter 2003 LU - Summer 2001 MU - Summer 2001 MU - Spring 2002 MU - Spring 2000 HU - Spring 2000 MU - Winter 2001 HU - Spring 2002 LU - Autumn 2001 LU - Spring 2002 HU - Summer 2001
MU - Autumn 2001 MU - Autumn 2003 LU - Summer 2003 LU - Autumn 2003 HU - Autumn 2001 HU - Autumn 2003 HU - Winter 2001 HU - Summer 2003
Morisita Similarity index Collections Predominantspecies
D. capricorni and D. willistoni sg.
D. capricorni
D. willistoni sg.
D. simulans and Z. indianus
Z. indianus
D. malerkotliana and D. willistoni sg. D. malerkotliana and
Z. indianus D. malerkotliana and
Table 2. Continuation.
Sites Year Seasons
Winter 1.7 0.179 6.6 31 4 2550 164
2002
Spring 1.63 0.127 5.6 25 5 1571 2236
Summer 1.77 0.177 6.3 15 4 453 405
Autumn 1.92 0.125 6.4 40 6 2631 4523
2003
Winter 1.91 0.126 7.2 42 5 6346 734
Winter 1.29 0.185 4.4 14 7 167 1092
2000
Spring 1.58 0.145 5.3 20 5 608 1642
Summer 1.09 0.183 4.1 10 3 116 752
Autumn 1.2 0.074 3.7 12 4 1721 39962
2001
Winter 1.82 0.173 6.4 20 8 398 1436
Winter 1.9 0.158 6.6 27 8 744 1761
2002
Spring 1.23 0.117 4.5 20 6 1088 6601
Summer 1.87 0.13 6.6 19 7 617 1407
Autumn 1.54 0.081 5 27 7 1300 18434
MU
2003
Winter 1.84 0.126 6.3 31 9 1973 5638
Winter 1.69 0.206 6.2 21 7 353 1260
2000
Spring 1.27 0.117 4.3 21 8 936 7162
Summer 1.38 0.12 4.6 14 4 640 3260
Autumn 1.28 0.074 3.8 18 5 1337 24552
2001
Winter 1.55 0.121 5.1 19 5 495 3306
Winter 1.75 0.141 6.6 31 10 3102 7686
2002
Spring 1.6 0.101 5.7 26 7 3667 13077
Summer 1.62 0.12 5.4 18 7 548 3463
Autumn 1.18 0.079 3.8 12 6 741 15638
HU
2003
Winter 2.14 0.128 7.6 27 8 3093 3598
H' Evar Srar Snat Sexot Nnat Nexot
species in autumn and spring has been recorded by Basden (1953) and Martins (1987), respectively. Avondet et al. (2003) and Ferreira & Tidon (2005) also observed the increasing abundance of exotic species in cities, and we propose that this increase could act as an indicative of disturbance in wild forest environments.
On the other hand, there was a surprisingly low infl uence of urbanisation over some native species, as D. polymorpha and the willistoni subgroup. Also, not only did richness apparently remain unaltered in urbanized areas, but also increased in LU. Such observation is particularly interesting, since several species collected in city are clearly non-generalists, such as those of the annulimana, repleta and tripunctata groups.
McIntyre (2000) lists several factors, including pollution and the fragmentation of natural habitats with the ultimate isolation of natural populations as the main causes of the loss of richness in urban environments. However, in studies with
birds and butterfl ies, a high richness in moderate disturbed environments was observed, like in LU (Blair 1996, Blair & Launer 1997, Crooks et al. 2004). This can be explained by the association of the native species with small areas covered by vegetation close to the sampling sites. Zapparoli (1997), investigating insects in Rome, also observed that when the sampling sites were close to gardens, the richness and the diversity of species were high. Besides this, areas with vegetation in the city promote more favourable environmental conditions also for the surrounding ones (Danni 1980). In the two more urbanized sites investigated in the present study, there is at least one small area with native vegetation in the neighbourhoods. Conversely, the low urbanisation site is located in a partially urbanised hill, which can act as a safe haven for native species in the city. It is possible to assume that these green areas are supporting the survival of Drosophila native species in urban areas.
H´ – Shannon-Wiener index, Evar – Smith-Wilson index, Srar – Number of rarefact species, Snat – Number of native species, Sexot
– Number of exotic species, Nnat – Absolute abundance of native species, Nexot – Absolute abundance of exotic species, NU – not
Fig. 5. Average of indices per site and per season, and signifi cant differences. NU – not urbanized site, LU – low urbanisation site, MU – medium urbanisation site, HU – high urbanisation site, WIN – winter, SPR – spring, SUM – summer, AUT – autumn.
Different letters represent signifi cant differences in the ANOVA test at α = 0.05, and the absence of letters means no signifi cant
differences.
0 0.1 0.2 0.3 0.4 0.5
0 2 4 6 8 10
0 10 20 30 40
0 2 4 6 8 10
0 2 4 6 8 10 12
NU LU MU HU WIN SPR SUM AUT
0 0.5 1.0 1.5 2.0 2.5
H'
Shannon-Wiener index
Smith-Wilson index
Evar
Number of rarefact species
Srar
Number of native species
Snat
Number of exotic species
0 2 4 6 8 10
Sexot
Natural logarithm of absolute abundance of native species
Nnat
Natural logarithm of absolute abundance of exotic species
Nexot
Sites Seansons
a
b bc c a ab
c bc
a b
bc bc
a b
This attribute of urban gardens was also observed for other insects, as butterfl ies (Blair & Launer 1997, Wood & Pullin 2002, Shapiro 2002) and mosquitoes (Barbosa et al. 2003, Navarro-Silva et al. 2004). Nevertheless, Levy & Connor (2004) point that the populations found in these gardens could not be maintained due to a lack of local resources, and that these areas probably act as sink environments for these populations. Could the populations of native species of Drosophilidae survive in urban environments? This question can only be answered with further investigation of the substrata used as breeding site by these species in urban areas.
Another possibility to explain the highest richness of native species in urban areas, especially in low urbanisation sites, is the increased attractiveness of the baits in the city. It can happen by an increase in the stressing factors and a lack of natural resources in the city. Like this, the loss of richness becomes apparent when compared with the regional values. Crooks et al. (2004) observed that local bird diversity increases in moderately disturbed environments, but decreases in the overall regional diversity. These authors attribute this loss of richness to the biotic homogenisation of urban environments (McKinney & Lockwood 1999). It is very unlikely that the urban areas are as rich as, or even Fig. 6. Curves with rarefaction data of the collection sites and the data from regional pool (De Toni et al. 2007). NU – not urbanized site, LU – low urbanisation site, MU – medium urbanisation site, HU – high urbanisation site.
0 20 40 60 80 100
0 10000 20000 30000 40000 50000 60000 70000 80000 90000 Abundance
NU LU MU HU Regional pool
Number of species
Table 3. Pearson correlations between the Shannon-Wiener diversity index (H’) and the other ecological parameters observed.
NU LU MU HU
H’ vs. Evar r = + 0.74
P = 0.01*
r = + 0.71 P = 0.02*
r = + 0.52 P = 0.13
r = + 0.06 P = 0.87
H’ vs. Srar r = + 0.51
P = 0.13
r = + 0.87 P = 0.001*
r = + 0.85 P = 0.002*
r = + 0.85 P = 0.002*
H’ vs. Snat r = + 0.27
P = 0.45
r = + 0.15 P = 0.68
r = + 0.73 P = 0.02*
r = + 0.66 P = 0.04*
H’ vs. Sexot r = - 0.24
P = 0.50
r = + 0.49 P = 0.15
r = + 0.54 P = 0.11
r = + 0.80 P = 0.01*
H’ vs. Nnat r = - 0.41
P = 0.24
r = + 0.13 P = 0.73
r = + 0.14 P = 0.70
r = + 0.19 P = 0.60
H’ vs. Nexot r = - 0.75
P = 0.01*
r = - 0.49 P = 0.15
r = - 0.38 P = 0.28
r = - 0.04 P = 0.91
Evar – Smith-Wilson index, Srar – number of rarefact species, Snat – number of native species, Sexot – number of exotic species, Nnat
– natural logarithm of absolute abundance of native species, Nexot – natural logarithm of absolute abundance of exotic species,
NU – not urbanized site, LU – low urbanisation site, MU – medium urbanisation site, HU – high urbanisation site. * Signifi cant
richer than native areas as the Atlantic Forest. The rarefaction analysis show that LU exhibits the same richness as detected by De Toni et al. (2007), who collected samples in eight points of the Atlantic Forest for two consecutive years. The data obtained by De Toni et al. (2007) could be used as a regional pool, in spite of the difference in the number of sampling sites. We also observed that our urban assemblages are not as rich as the regional pool.
Sevenster & van Alphen (1996) could explained the coexistence of local species of Drosophila in a forest of Panama with the aggregation model (see Sevenster 1996), which presupposes that, if the resources are discrete and ephemeral, they could support the coexistence of competitor species when these distribute gregariously. However, Krijger & Sevenster (2001) found that, in disturbed environments, the aggregation of species is lower than in wild environments. The species coexistence mechanism in cities has not yet been elucidated. Yet, evidence says that the competitive exclusion of native species by exotic species is not very probable, since we found all of them in sympatry and with abundances sustained along time.
The seasonal variation observed in the forest environment was already reported in studies of drosophilids (Martins 1987, De Toni et al. 2007). But the patterns of seasonal variation observed in the urbanized regions of the Neotropics have not so far been recorded. Tidon et al. (2003) verifi ed that Z. indianus inhabitingthe Brazilian cerrado is more common in summer and scarcer in winter. These authors mention that this pattern is similar to that found in its place of origin, in Africa, and that this species is well acclimatised in the open Brazilian environments. Franck & Valente (1985) and Martins (1987) did not associate seasonal fl uctuation of melanogaster group species in disturbed environments to defi ned climatic factors. In our study, however, an apparently regular fl uctuation was detected for these species, with D. malerkotliana, D. simulans and Z. indianus showing higher relative abundances in autumn, winter, and in spring, respectively.
In the Atlantic forest, diversity increased concomitantly to an increase in evenness and to a decrease in abundance
of exotic species. The presence of the exotic species could infl uence the wild assemblages by decreasing evenness in hot periods. In the urban environments, H’ was related with an increase in richness. The exotic species were most dominant in the city, what could be responsible for the decreased evenness of the assemblages and for the oscillation in diversity, as compared to richness. In the low urbanization site, diversity correlates both with evenness and richness. These differences in the manner these indices relate to one another probably refl ect the individual characteristics of each environment studied and, again, LU shows a transitory character between forest and urban sites.
Even with these variations in the structure of local diversity, the difference between collection sites contributes but discretely to the total diversity observed, and therefore to the seasonal and annual variation. The residual value was the largest contribution to the total diversity. This variation carries but little informational worth, because it shows the contribution of the variation among each collection and could thus be considered as a casual effect. Irrespective of these observations, the contributions of all these factors do not surpass 50% of all the observed diversity. This lower value related to these factors was not expected, since we compared different environments that could explain a large portion of the total diversity observed, which nevertheless was not the case. Both Shorrocks (1974) and Brncic et al. (1985), when collecting in sites with temperate climate, found higher values for temporal factors with this analysis (35.69% and 46.23%, respectively). In temperate climates, the assemblages were simpler than in hotter places and seasonality could answer for most of the diversity observed.
In this way, it becomes diffi cult to anticipate which is the principal factor infl uencing the observed diversity. It is probable that a combination of many factors, not considered in this work, such as the richness and abundance of breeding sites, could contribute with the maintenance of diversity.
We observed a gradual modifi cation in the dominant species in the assemblages related to the increased urbanisation. We also depicted a seasonal pattern of dominance in the assemblages collected in wild and urban environments. In the wild assemblages from Atlantic forest, D. capricorni and the willistoni subgroup were the dominant species, while in the city the dominance is exerted by D. simulans, D. malerkotliana,and Z. indianus.
Some parameters are proposed as indicators of the growth of urban impact in Brazilian Atlantic Rain Forest: 1) the high relative abundance and number of exotic species, as D. simulans, D. malerkotliana and Z. indianus; 2) the low relative abundance of the willistoni subgroup and, mainly, D. capricorni,which is proposed as an important sensitive species. However, the number of native species is not an advisable measure, since we observed a high richness in the disturbed environments. Probably, the richness in the urban sites could be supported by the occurrence of gardens in Florianópolis, but they could be acting as sink environments. In this sense, the richness observed in the highly urbanized sites is lower than the regional richness.
Finally, we observed that the assemblage structures in each environment were different. In the wild environment studied, diversity was related with evenness and, in the urban Table 4. Niche analysis of diversity for temporal and
spatial components.
Contribution to diversity Niche component
H’ % total
Spatial variability
between sites 0.277 14.03
Temporal variability
between years 0.002 0.08
between seasons 0.141 7.14
Spatial x temporal variability (residual)
between collections 0.576 29.19
Not explained 0.978 49.57
environment, with the number of species collected. The total diversity observed was neither explained by these differences, nor by the differences in the environments.
Acknowledgments
The authors are grateful to Monica L. Blauth, Hermes J. Schmitz, Jonas S. Döge and Luís Eduardo M. Bizzo for suggestions, criticism, for the revision of the manuscript and help with sampling; to Victor H. Valiati, Rosana Tidon, Marlúcia B. Martins, Milton Mendonça Jr. and the anonymous reviewer for suggestions and criticism, to Prof. Carlos R. Vilela and Hermes F. Medeiros for the assistance in the identifi cation of some specimens, to Juliana Cordeiro, Marcos A. Loureiro and Sabrina C. F. Oliveira for helping with sampling, to CAPES for the fellowship and to CNPq and FAPERGS for the grants provided.
References
Avondet, J., R.B. Blair, D.J. Berg & M.A. Ebbert. 2003. Drosophila
(Diptera: Drosophilidae) Response to changes in ecological parameters across an urban gradient. Environ. Entomol. 32: 347-358.
Barbosa, A.A., M.A. Navarro-Silva & D. Calado. 2003. Atividade de Culicidae em remanescente fl orestal na região de Curitiba (Paraná, Brasil). Rev. Bras. Zool. 20: 59-63.
Basden E.B. 1953. The autumn fl ush of Drosophila (Diptera). Nature 172: 1155-1156.
Blair, R.B. 1996. Land use and avian species diversity along an urban gradient. Ecol. Appl. 6: 506-519.
Blair, R.B. & A.E. Launer. 1997. Butterfl y diversity and human land use: Species assemblages along an urban gradient. Biol. Conserv. 80: 113-125.
Brncic D., M. Budnik & R. Guiñez. 1985. An analysis of a Drosophilidae community in Central Chile during a three years period. J. Zool. Syst. Evol. Res. 23: 90-100.
Bryson, R.A. & J.E. Ross. 1972. The climate of the city, p.51-58. In T.R. Detwyler & M.G. Marcus (eds.),Urbanisation and environment - The physical geography of the city. Duxbury, Belmont, 287p.
Crooks, K.R., A.V. Suarez & D.T. Bolger. 2004. Avian assemblages along a gradient of urbanization in highly fragmented landscape. Biol. Conserv. 115: 451-462.
Danni, I.M. 1980. A ilha térmica de Porto Alegre. Bol. Gaúcho Geogr. 8: 33-48.
De Toni, D.C., M.S. Gottschalk, J. Cordeiro, P.R.P. Hofmann & V.L.S. Valente. 2007. Study of the Drosophilidae (Diptera: Drosophilidae) assemblies on Atlantic Forest Islands of Santa Catarina State. Neotrop. Entomol. 36: 356-375.
Dobzhansky, T.H. & C. Pavan. 1950. Local and seasonal variation in frequencies of species of Drosophila in Brazil. J. Anim. Ecol. 19: 1-14.
Ferreira, L.B. & R. Tidon. 2005. Colonizing potential of Drosophilidae (Insecta, Diptera) in environments with different grades of urbanization. Biol. Conserv. 14: 1809-1821.
Franck, G. & V.L.S. Valente. 1985. Study on the fl uctuation in
Drosophila populations of Bento Gonçalves, RS, Brazil. Rev.
Bras. Biol. 45: 133-141.
Goñi, B., M.E. Martinez, V.L.S. Valente & C.R. Vilela. 1998. Preliminary data in the Drosophila species (Diptera, Drosophilidae) from Uruguay. Rev. Bras. Entomol. 42: 131-140.
Hammer, O., D.A.T. Harper & P.D. Ryan. 2001. PAST: Paleontological statistics software package for education and data analysis. Palaeontol. Electr. 4: 1-9. URL: http://palaeo-electronica.org/2001_1/past/issue1_01.htm
Krebs, C.J. 1999. Ecological methodology, 2ªedn. Benjamin/ Cummings, Menlo Park, 624p.
Krijger, C.L. & J.G. Sevenster. 2001. Higher species diversity explained by stronger spatial aggregation across six Neotropical
Drosophila communities. Ecol. Lett. 4: 106-115.
Levins, R. 1968. Evolution in changing environments. Princeton University Press, New Jersey, 132p.
Levy, J.M. & E.F. Connor. 2004. Are gardens effective in butterfl y conservation? A case study with the pipevine swallowtail,
Battus philenor. J. Insect Conserv. 8: 323-330.
Magurran, A. 1988. Ecological diversity and its measurement. Cambridge University Press, Cambridge, 192p.
Marcus, M.G. & T.R. Detwyler. 1972. Urbanisation and environment in perspective, p.3-25. In T.R. Detwyler & M.G. Marcus (eds.), Urbanisation and environment - The physical geography of the city, Duxbury, Belmont, 287p.
Martins, M. 1987. Variação espacial e temporal de algumas espécies e grupos de Drosophila (Diptera) em duas reservas de matas isoladas, nas vizinhanças de Manaus (Amazonas, Brasil). Bol. Mus. Para. Emilio Goeldi 3: 195-218.
Martins, M. 2001. Drosophilid fruit-fl y guilds in forest fragments, p.175-186. In R.O. Bierregard Jr., C. Gascon, T.E. Lovejoy & R. Mesquita (eds), Lessons from Amazonia: The ecology and conservation of a fragmented forest. Yale University Press, New Haven, 544p.
McIntyre, N.E. 2000. The ecology of urban arthropods: a review and a call to action. Ann. Entomol. Soc. Am. 93: 825-835.
McKinney, M.L. & J.L. Lockwood. 1999. Biotic homogenization: A few winners replacing many losers in the next mass extinction. Trends Ecol. Evol. 14: 450-453.
Navarro-Silva, M.A., A.A. Barbosa & D. Calado. 2004. Atividade
de Mansonia spp. (Mansoniini, Culicidae) em fragmento
fl orestal na área urbana de Curitiba, Paraná, Brasil. Rev. Bras. Zool. 21: 243-247.
Pavan, C. 1959. Relações entre populações de Drosophila e o meio ambiente. Bol. Fac. Filos. Ci. Letras USP 11: 1-81.
Pickett, S.T.A., M.L. Cadenasso, J.M. Grove, C.H. Nilon, R.V. Pouyat, W.C. Zipperer & R. Costanza. 2001. Urban ecological systems: Linking terrestrial ecology, physical, and socio-economic components of metropolitan areas. Ann. Rev. Ecol. Syst. 32: 127-157.
Prefeitura Municipal de Florianópolis, 2006. Prefeitura Municipal de Florianópolis [on line]. Acessed on April 05 2006.URL: http://www.pmf.sc.gov.br/
Ruszczyk, A. 1986/1987. Análise da cobertura vegetal da cidade de Porto Alegre, RS. Rev. Bras. Bot. 9: 225-229.
Saavedra, C.C.R., S.M. Callegari-Jacques, M. Napp & V.L.S. Valente. 1995. A descriptive and analytical study of four Neotropical Drosophilid communities. J. Zool. Syst. Evol. Res. 33: 62-74.
Sene, F.M., F.C. Val, C.R. Vilela & M.A.Q.R. Pereira. 1980. Preliminary date on the geographical distribution of Drosophila
species within morphoclimatic domains of Brazil. Pap. Avulsos Zool. 33: 315-326.
Sevenster, J.G. 1996. Aggregation and coexistence. I. Theory and analysis. J. Anim. Ecol. 65: 297-307.
Sevenster, J.G. & J.J.M. Van Alphen. 1996. Aggregation and coexistence.
II. Drosophila community. J. Anim. Ecol. 65: 308-324.
Shapiro, A. 2002. The Californian urban butterfl y fauna is dependent on alien plants. Divers. Distrib.8: 31-40.
Shorrocks, B. 1974. Niche parameters in domestic species of
Drosophila. J. Nat. Hist. 8: 215-222.
Silva, N.M., C.C. Fantinel, V.L.S. Valente & V.H. Valiati. 2005a. Ecology of colonizing populations of the fi gfl y Zaprionus
indianus (Diptera, Drosophilidae) in Porto Alegre, Southern
Brazil. Iheringia Ser. Zool. 95: 233-240.
Silva, N.M., C.C. Fantinel, V.L.S. Valente & V.H. Valiati. 2005b. Population dynamics of the invasive species Zaprionus
indianus (Gupta) (Diptera: Drosophilidae) in communities of
drosophilids of Porto Alegre city, Southern of Brazil. Neotrop. Entomol. 34: 363-374.
Smith, B. & J.B. Wilson. 1996. A consumer’s guide to eveness indices. Oikos 76: 70-82.
Sneath, P.H. & R.R. Sokal. 1973. Numerical taxonomy – The principles and practice of numerical classifi cation. Freeman & Co., San Francisco, xv+573p.
StatSoft Inc. 1998. STATISTICA for Windows [Computer program manual]. Tulsa. URL: http://www.statsoft.com
Sukopp, H. & P. Werner. 1982. Nature in cities – A report and view of studies and experiments concerning ecology, wildlife and nature conservation in urban and suburban areas. European Committee for the conservation of nature and natural resources. Council of Europe, Publications Section, Strasbourg, 98p.
Tidon, R. 2006. Relationships between drosophilids (Diptera, Drosophilidae) and the environment in two contrasting tropical vegetations. Biol. J. Linn. Soc. 87: 233-247.
Tidon, R. & F.M. Sene. 1988. A trap that retains and keeps
Drosophila alive. Drosophila Inf. Serv. 67: 89.
Tidon, R., D.F. Leite & B.F.D. Leão. 2003. Impact of colonisation
of Zaprionus (Diptera, Drosophilidae) in different ecosystems
of the Neotropical Region: 2 years after the invasion. Biol. Conserv. 112: 299-305.
Valente, V.L.S., A. Ruszczyk, R.A. Santos, C.B.C. Bonorino, B.E.P. Brum, L. Regner & N.B. Morales. 1989. Genetic and ecological studies on urban and marginal populations of Drosophila in the south of Brazil. Evol. Biol. (Bogota) 3: 19-35.
Valente, V.L.S., A. Ruszczyk & R.A. Santos. 1993. Chromosomal polymorphism in urban Drosophila willistoni. Brazil. J. Genet. 16: 307-319.
Valiati, V.H. & V.L.S. Valente. 1996. Observations on ecological parameters of urban populations of Drosophila paulistorum
Dobzhansky & Pavan (Diptera, Drosophilidae). Rev. Bras. Entomol. 40: 225-231.
Wheeler, M.R. & M.P. Kambysellis. 1966. Notes on the Drosophilidae (Diptera) of Samoa. Univ. Texas Publ. 6615: 533-565.
Wolda, H. 1981. Similarity indices, sample size and diversity. Oecologia (Berl.) 50: 296-302.
Wood, B.C. & A.S. Pullin. 2002. Persistence of species in a fragmented urban landscape: The importance of dispersal ability and habitat availability for grassland butterflies. Biodivers. Conserv. 11: 1451-1468.
Zapparoli, M. 1997. Urban development and insect biodiversity of the Rome area, Italy. Landsc. Urban Plann. 38: 77-86.
Zar, J.H. 1999. Biostatiscal analysis. Prentice Hall, Upper Saddle River, xii+663p.