THE PORTO PRIMAVERA DAM AND THE FLUVIAL TRANSPORT
ON THE PORTO SÃO JOSÉ SECTION, PARANA RIVER
barragem de Porto Primavera e o transporte luvial na seção de Porto São José, Rio Paraná
Edvard Elias Souza Filho *
(*) Lecturer, Doctor of the State University of Maringá (Universidade Estadual de Maringá) - Avenida Colombo, 5790, CEP
87020-900, Maringá (PR), Brasil. Tel: (+55 44) 3031-4290 - eesilho@uem.br
Resumo
A barragem de Porto Primavera provocou a diminuição da concentração da carga suspensa e a redução do
porte das formas de leito do rio Paraná, mas os efeitos de sua construção sobre o transporte luvial ainda não foram quantiicados. Por esta razão, este trabalho tem como objetivo avaliar a inluência da barragem
sobre o transporte de sedimentos na seção de Porto São José. Para isso foram analisados os dados da série
histórica da estação luviométrica de Porto São José e as informações existentes na literatura. Foi utilizada análise de regressão para que a correlação entre a descarga luvial e o transporte de sedimentos pudesse ser deinida e as equações obtidas foram utilizadas para estimar o transporte em diferentes períodos de tempo.
O transporte em suspensão antes da construção era de 214,1 kg/s, passou a ser de 222,2 kg/s durante a obra e diminuiu para 56,4 kg/s depois da barragem. O transporte de fundo era de 99,7 kg/s durante a construção, diminuiu para 86,2 kg/s em 1999 e 2000 e para 41,2 kg/s após 2001. O transporte total diminuiu de 321,9
para 177,8 e inalmente para 91,2 kg/s no mesmo período. Tais resultados permitiram concluir que a barragem reduziu o transporte em suspensão em 74,6%, o transporte de fundo em 58,7%, o transporte total em 71,7% e aumentou a proporção da carga de fundo de 33,9% para 44,5% do total.
Palavras-chave: Transporte sedimentar; Impacto de barragem; UHE Porto Primavera; Rio Paraná.
Abstract
The Porto Primavera Dam caused the decrease of the concentration of suspended load and reduction of the
size of the bed forms of Paraná River, but the efects of the construction on luvial transport have not yet been quantiied. In order to do that, this paper aims to evaluate the inluence of the dam on the sediment transport in the section of Porto São José. Thus, data of Porto São José Fluviometric Station, ield and or
-bital images information available in literature were used. The data were analyzed by linear regression to obtain signiicant correlation between sediment transport and river discharge. The equations with signiicant coeicient of determination were used to estimate the annual average transport for diferent time periods.
The suspended transport before construction was 214.1 kg/s, increased to 222.2 kg/s during construction and decreased to 56.4 kg/s after completion of the dam. The bed load transport was 99.7 kg/s during the construction, decreased to 86.2 kg/s during 1999 and 2000 and to 41.2 kg/s after 2001. In the same period
the total transport decreased from 321.9 kg/s to 177.8 and inally to 91.2 kg/s. These results indicated that the Porto Primavera Dam reduced 74.6% of the suspended transport, 58.7% of the bed load transport, 71.7% of the total transport and increased the proportion of the bed load of 33, 9% to 44.5% of total.
Key words: Sediment transport; Impact of dam; UHE Porto Primavera; Parana River.
Résumé
Le barrage Porto Primavera a causé la diminution de la concentration de charge suspendue et la réduction
de la taille des formes du fond de la rivière Paraná, mais les efets de la construction sur le transport luvial n’ont toujours pas été quantiiés. Pour cette raison, ce document vise à évaluer l’inluence du barrage sur le
transport de sédiments dans la section de Porto São José. Ainsi, les données la série temporelle de la station
de jaugeage de Porto São José et les informations existantes dans la littérature ont été utilisés. L’analyse
de régression a été utilisée pour s’assurer que la corrélation entre le débit de la rivière et le transport des
sédiments pourraient être déinis et les équations obtenues ont été utilisées pour estimer le transport au cours des diférentes périodes de temps. Le transport en suspension avant la construction était de 214,1 kg/s, en est venu à être 222,2 kg/s pendant les travaux et a diminué à 56,4 kg/s après le barrage. Le transport par charriage a été de 99,7 kg/s au cours de la construction, a diminué à 86,2 kg/s au cours de l’année 1999 et 2000 et de 41,2 kg/s après 2001. Dans la même période, le transport solide total a diminué, passant de 321,9 kg/s à 177,8 et enin à 91,2 kg/s. Ces résultats ont montré que le barrage a réduit le transport en suspension dans 74,6 % , le transport par charriage dans 58,7 % , le transport solide total de 71,7% et a augmenté la proportion de la charge de fond de 33,9 % pour 44,5 % du total.
66
INTRODUCTION
The formation of the reservoir of a dam modiies luvial transport in the segment located do -wnstream because it transforms a particular lotic segment into a lentic body of water. The reduced
speed of the low causes the sedimentation of the bedload in the vicinity of the backwater. The
suspended load can settle partly or completely and the dissolved load itself can be altered according
to the new physical / chemical conditions of the artiicial lake.
The degree of interference depends on several variables, notably the size of the reservoir, the
mode of operation, the residency time of the water, the type and location of the spillways and inlets and the physical-chemical characteristics of the water. This issue is not new in the literature and several authors have addressed it, such as Petts (1979, 1984), Grimshaw & Lewin (1980), Williams & Wolman (1984), Chien (1985), Petts & Gurnall (2005), among many others.
The Porto Primavera Dam (UHE Eng. Sergio Motta) began to interfere with the Paraná River
channel in late 1991, when coferdams were used to construct the concrete structures (irst phase of deviation). Between 1992 and 1994, the river only lowed in half the channel and from 1995 it started to low in the newly constructed spillways as the free half of the channel had been isolated
for the construction of the dam’s remaining structures.
Construction ended in 1998 and the reservoir began to form in November of that year. The
following year, Souza Filho (1999) predicted the reduction of the suspended load and the retention
of the bedload. The decrease in the concentration of suspended sediment and the transport had
already been veriied during construction of the dam by samples taken between 1993 and 1995 (STEVAUX & TAKEDA, 2002) and was conirmed by Crispin (2001). The cut in the bedload supply was veriied by ield surveys conducted in 2000 near the dam (ROCK & SOUZA FILHO, 2008) and ratiied by Martins & Stevaux (2006) and Martins et al. (2009). The dissolved load was also modiied and the river lost phosphorus, iron, silicon, magnesium, calcium, strontium, manganese, zinc, cadmium, lead, aluminum, barium, cobalt and copper but there was an increase in potassium, sodium, chrome and nickel (SOUZA FILHO et al. 2010).
The information available in these articles indicates that luvial transport decreased from the
beginning of the construction of the dam, but the magnitude of this reduction has not been assessed
yet. That is, all the evidence points to a conirmation of this change, but the intensity with which
it occurred is still unknown.
For this reason, the objective of this study is the evaluation of detrital transport in the Porto
São José section of the Paraná River in the period prior to the dam, during its construction and in
the period after construction, in order to ascertain the inluence the UHE Porto Primavera had on
this variable.
STUDY AREA
The Porto São José section is located in the middle part of the Upper Paraná River, just over
35 km downstream of the Porto Primavera Dam and nearly 12 kilometers below the mouth of the
Paranapanema River (Figure 1).
This site serves as a reference section for the studies of the Paraná River, as in addition to being
located in a single channel it has had an active luviometric station since October 1963 (Station
67 Figure 1 - Location of the Porto São José section (ETM image cropped, 223/076 of 11/18/1999).
The section is 1140 meters wide and is asymmetric because the thalweg is located near the left
bank (Figure 2). The average low rate recorded between 1964 and 2012 was 8822 m3/s (average height of 3.35 m), with a minimum value of 2551 m3/s (0.27 m) and a maximum of 33698 m3/ s
(8.74 m).
Figure 2 - Section of Porto São José (Modiied from Martin & Stevaux, 2005).
The transport of suspended sediment was evaluated by several authors (STEVAUX, 1994; STEVAUX & TAKEDA, 2002; CRISPIM, 2001), but all these estimates were carried out for
spe-ciic periods and the total information available is greater than those already evaluated. The oldest
data were obtained by the DNAE in 1979 and by ITAIPU BINACIONAL in the period 1986-1988,
by ield sampling. In the latter case, the company calculated the average transport of 856 kg/s for
the three years sampled (ITAIPU BINACIONAL, 1990).
68
the HIDROWE website maintained by ANA. The section has also been monitored by researchers from the UEM, who conducted systematic surveys in the periods 1993-1995 and 2000-2001. The average values for the samples are shown in Table 1.
Table 1 - Number of collections and average values of concentration and suspended transport obtained by the various samples taken from the river section
Period 1979 1986-1988 1986-2001 1993-1995 2000-2001 Source ANA Stevaux (1994) ANA Stevaux & Takeda (2002) Crispim (2001)
Number 13 14 44 26 13
Concentration (mg/l) 65,2 24,9 11,4 14,8 10,8
Transport (kg/s) 468 209,3 101,2 142,7 85,6
The data in Table 1 do not represent the average concentration in the periods, but only the ave-rage of the samples taken. The same can be said regarding the values for transport. However, they show that there was a clear reduction in the transport in suspension during the construction period and after the completion of the works, especially when the information for the period between 1986 and 2001 are separated into distinct time intervals (Table 2).
Table 2 - Average concentration and average suspended transport of samples collected in 1986-1991, 1992-1998 and 1999-2001
Period 1986-1991 1992-1998 1999-2001
Source ANA
Number 19 15 10
Concentration (mg/l) 17,4 9 3,6
Transport (kg/s) 157,2 80 26,2
In addition to the ield data, imaging also obtained information about the concentration of se
-diment in the Porto São José section, according to Montanher & Souza Filho (2010, 2011 and 2015)
and Águas et al. (2013). Table 3 shows the average values of sediment concentration obtained by the
aforementioned authors and the average transport calculated from the concentration and low data.
Table 3 - Average concentration and suspended transport obtained from satellite images
Period 1984-1991 1992-1998 1999-2011 1984-1991 1993-1997 1999-2011 Source Montanher & Souza Filho (2010, 2011, 2015) Águas et al. (2013)
Number 44 23 73 7 9 24
Concentration (mg/l) 27 20,7 5,5 138,5 135 5,6
Transport (kg/s) 258,7 209,8 51,8 1115,8 1119,7 43,4
The concentration values obtained by Águas et al. (2013) for the intervals between 1984 and
1991 and between 1993 and 1997 are much higher than those obtained by Montanher & Souza Filho (2010, 2011 and 2015) and from ield data (Tables 1 and 2), which provided very high va -lues for sediment transport. On the other hand, the va-lues obtained by the other two authors have
similar orders of magnitude to those obtained in the ield, although higher. In both cases, there is
considerable reduction in the average value of both variables after the formation of the reservoir. The transport of the bedload is still poorly understood, because there is very little information
available. The irst evaluation was carried out by ITAIPU BINACIONAL (1990), which reached
69
discharge corresponded to 32.3% of the suspended load, a valid ratio for the transport in the period
before 1998 (ITAIPU BINACIONAL, 1996). Since direct measurements were not carried out, it is not possible to consider the results.
The only two ield evaluations conducted in the Porto São José section available in the lite -rature occurred in 2002 and 2003 (MARTINS & STEVAUX, 2005) and between 2005 and 2007
(MARTINS et al., 2009). Overall six surveys were carried out, whose results are shown in Table 4.
Table 4 – Bedload transport in the Porto São José section, according to Martins & Stevaux (2005) and Martins et al. (2009)
Months Year Transport (kg/s) Average discharge (m3/s)
November December 2002 34,03 6257
June July 2003 31,36 6762
November December 2003 32,55 7625
July 2005 32,59 9769
May 2006 37,71 7953
January February 2007 115,23 18136
Since there is no data prior to that displayed in Table 4, it is not possible to assess the dam’s
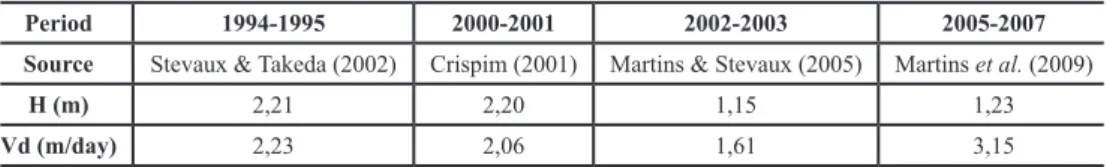
efect on this variable. However, the variation in the size of the subaqueous dunes and their speed of displacement (Table 5) show that it is very likely that the bedload transport has also been modiied.
The variation in the height of the dunes may be more important than the change in their speed of displacement because apparently the dam did not modify this last variable, since it depends on
luvial discharge, as shown by Souza Filho & Rigon (2012). According to these authors the dis
-placement speed of the dunes (Vd) is a function of luvial discharge, a relation expressed by Vd = -29.3034+0.0108.Q, with a coeicient of determination of 0.8842 and an error of 3.9 m/month.
Table 5 - The average height variation (H) and the displacement speed of the subaqueous dunes (Vd) in the period between 1994 and 2007
Period 1994-1995 2000-2001 2002-2003 2005-2007 Source Stevaux & Takeda (2002) Crispim (2001) Martins & Stevaux (2005) Martins et al. (2009)
H (m) 2,21 2,20 1,15 1,23
Vd (m/day) 2,23 2,06 1,61 3,15
The transport of the dissolved load has never been evaluated because systematic surveys were not carried out for this variable. The concentration data of some elements were obtained in some
surveys such as Rauber et al. (1992), Thomaz et al. (1992, 1994) Zanetti et al. (2009), but none
evaluated the total dissolved load.
METHODOLOGY
This work was developed by collecting the information available in the literature and institu-tional databases. In the case of the literature review on transport in suspension, emphasis was given to approaches that had the following characteristics: a) systematic collections carried out for a
sig-niicant period on the Porto São José section; b) they presented data on the sediment concentrations
and the day of collection; c) they made clear what form of sampling was used to obtain the data. This selection was necessary because the section under study is very large and the variability of the concentration of suspended sediment is very high. Therefore, it is prudent for the statisti-cal analysis to be made using data, which can be compared with each other, either with regard to location, or with regard to the number of samples. Similarly, the requirement of the date and the
70
selection reduced the number of sources to the work of Crispin (2001), Montanher & Souza Filho
(2010, 2011 and 2015), Águas et al. (2013) and the historical series from stations in Porto São José and Porto São José Downstream.
The data analysis was initiated by the formation of four spreadsheets in Microsoft Excel, with
the dates and sediment concentrations. A sheet was prepared for each of the data sets: Crispim
(2001), Montanher & Souza Filho (2010, 2011 and 2015), Águas et al. (2013) and the stations of
Porto São José and Porto São José Downstream (ANA data).
The value of the luvial discharge on the respective date was added to the initial data, with reference to the historic series of low for the aforementioned stations. The transport on each day was calculated by multiplying the concentration value by the value of luvial discharge. The trans -port values shown in the columns 1979 and 1986 to 2001 of Table 1 and Table 3 were obtained in this fashion.
However, the concentration of sediment and river discharge has a high temporal variability, which causes this characteristic in the transport in suspension. That is, the transport is a continuous and highly variable process. In this case, the most appropriate evaluation should be continuous, which unfortunately is not possible. Among the aforementioned variables, the only one that appro-aches this continuity is the discharge, since there are daily average values, although these values are inferred from the water level measurements.
Thus, a way to transform the data on concentration (and transport), which are discrete and few, into daily data (almost continuous) is to establish a correlation between concentration and
discharge or between transport and low. If the concentration of suspended sediment is dependent
on the liquid discharge, the average daily value can be calculated from the data on average daily
low, which would allow the attainment of the value of average daily transport. If transport were dependent on the discharge, the daily average value would be a function of the average daily low.
Therefore, the processing of the data sought to verify the existence of a correlation between
the discharge and the other two variables. The equations that describe the relations between the variables were obtained by regression analysis using the STATISTICA “software”.
Each of the sheets was analyzed separately because the data were obtained in diferent ways. In addition, the data were grouped into diferent time slots, because apparently the Porto Primavera dam modiied the sediment transport. Statistical analysis was initially performed for the year 1979
and for the periods 1986-1992, 1993-1998 and 1999-2001 (data from ANA). Crispim’s (2001)
data covered the period 2000-2001, whereas Montanher & Souza Filho’s (2010, 2011 and 2015)
data were divided into the intervals 1984-1992, 1993-1998 and 1999-2011. Data from Águas et al. (2013) were grouped in the periods 1984-1991, 1993-1997 and 1999-2011.
After the analyses were carried out, each period was subdivided again by the interval of one
year in order to assess which set had best determination coeicient. The equations with a better correlation coeicient were used for the calculation of the transport for the respective period and
the results were compared.
In the case of bedload transport, the authors used the volume of the bed forms and the displa-cement speed to assess the transport of bed sediments in the section of Porto São José (MARTINS & STEVAUX, 2005 and MARTINS et al., 2009). However, the transport values obtained refer to the periods in which the surveys were conducted and do not allow the evaluation of the transport performed by the Paraná River in the period after the dam. To carry out such a calculation it is also necessary to establish a relationship between the bed transport and river discharge.
The relationship between the bed transport and luvial discharge was established through re
-gression analysis between the low and transport, from the data obtained in each survey of the two
aforementioned authors. However, the equation obtained cannot be applied prior to 1999 because the dunes were higher (Table 5), furthermore, they may not be applied to the years 2000 and 2001
71 As the data prior to the completion of the dam are limited to the height and displacement
spe-ed of subaqueous dunes, it is necessary to establish a relationship between these variables and the
transport of bed sediments. Since the displacement speed is a function of the discharge (Souza Filho
& Rigon, 2012) and apparently, the height of the dunes remained stable between 1994 and 2001, these variables can be used to estimate the bed transport in the period of construction of the dam.
Unfortunately, the assessment of bed sediment transport in the period prior to the start of construction cannot be done because the only information about the height of the dunes is that they
varied from 1.5 to 7.0 m (Stevaux, 1994). This information is not suicient to perform a reliable
calculation.
RESULTS AND DISCUSSION
TRANSPORT IN SUSPENSION IN THE PERIOD PRIOR TO CONSTRUCTION OF THE PORTO PRIMAVERA DAM
The analysis of the regression data for1979 (ANA) showed that there was a high ratio of
dependence between the sediment concentration and transport in suspension, while the luvial discharge had little inluence on the variable, as shown by the values of the coeicient of determi -nation shown in Table 6.
Table 6 - Coeicient of determination values (r2) of the linear regression between the variables: discharge, concentration and suspended transport, obtained in 1979
Concentration Transport
Fluvial Discharge 0,2346 0,4259
Concentration 0,9529
The equation that describes the relationship between the discharge and transport in suspension (Ts) is Ts = -676.8416+0.1627.Q with a standard error of 164.29 kg/s. Since the average dischar-ge (Q) in 1979 was 8300 m3/s, the averadischar-ge annual value of transport in 1979 would be 673.57 ± 164.29 kg/s.
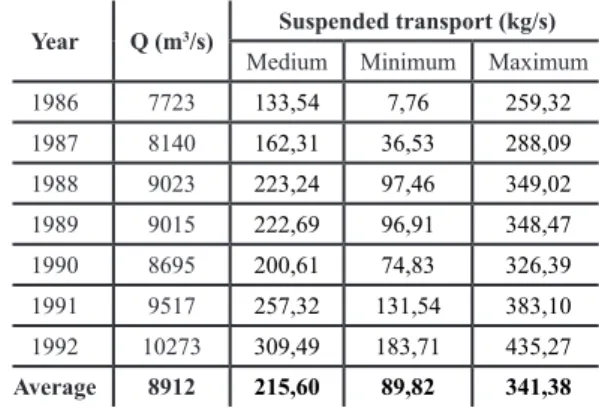
Data analysis of the period between 1986 and 1992 (ANA) again demonstrated a high ratio between concentration and transport (r2 of 0.9601) and a low relationship between the discharge and the concentration or the transport (r2 of 0.2402 and 0.4575, respectively). The resulting equation of the linear regression between discharge and transport is Ts = -399.3482+ 0.069.Q with a standard error of 125.78 kg/s. The use of values for the annual average discharge for the period obtained the results shown in Table 7.
Table 7 - Average annual discharge (Q) and suspended transport (medium, minimum and maximum) in the Porto São José’s section José between 1986 and 1992 (ANA)
Year Q (m3/s) Suspended transport (kg/s)
Medium Minimum Maximum
1986 7723 133,54 7,76 259,32
1987 8140 162,31 36,53 288,09
1988 9023 223,24 97,46 349,02
1989 9015 222,69 96,91 348,47
1990 8695 200,61 74,83 326,39
1991 9517 257,32 131,54 383,10
1992 10273 309,49 183,71 435,27
72
Despite the margins of error, the transport in suspension in between 1986 and 1992 was less
than that estimated for the year 1979 as the largest maximum value of the period (435.3 k/s in 1992)
is below the minimum value for 1979 (509.3 kg/s).
The regression analyzes involving part of the period had higher coeicients of determination
for the biennium 1986-1987 (0.6078), for 1987 (0.6529) and for 1988 (0.5584), allowing the results
to be reined, according to Table 8.
Table 8 - Equations resulting from the linear regression analysis between the discharge and transport, the coeicient of determination (r2), standard error and suspended transport (medium, minimum and maximum)
in the biennium 1986-1987 and in 1987 and 1988 (ANA)
Year Equations r2 Standard error Suspended transport (kg/s)
Medium Minimum Maximum
1986
Ts=-675,4201+0,1102.Q 0,6078 87,00 175,66 88,66 262,66
1987 221,61 134,61 308,61
1987 Ts=-667,7707+0,1112.Q 0,6529 68,98 237,40 168,02 306,38
1988 Ts= -344,3033+0,0631.Q 0,5584 105,03 225,05 120,02 330,08
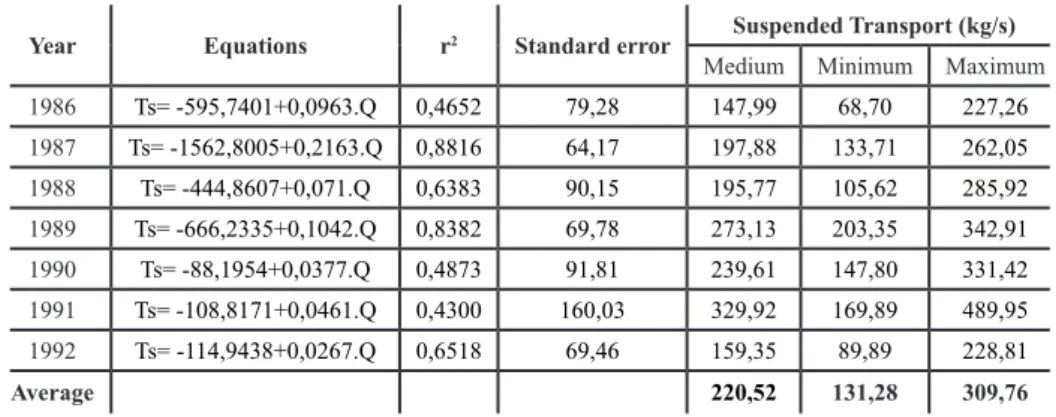
The data obtained by Montanher & Souza Filho (2010, 2011 and 2015) for 1984-1992 showed a high coeicient of determination for the linear regression between the concentration and transport (r2 of 0.8485) and low coeicients for the regressions performed with the discharge. The highest
rate was obtained in the regression between the discharge and transport (r2 0.3840), but it is too low for the equation obtained to be used reliably. However, the analyses carried out year by year had
better coeicient of determination values for the years 1986-1992; the results are shown in Table 9.
Table 9 - Equations resulting from the linear regression analysis between discharge and transport, the coeicient of determination (r2), standard error and annual suspended transport (medium, minimum
and maximum) between 1986 and 1992 (MONTANHER & SOUZA FILHO, 2010, 2011 and 2015)
Year Equations r2 Standard error Suspended Transport (kg/s)
Medium Minimum Maximum
1986 Ts= -595,7401+0,0963.Q 0,4652 79,28 147,99 68,70 227,26
1987 Ts= -1562,8005+0,2163.Q 0,8816 64,17 197,88 133,71 262,05
1988 Ts= -444,8607+0,071.Q 0,6383 90,15 195,77 105,62 285,92
1989 Ts= -666,2335+0,1042.Q 0,8382 69,78 273,13 203,35 342,91
1990 Ts= -88,1954+0,0377.Q 0,4873 91,81 239,61 147,80 331,42
1991 Ts= -108,8171+0,0461.Q 0,4300 160,03 329,92 169,89 489,95
1992 Ts= -114,9438+0,0267.Q 0,6518 69,46 159,35 89,89 228,81
Average 220,52 131,28 309,76
The analysis of the data by Águas et al. (2013) for the period 1984-1991 showed that the
concentration has a strong inluence on the transport (r2 of 0.9967) and the discharge does not inluence the concentration of sediment or the transport (r2 less than 0.01). The analysis of annual
data cannot be performed because the number of samples in each year is very low.
Field data obtained by ANA and the data obtained by satellite images (MONTANHER & SOUZA FILHO, 2010, 2011 and 2015) resulted in similar values for the transport of suspended load, although when considering the coeicient of determination, the transport estimated by image
was more reliable.
TRANSPORT IN SUSPENSION DURING THE CONSTRUCTION OF THE PORTO PRIMAVERA DAM
The analysis of data obtained by ANA for the 1993-1998 period had a lower coeicient of
determination than the previous ones for the regression between concentration and transport (r2
73
relationship (r2 of 0.3190). However, the values of the coeicient of determination between the discharge and transport in the period 1993-1994 and 1998 were signiicant and allowed for the use
of the respective equations to evaluate the transport averages of these three years (Table 10).
Table 10 - The average annual discharge (Q), resulting equations of the linear regression analysis between the discharge and the suspended transport, the coeicient of determination (r2), standard error and annual
suspended transport (medium, minimum and maximum) in 1993, 1994 and 1998 (ANA)
Year Q (m3/s) Equations r2 Standard error Suspended transport (kg/s)
Medium Minimum Maximum
1993 9523
Ts=210,8723-0,0187.Q 0,7871 7,58 32,792 25,212 40,372
1994 8708 48,033 40,453 55,613
1998 9450 Ts=-139,1284+0,0225.Q 0,7525 24,63 73,497 48,867 98,127
Average 51,44 38,18 64,70
Montanher & Souza Filho’s data (2010, 2011 and 2015) covering the construction period of the dam showed signiicant results for the regression analysis between discharge and transport (r2
of 0.7039) and the resulting equation (Ts = -221.1345+0.0471.Q) showed an error of 71.88 k/s. The resulting values are shown in Table 11.
Table 11 - Average annual discharge (Q) and annual suspended transport (medium, minimum and maximum) in the section and Porto São José between 1993 and 1998 (MONTANHER & SOUZA FILHO, 2010, 2011 and 2015)
Year Q (m3/s) Suspended transport (kg/s)
Medium Minimum Maximum
1993 9523 227,40 155,52 299,28
1994 8708 189,01 117,13 260,89
1995 9175 211,01 139,13 282,89
1996 8112 160,94 89,06 232,82
1997 9980 248,92 177,04 320,80
1998 9450 223,96 152,08 295,84
Average 9158 210,21 138,33 282,09
The analysis of annual data obtained higher coeicient of determination values for the years
1993 to 1995 and for 1997, which permitted a more reliable estimate of the average transport for these years (Table 12).
Table 12 - Equations resulting from the linear regression analysis between the discharge and suspended transport, the coeicient of determination (r2), the standard error and annual suspended
transport (medium, minimum and maximum) for the period between 1993 and 1995 and for 1997 (MONTANHER & SOUZA FILHO, 2010, 2011 and 2015)
Year Equations r2 Standard error Suspended transport (kg/s)
Medium Minimum Maximum
1993 Ts= 12,425+0,0309.Q 0,9073 56,83 306,69 249,86 363,52
1994 Ts= -212,6656+0,0459.Q 0,7576 78,86 187,03 108,17 265,89
1995 Ts= -235,5431+0,0385.Q 0,8368 12,46 117,69 105,23 130,15
1997 Ts= -889,6977+0,1229.Q 0,7534 70,67 336,84 266,17 407,51
Average 237,06 182,36 291,77
The data of the regression analysis obtained by Águas et al. (2013) for the period 1993 1997
74
During the period when the dam was built, the ield data showed that the diversion of the river caused a signiicant reduction of transport in suspension, since the average value of the three years
was 51.44 kg/s, whilst during the period from 1986 to in 1992 the average was 215.6 kg/s. On the
other hand, Montanher & Souza Filho’s (2010, 2011 and 2015) data demonstrate that the transport
of the suspended load remained equivalent to how it was before, as the average was greater than 200 kg/s.
TRANSPORT IN SUSPENSION AFTER THE PORTO PRIMAVERA DAM
The ield data of the regression analysis obtained by ANA for the period 1999-2001 showed that
it was not possible to establish a relation between the discharge and the sediment concentration (r2 of 0.0312) or the transport in suspension (r2 of 0.0910). The 1999 data demonstrated a reasonable
ratio between low and transport once the determination coeicient was 0.5471. The equation Ts
= -101.8959+0.0174.Q permitted the calculation of the average transport for that year, which was 53.24 kg/s for an average discharge of 8916 m3/s with a margin of error of ± 17.53 kg/s.
The analysis of Montanher & Souza Filho’s data (2010, 2011 and 2015) for the period be -tween 1999 and 2011 also did not obtain a reliable ratio both be-tween the discharge and be-tween concentrations as between the former and transport (r2 of 0.1389 and 0.3698, respectively). The
analysis of the annual data obtained coeicients of determination with signiicant values for the years 1999, 2001, 2007, 2008, 2010 and 2011. In addition, signiicant values were obtained for
the periods 1999-2000, 2002-2005, 2004-2005, 2005-2006 and 2009-2010. The average annual
transport for each year was calculated from equations with higher coeicients of determination;
the results are shown in Table 13.
Table 13 - Average annual discharge (Q), equations resulting from the linear regression analysis between the discharge and transport, the coeicient of determination (r2), standard error
and annual suspended transport (medium, minimum and maximum) between 1999 and 2011 (MONTANHER & SOUZA FILHO, 2010, 2011 and 2015).
Year Q (m3/s) Equations r2 Standard error Suspended transport (kg/s)
Medium Minimum Maximum
1999 8916 Ts=-703,6629+0,0935.Q 0,7919 23,21 129,98 106,77 153,19
2000 7903 Ts=-425,5525+0,0606.Q 0,5908 38,47 53,37 14,90 91,84
2001 6115 Ts=-33,334+0,0102.Q 0,6105 17,89 29,04 11,15 46,93
2002 7351
Ts=-56,3876+0,0126.Q 0,7287 18,44 36,24 17,80 54,68
2003 7779 41,63 23,19 60,07
2004 7417
Ts=-44,5021+0,012.Q 0,9127 12,25 44,50 32,25 56,75
2005 8320 55,34 43,09 67,59
2006 8650 Ts=-54,7631+0,0121.Q 0,8455 24,99 49,90 24,91 74,89
2007 9313 Ts=-40,7236+0,0098.Q 0,7611 29,39 50,54 21,15 79,93
2008 8141 Ts=-250,6975+0,0354.Q 0,7925 26,82 37,49 10,67 64,31
2009 9042 Ts=-88,6774+0,0156.Q 0,7096 30,15 52,38 22,23 82,53
2010 9935 Ts=-101,8127+0,0162.Q 0,8162 33,10 59,13 26,03 92,23
2011 9363 Ts=-141,9566+0,0252.Q 0,6770 37,69 93,99 56,30 131,68
Average 8327 56,43 31,57 81,28
The average transport in 1999, calculated from Montanher & Souza Filho’s data (2010, 2011 and 2015), was much higher than that estimated from the ield data, but the coeicient of determi
-nation gives greater security to the irst. The ield data indicates that in 1999 the transport continued with the same order of magnitude as that calculated for the construction period (just over 50 kg/s).
75
The analysis of the data from Águas et al. (2013) did not achieve signiicant values for the
period between 1999 and 2011, or for the various annual combinations that could be made. In turn,
analysis of these authors’ data with other image data obtained signiicant values in various combi
-nations, but the coeicient of determination was always lower to those obtained from Montanher & Souza Filho’s information (2010, 2011 and 2015).
An analysis of the data obtained in the ield by Crispim (2001) in 2000-2001 demonstrated that
both the concentration of sediment and transport in suspension are unrelated to the river discharge,
since the coeicient of determination for both linear regressions was less than 0.1.
THE BEDLOAD TRANSPORT
The regression analysis of the data of Martins & Stevaux (2005) and Martin et al. (2009) showed that the luvial discharge strongly inluences the bed transport, because the coeicient
of determination obtained was 0.9231. The resulting equation for the analysis is Tf = -20.7825+ 0.0072.Q, with a standard error of 10.35 kg/s the application of this equation allowed the calcula-tion of the annual bed transport in the period after the dam (Table 14). The values obtained for the period between 1999 and 2002 will be re-discussed below.
Table 14 - Average annual discharge (Q) and annual bedload transport (medium, minimum and maximum) in the section of Porto São José, between 1999 and 2011 (data: MARTINS & STEVAUX, 2005; MARTINS et al., 2009)
Year Q (m3/s) Bedload transport (kg/s)
Medium Minimum Maximum
1999 8916 43,41 33,06 53,76
2000 7903 36,12 25,77 46,47
2001 6115 23,25 12,90 33,60
2002 7351 32,14 21,79 42,49
2003 7779 35,23 24,88 45,58
2004 7417 32,62 22,27 42,97
2005 8320 39,12 28,77 49,47
2006 8650 41,50 31,15 51,85
2007 9313 46,27 35,92 56,62
2008 8141 37,83 27,48 48,18
2009 9042 44,32 33,97 54,67
2010 9935 50,75 40,40 61,10
2011 9363 46,63 36,28 56,98
Average 8327 39,17 28,82 49,52
The calculation of the bedload transport between 1993 and 1998 was based on the equation obtained by regression analysis between the product of the dune height (H) by their displacement
velocity (Vd) and sediment transport. This analysis had the highest coeicient of determination
of all the combinations (r2 of 0.9851), with an error of 0.21 k/s. The resulting equation was Tf = -12.8445+21.9417 (H.Vd).
The rate of average annual displacement of the dunes was calculated from the equation Vd =
-29.3034+0.0108.Q (SOUZA FILHO & RIGON, 2012) and a margin of error of 3.9 m/month was
76
Table 15 - Average annual discharge (Q) and displacement speed of subaqueous dunes (medium, minimum and maximum), in the period between 1993 and 2001
Year Q (m3/s) Displacement speed (m/day)
Medium Minimum Maximum
1993 9523 2,45 2,32 2,58
1994 8708 2,16 2,03 2,29
1995 9175 2,33 2,20 2,46
1996 8112 1,94 1,81 2,07
1997 9980 2,62 2,49 2,75
1998 9450 2,43 2,30 2,56
1999 8916 2,23 2,10 2,36
2000 7903 1,87 1,74 1,20
2001 6115 1,23 1,10 1,36
To obtain the product between the displacement velocity of the dunes and their average height the value of 2.21 m was used for the period between 1993 and 1998 (STEVAUX & TAKEDA, 2002) and the value of 2.20 m (CRISPIM, 2001) for the period between 1999 and 2001. The values obtained were used to estimate the bed transport; the results are in Table 16. The margin of error was not considered because it is very low.
Table 16 - Values of the product between the height of the subaqueous dunes (H) and their displacement velocity (Vd) and the annual bed transport (medium, minimum and maximum), in the period between 1993 and 2001
Year H.Vd med H.Vd min H.Vd max Bedload transport (kg/s) Medium Minimum Maximum
1993 5,42 5,13 5,71 106,03 99,73 112,34
1994 4,77 4,48 5,06 91,80 85,50 98,11
1995 5,14 4,85 5,43 99,96 93,65 106,26
1996 4,30 4,01 4,58 81,40 75,10 87,70
1997 5,78 5,49 6,07 114,01 107,71 120,31
1998 5,36 5,07 5,65 104,76 98,45 111,06
1999 4,91 4,63 5,20 94,95 88,67 101,22
2000 4,11 3,82 4,40 77,34 71,07 83,62
2001 2,69 2,41 2,98 46,27 39,99 52,55
Average 90,72 84,43 97,02
The use of the height of the sand dunes obtained by Crispim (2001) demonstrates that it is likely that the transport in the period 1999 to 2001 was greater than shown in Table 14. The option for the results in Table 16 is because the bed forms only started to lose volume from 2002, as
dis-cussed by Martin & Stevaux, (2005).
TEMPORAL CHANGES OF DETRITAL TRANSPORT
The results show that the transport in suspension was much higher in 1979 than in any year between 1986 and 2011. The average value in 1979 (676.57 kg/s) is almost four times higher than that estimated for 1986 (175.66 kg/s). This reduction is not related to the Porto Primavera dam and
cannot be associated with the hydroelectric plants located upstream, as the UHE Jupiá, located just
77 The average transport in suspension in the period between 1986 and 1992 was 214.10 (± 85.45)
kg/s, increased to 222.19 (± 60.43) kg/s in the period between 1993 and 1998, and reduced to 56.43
(± 24.86) kg/s between 1999 and 2011. Despite annual variations (Figure 3), sediment transport in suspension was apparently not afected by dam construction, although annual variations were higher during this period. The same cannot be said with regard to the formation of an artiicial lake, because after this, the reduction of the discharge of solids in suspension was 74.6%.
Figure 3 - The annual variation of suspended sediment transport (SST) in the Porto São José section in the period between 1986 and 2011
The bedload transport was also reduced by the formation of the reservoir. The average trans-port estimated for the period between 1993 and 1998 was 99.66 (± 6.3) kg/s, while the average of
the period 1999-2011 was 48.08 (± 11.42) kg/s, that is, the bedload transport was reduced by 52%. However, the luvial response to the cutting of detrital supplies promoted by UHE Porto Pri -mavera was slow to reach the Porto São José section. In 1999 the bedload transport (94.95 kg/s) was still equivalent to the previous period, while in the year 2000 it was slightly lower (77.34 kg
/s), but still within the annual variation of that period (Figure 4). If the range between 1993 and
2000 is considered, the average bedload transport was 96.28 (± 6.3) kg/s in the period and between
2001 and 2011, it was 41.15 (± 9.98) kg/s. That is, the reduction was even higher, reaching 58.7% of
78
Figure 4 - Annual transportation variation of bed sediments (BLT) in the Porto São José section in the period between 1993 and 2011
Since the dam reduced transport in suspension and bed transport, the detrital transport was
also reduced (Figure 5). The average solid detrital discharge between 1993 and 1998 was at least
321.85 (± 66.73) kg/s, 224.93 (± 29.49) kg/s in 1999, 130.71 (± 45.03) kg/s in 2000, and decreased
to 91.17 kg/s between 2001 and 2011, that is, the reduction was at least 71.7%.
Figure 5 - Annual variation of total transport of detrital sediments (DST) in the Porto São José section in the period between 1993 and 2011.
The evaluation of two types of transport allowed the relation between the bedload and the
79
total solid detrital discharge (Figure 6). For these reasons, since 1993, the Paraná River channel has always had more than 25% of bedload and the formation of the reservoir further increased this ratio.
Figure 6 - Temporal variation of the ratio between the bedload and the total detrital load on the Porto São José section between 1993 and 2011
Between 1993 and 1998, the bedload represented 33.9% of the total load and increased to 60.3%
in 1999 and 2000, thanks to the almost immediate reduction in the suspended load. Since 2001, it
came to represent 44.5% of the total transport of detrital sediments. That is, the channel already
had a large bedload and after the dam, this proportion increased further because the reduction of the suspended load is greater than the bedload. However, it should be noted that if the reduction of bed forms have persisted, only residual forms will remain and the channel is likely to be dominated by the transport of suspended sediments.
FINAL CONSIDERATIONS
The evaluation of sediment transport in suspension made it possible to estimate the annual average transport of suspended load in 1979 and in the period between 1986 and 2011. In 1979, the average transport was 673.57 (± 164.29) kg/s, in the period between 1986 and 1992, it was 214.10 (± 85.45) kg/s, in the period between 1993 and 1998 it was 222.19 (± 60.43) kg/s and 56.43 (± 24.86)
kg/s between the years 1999 and 2011. The construction of the dam did not afect the transport in suspension but its completion reduced the suspended load by 74.6%.
The data available enabled an estimate of the bed transport in the period between the years 1993 and 2011. In the construction period, the transport was 99.66 (± 6.3) kg/s, in 1999, in 2000, it was 86.15 (± 6.3) kg/s and 41.15 (± 9.98) kg/s between 2001 and 2011, and that is to say, the
completion of the dam reduced the bed transport by 58.7%.
The total transport of detrital sediments during the construction of the dam was 321.85 (± 66.73) kg/s and was reduced to 177.82 (± 37.11) kg/s in 1999 and 2000, and 91.17 (± 37.11) kg/s
80
The dam also afected the ratio between the suspended load and the bedload because the irst had a greater reduction than the second did. Thus, the bed transport represented 33.9% of the total load in the construction period, rose to 60.3% between 1999 and 2000, and decreased to 44.5%
from 2001.
ACKNOWLEDGMENTS
This article was supported by the projects: “The Paraná River loodplain: Structure and
Environmental Process” (PELD) and “Environmental Diagnosis of the Paraná River Plain: The
Transformations of the Fluvial Channel” (307676 / 2009-9 CNPq process).
BIBLIOGRAPHIC REFERENCE
ÁGUAS, T.A.; SOUZA FILHO, E.E.; GONCALVES JUNIOR, F.A. Estimativa da concentração de sedimen -tos suspensos do rio Paraná, em Porto São José, a partir de imagens LANDSAT5/TM. In: Simpósio Brasileiro de Geograia Física Aplicada, XV. 2013, Vitória-ES. Anais....Vitória: Departamento de Geograia UFES,
2013. p, 538-545. Disponível em http://www.xvsbgfa2013.com.br/anais/trabalhos/Eixo03.pdf#page=538. Acesso em 12 de dezembro de 2013.
CHIEN, N. 1985 Changes in river regime after the construction of upstream reservoirs. Earth Surface Processes and Landforms, v. 10, 143-159. 1985.
CRISPIM, Jeferson. Queiroz. Alterações na hidrologia do canal após construção de reservatório a mon-tante: o caso da Usina Hidrelétrica de Porto Primavera, Rio Paraná. 2001. 25 f. Dissertação (Mestrado) - Universidade Estadual de Maringá, Pós-Graduação em Ecologia de Ambientes Aquáticos Continentais, Maringá, PR. 2001.
GRIMSHAW, D.L. & LEWIN, J. Reservoir efects on sediment yield. Journal of Hydrology, v. 47, 163–171. 1980.
ITAIPU BINACIONAL. Estudo sobre a carga suspensa na bacia do rio Paraná no período de 1986-1988. Relatório interno s/n. s/vol. Foz do Iguaçu, 1990.
ITAIPU BINACIONAL. Efeitos sedimentológicos no reservatório da UHE Itaipu. Relatório referente à
reunião do Board de Consultores Civis, 37 pp. Foz do Iguaçu, 1996.
MARTINS, D.P. & STEVAUX, J.C. Formas de leito e transporte de carga de fundo do Alto Rio Paraná.
Revista Brasileira de Geomorfologia, v. 6, p. 43-50, 2006.
MARTINS, D. P.; BRAVARD, J.P. & STEVAUX, J.C. Dynamics of water low and sediments in the Upper Paraná River between Porto Primavera and Itaipu dams, Brazil. Latin American Journal of Sedimentology and Basin Analysis, v. 16, nº 2, 111-118. 2009.
MONTANHER, O.C. & SOUZA FILHO, E.E. Avaliação da Alteração da concentração de sedimentos em suspensão em eventos de cheia do Rio Paraná: O uso de imagens orbitais para avaliação de impactos provocados pela barragem de Porto Primavera Revista de Geograia (Recife), v. espec., p. 164-176. 2010. MONTANHER, O.C.; SOUZA FILHO, E.E. Geração de algoritmos para predição de carga em suspensão em corpos hídricos da bacia hidrográica do Rio Paraná com uso de imagens Landsat TM5. In: Simpósio Brasileiro de Sensoriamento Remoto, XV, 2011, Curitiba. Anais... São José dos Campos: INPE, 2011. v. 1, p. 5340-5347.
PETTS, G.E. Complex Response of River Channel Morphology Subsequent to Reservoir Construction.
Progress in Physical Geography, v 3, 329-362. 1979.
PETTS, G.E. Impounded rivers: perspectives for ecological management. Chichester: John Wiley. 326 pp. 1984.
PETTS, G.E., GURNELL, A.M. Dams and geomorphology: Research progress and future directions. Geo-morphology, v. 71, 27-47. 2005.
81
dos macronutrientes N, P e K, que aportam nos rios Paraná e Baía, na região de Porto Rico – PR. Acta Limnologica Brasiliensia, vol. IV, 239-245. 1992.
ROCHA, J.A. & SOUZA FILHO, E.E. Características gemorfológicas do canal do Rio Paraná à jusante da barragem de Porto Primavera: variação temporal e espacial dos sedimentos suspensos, de fundo e de algumas variáveis limnológicas. In: Dalva Helena de Medeiros. (Org.). Relação Homem/Natureza sob a Ótica da Interdisciplinaridade. Campo Mourão: Editora Fecilcam, v. 1, p. 225-249. 2008.
SOUZA FILHO, E.E. Diagnóstico do meio físico e condições emergentes da planície do rio Paraná em Porto Rico. Geonotas (UEM), Maringá, v. 03, n. 03, p. 1-10, 1999.
SOUZA FILHO, E.E. & RIGON, B.T.C. Avaliação da velocidade de deslocamento de barras luviais do rio Paraná por meio de imagens CBERS/CCD. Revista Brasileira de Geomorfologia, v. 13, p. 57-64, 2012. SOUZA FILHO, E.E.; ZANETTI, K.; PINESE, J.P.P. & FRANÇA, V. A hidroquímica do Rio Paraná após a barragem de Porto Primavera. Boletim de Geograia, v. 28, p. 101-112, 2010.
Submitted 23 june 2016