ASSESSMENT USING GOES-8 IMAGER DATA
Juan Carlos Ceballos,
1Wagner Flauber Araújo Lima,
2Jaidete Monteiro de Souza
3Recebido em 6 fev. ,2003 / Aceito em 10 fev., 2004 Received Feb. 6, 2003 / Accepted Feb. 10, 2004
ABSTRACT
GOES-8 Imager radiances in water vapor and infrared channels 3, 4 and 5 were used for assessing outgoing longwave radiation (OLR) at the top of the atmosphere. Estimation by ITPP5 software applied to HIRS/NOAA 14 passes over Brazil was considered as true reference. Imagery from both satellites is currently acquired and processed at CPTEC/INPE. GOES full-resolution imagery allows assessment of mean irradiance for sets of GOES pixels contained within the area of a single HIRS pixel. Additional GOES variables were estimated, such as: an equivalent channel at 8 mm and a longwave tail for l>15 mm (this one is not detected neither by HIRS nor GOES sensors). Isotropic outgoing radiance was assumed. Multivariate regression of GOES irradiances on OLR ITPP estimates provided a GOES estimator with accuracy comparable with others already published and based on AVHRR/NOAA information. It was found that a regression based only on channel 4 and the longwave tail yielded estimates with the same accuracy: mean deviation of 3 W.m-2 and standard deviation of 11 W.m-2. The application for another
period in the year, averaged over 1°´1° grid cells, yielded similar mean deviation and standard deviation of 7 W.m-2. These results suggest that the algorithm
applied in this work has physical rather than purely statistical meaning and could be used for OLR monitoring in daily and seasonal scales.
Keywords: Outgoing Longwave Radiation (OLR), GOES 8 Imager, NOAA 14, Terrestrial Radiation
RESUMO
Radiâncias obtidas do satélite GOES 8 nos canais de vapor dágua e infravermelho termal (2, 4 e 5) foram utilizadas para estimar Radiação de Onda Longa (ROL) emergente no topo da atmosfera. As estimativas de ROL pelo utilitário ITPP5, aplicadas à informação do sensor HIRS/NOAA, foram consideradas como verdade de referência. Imagens dos dois satélites são continuamente recebidas e processadas no CPTEC/INPE. As imagens GOES de alta resolução permitiram considerar grupos de pixels (e a irradiância média correspondente) contidos na área de um único pixel HIRS. Variáveis adicionais foram elaboradas, como por exemplo: um canal equivalente em 8 mm e uma cauda espectral de onda longa para l>15 mm (esta última, não detectada nem pelo HIRS nem pelo GOES). Assumiu-se a hipótese de isotropia para a radiância emergente. Regressão multivariada das irradiâncias GOES com relação à estimativa ITPP da ROL forneceu um estimador GOES com precisão comparável à de outros já publicados e baseados na informação de AVHRR/NOAA. Verificou-se que uma regressão baseada apenas nas irradiâncias do canal 4 e da cauda de onda longa fornece estimativas com a mesma precisão: erro médio de 3 W.m-2 e desvio padrão de 11 W.m-2. A aplicação do
algoritmo para outra época do ano, avaliando médias em células de 1°´1°, produz um desvio médio similar e um desvio padrão de 7 W.m-2. Estes resultados
sugerem que o algoritmo resgatou propriedades físicas e não simplesmente estatísticas da ROL, e poderia ser aplicado para monitoramento de ROL em escala diária e sazonal.
Palavras-chave: Radiação de Onda Longa Emergente (ROL), GOES 8, NOAA 14, Radiação Terrestre.
INTRODUCTION
The Outgoing Longwave Radiation (OLR) at the top of the at-mosphere (TOA) is an important meteorological variable, used in sev-eral ways. On one hand, it is used by the meteorological community as an index related to convective activity since lower OLR values are asso-ciated to the top height of well developed clouds (SCHMETZ; LIU, 1988). On the other hand, the OLR is the infrared component of the Earths energy balance. Together with the solar net radiation flux, it helps to describe the changes in energy availability induced by clouds through the difference between clear-sky and the observed radiative balances (RAMANATHAN et al., 1989).
Early operational assessments of OLR employed a simple parameterization using the window channel brightness temperature of the AVHRR/NOAA 6-7 system (ELLINGSON; FERRARO, 1983; GRUBER; KRUEGER, 1984). ELLINGSON and others (1989) have shown that lin-ear combination of only four HIRS channels could account for more than 99% of the OLR total variance. Comparison with the ERBE (Earth Ra-diation Budget Experiment) instrument flown in NOAA 9-11 satellites suggested that estimates made with HIRS data exhibited errors of the same order of ERBE: about 5 W.m-2 (ELLINGSON; LEE; YANUK, 1994),
and the use of AVHRR data exhibits monthly bias of 1 to +2 W.m-2
and rms differences of about 14 W.m-2 (GRUBER et al., 1994).
Pres-ently, NOAA/NESDIS assessments of OLR use the AVHRR channel 4, or four HIRS/TOVS or HIRS/ATOVS channels through a linear regression of brightness temperatures (Jacobowitz, Herbert, NOAA, personal commu-nication). NCEP (National Center for Environmental Prediction) provides two daily OLR fields which are averages for a grid of 2.5°´2.5°. After 1985, the algorithms have changed. NOAA-16 ATOVS data are being used but no further calibration has been published (KIDDER; VONDER HAAR, 1995). CERES (Clouds and the Earths Radiant Energy System) has replaced the ERB sensor, being flown onboard TRMM satellite (Tropi-cal Rainfall Measuring Mission) and EOS-AM (Terra) satellites (BAKSTROM, 1999), allowing to perform new comparisons with TOVS/ ATOVS based algorithms.
Geostationary satellites imagery has also been used for OLR as-sessment. Gube (1982) and Schmetz & Liu (1988) have reported parameterizations using two channels (water vapor and thermal infra-red) of the Meteosat. Mamoudou & Ellingson (2001) estimated OLR using several channels of the GOES Sounder (instead of HIRS/NOAA) and presented comparisons with the CERES measurements. Neverthe-less, these are preliminary results. Based on GOES-7 imagery and ground data during ABLE (Amazon Boundary Layer Experiment), Calvet & Viswanadham (1993) suggested that a linear relation may exist
be-tween TOA radiation balance and the net radiation at ground level. GOES-7 had only two channels (visible and infrared window).
GOES-8 Imager full-resolution data are presently available with four channels in the infrared region. Channels 2, 4 and 5 are located at spectral frequencies similar to channels 3,4 and 5 of the AVHRR sensor. Also, channel 3 provides additional information in wavelengths not cov-ered by the AVHRR. It is worthwhile to note that the (global) field of OLR provided by NCEP actually presents information of successive orbits of the same NOAA satellite (therefore, it describes estimated OLR for simi-lar local sosimi-lar time throughout the globe along 24 hours). Time fre-quencies of GOES imagery suggest its use for instantaneous assessment of OLR following up its daily cycle over large areas. Keeping that possi-bility in mind, the present paper examines aspects of the performance of a simple algorithm based on GOES Imager information and adjusted to OLR assessments by ITPP (International TOVS Processing Package).
CONCEPTUAL FRAME FOR THE OLR ASSESSMENT
In clear-sky conditions, the spectral radiance Lv(µ) emerging at the TOA with zenith angle q (m= cosq) can be formally described by:
( )
,( )
; .exp( )
0 /v v v v
L v u =ε B v T τ µ+
( )
( )
( )
0
; .exp / . . /
v v v
B v T z τ z µ κ ρ z dz µ ∞
+
∫
(1)( )
( ) ( )
v v
z
z z z dz
τ =℘
∫
κ ρ , (2)where Bv denotes the Plancks function for frequency n at temperature τ ; z= altitude; τv= optical depth from TOA until altitude z; ρ= density or concentration of absorbing material; κv= mass absorption coefficient of the absorber; εv= ground emissivity.
Eq. (1) describes Lv at TOA as the sum of radiation emitted by the ground with a temperature Ts and attenuated by the atmosphere, plus the contributions of successive layers with optical depth
( )
. .
v v
dτ =κ ρ z dz (note that dτv = 1 implies its equivalence
irradiance at TOA can be obtained by integration over the upward hemi-sphere:
( )
1( )
0
2 ,
v TOA v
E↑ v = π µ
∫
L vµ µd (3)It can be shown that eq. (3) is equivalent to (LIOU, 1980):
( )
2( ) ( )
; . 3v TOA v v vs
E↑ v = πε B v T Ψ τ +
( )
3( )
0
2 ;
ps
v
v v
v
d
B v T p d
d
τ
π τ
τ Ψ
+
∫
, (4)where Ψn
( )
τ is the so-called exponential-integral function of n-th order:( )
( )
1 exp
n
n τ x xτ dx ∞
−
Ψ =
∫
− . (5)and 2
( )
0 32Ψ τv = Ψv represents the monochromatic transmittance for (initially) isotropic diffuse radiation emitted at the optical depth τv.
Absorption in this atmosphere is produced mainly by H2O vapor, CO2 and O3 in several absorption bands constituted by a high number of absorption lines. Molecular collisions produce line broadening so that
v τ and 0
v
Ψ exhibit a complex spectral structure: monochromatic trans-mittance depends not only on the spectral environment but also on ver-tical profile of atmospheric absorbers. Line-by-line methods allow inte-gration (and further parameterizations) over narrow intervals Dn pro-viding mean transmittance Ψv over ∆v for a central frequency n and optical path w, weighted with vertical profilesρ
( )
z of the absorber as well as temperatureT z( )
and pressurep z( )
. In this work, we use the SBDART, acronym of Santa Barbara DISORT Atmospheric Radiative Transfer (RICHIAZZI et al.,1998). This software is available on the internet (RICCHIAZZI; YANG; GAUTIER, 2000). It allows to assess transmittances in interval widths 120
v cm−
∆ = , as well as perform calculation of outgoing spectral irradiance EvTOP↑ for different
atmos-pheric profiles. It also allows the inclusion of stratiform clouds at chosen levels; in this case Ts and e for z=0 in the right term of eq. (4) correspond to the cloud top if the cloud is optically thick.
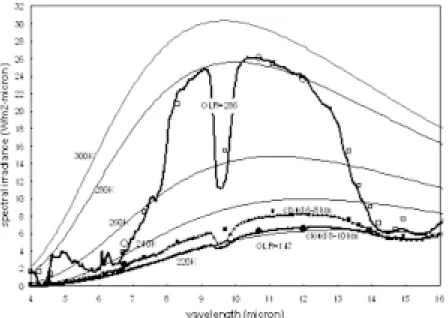
Figure 1 shows a theoretical spectrum obtained by SBDART for a tropical model atmosphere with no aerosol. The spectral variable is
wave-Figure 1 OLR spectrum for a McClatcheys tropical model atmosphere.
length l instead of frequency n. Blackbody spectrums for several tem-peratures are included, for the sake of illustration of atmospheric ef-fects. As expected, the irradiance emerging at TOA departs considerably from blackbody spectrum. Several TOA spectrums for a 2km thick cloud imbedded in this atmosphere are also shown. For the clear-sky case, it is seen that the water vapor band at 6.4 mm entirely absorbs the ground thermal radiation. Emerging irradiance is mainly due to the vapor emis-sion within mid- and upper-troposphere. As a consequence, brightness temperature is typically about Tb= 240K. Stratospheric ozone emits in a band around 9.6mm; nevertheless, ground irradiance is higher and the net effect is a spectral decrease due to the ozone absorption. Carbon dioxide band around 15mm strongly absorbs ground radiation, so that Tb at this band center is about 220K corresponding to a nearly stratospheric emission. Wavelengths of about 11µm show the atmos-pheric window where basically only weak absorption by water vapor continuum is present; therefore, Tb is rather close to but lower than ground temperature Ts. For a tropical atmosphere with high values of moisture at lower layers, Tbmay differ considerably from Ts.
The presence of clouds with tops at 4, 6 and 8km heights con-serve the general trends of clear-sky TOA irradiance, but brightness tem-perature decreases and water vapor effect weakens with top height. Atmospheric window irradiances at 10.5-12µm are nearly constant, tending to cloud top thermodynamic temperature for higher clouds. On the other hand, note that Tb in 14.5-15µm is always the same, due to the strong absorption by CO2 within the higher atmosphere.
In what follows, integration of spectral radiance Lλinstead of Lυ will be considered. Figure 1 includes information about spectral position of different infrared channels of HIRS instrument onboard NOAA-14 and of GOES-8 imager, located on the abscissa axis. It can be said that:
a) satellites detect spectral radiance which is not isotropic. Line-of-sight from pixel to satellite implies an attenuation varying with the zenith angle θs. A pixel in a given geographical location is viewed by NOAA and GOES satellites with different θs.
b) HIRS channels 13-19 virtually do not contribute to the OLR. c) GOES and HIRS channels in 6.4µm water vapor band represent minor
contributions to the total irradiance.
d) When integrating Lλwithin the (8-10µm) interval, HIRS channels 8-10 do not accurately assess contribution of ozone absorption in clear-sky conditions. This might not be the case for cloudy scenes (for which ozone depletion is lower).
e) Atmospheric window channel 8 for NOAA and channels 4-5 for GOES describe an important contribution to total irradiance.
f) Spectral decrease due to CO2 band is detected in detail by NOAA channels 1-7. GOES provides no information in the CO2 band.
g) Neither HIRS nor GOES provide information for the interval λ>16µm, which contains an important contribution to the total irradiance.
The attempt to assess OLR through a linear regression on HIRS radiances constitutes an implicit integral over the whole longwave spec-trum. ITPP5 software (International TOVS Processing Package) has been widely used for assessing atmospheric retrievals based on HIRS-MSU/NOAA radiances. Version 5 includes a procedure for estimation of OLR through a linear combination of brightness temperature in 12 HIRS channels. Nevertheless, a theoretical study by Ellingson and others(1989) showed that four channels would be enough for recovering 99% of total variance in a linear regression (considering the case θs=0). In particular, channel 7 (within 13.1-13.6µm) was responsible for 96.4%, whereas early use of AVHRR channel 4 in the same satellite would re-cover only 94%. They considered a high number of atmospheric profiles and the theoretical responses of HIRS channels in NOAA-9. In terms of rms errors, that means 7 W.m-2 for AVHRR, 5.5 W.m-2 using channel 7,
and about 1.2 W.m-2 using four channels. Including instrumental noise,
the least rms error attained was 2 W.m-2. These results strongly suggest
that the upwelling spectrum is internally redundant, in such a manner that a reduced number of HIRS channels provide enough information, even about the spectral tail for λ>16µm. In this sense, channel 7 in NOAA-14 instrument presents at the same time information about at-mospheric window and depletion by CO2; on the other hand, channel 8 in 11µm (typical of the atmospheric window) seems to exhibit a bright-ness temperature similar to channel 10 in 8µm.
It is worthwhile to note that radiances are directional quantities, which would depend on the line-of-sight zenith angle Z (that is, on total atmospheric optical path as well as on anisotropy of radiation emitted by observed targets). Usually a limb darkening correction for each channel reduces radiances to Z=0 emission, and OLR is assessed through a suitable (linear) combination of the corrected radiances or bright-ness temperatures. In a general sense, a correction factor f v
(
,θs)
accounting for radiance anisotropy would be necessary, so that the con-tribution to spec tral irradianc e in a given c hannel (eq. 4) is.
v v
E = fπL .
DATA AND METHODS
Satellite data
closest GOES-8 full-disk image (that is, 0600 UT image). Figure 2 illus-trates the distribution of TOVS pixels for NOAA 14 passage over Brazil in June 14, 2001 detected by INPEs ground station in Cachoeira Paulista. Only those TOVS pixels taken for atmospheric retrieval are shown, as-sumed by ITPP as having clear-sky conditions.
OLR values and atmospheric profiles were provided by ITPP5.0 software, including geographical location φ,ζ (φ= latitude, ζ= lon-gitude) and brightness temperatures for all HIRS channels. ITPP5 was set for assessing OLR in all pixels. For the sake of comparison with HIRS information, a set of GOES pixels located within about 10 km around a
Figure 2 Distribution of HIRS pixels (empty circles) for June 14, 2001, as detected by ground station at Cachoeira Paulista, SP (white square at about 20°S 47°W). Spectral irradiances shown in Figure 3 correspond to white squares on the Atlantic
location (φ,ζ) was taken. Full resolution GOES imagery was available, each pixel having about 4´4 km size; physical informations provided by the station software were brightness temperature Tb for channels 2 to 5. Radiances were assessed using Plancks law Lλ =
(
, b)
Bλ λ T
= , and average values within each set were calcu-lated. It was observed that ±2 km variations in the radius around the locations did not introduce significant differences in average radiance.
Parameterizations of GOES Imager information
Figure 3 shows two cases of radiances observed in 19 HIRS chan-nels (as processed by ITPP5.0 software) and 3 infrared GOES chanchan-nels. In all cases spectral irradiance was assessed as πLλ =πBλ
(
λ,Tb)
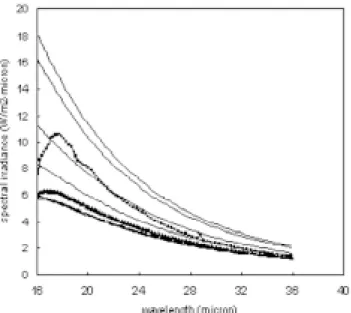
, without the correction factor for anisotropy (that is, f=1).Figures 3 and 4 present two extreme cases: cloud-free (high OLR value) and overcast (lowest OLR values), showing SBDART esti-mates of outgoing spectrum. Atmospheric profiles correspond to retrievals obtained using ITPP5.0 software. Figure 3 includes all HIRS and GOES channels estimates up to 15µm. Several blackbody spectrums are pre-sented for different temperatures. Figure 4 presents the same SBDART results and blackbody spectrums for λ>15µm.
SBDART estimation of spectral irradiance in a cloudy case con-sidered the atmospheric profile for that pixel, locating top height ac-cordingly to window channel 8 (λ≈11µm), for which water vapor ab-sorption over cloud is minimal. It is seen a satisfactory fit between HIRS and GOES observations and SBDART estimates, suggesting that irradi-ance beyond λ=15µm is accurately assessed.
It is seen that: a) a correction factor f(ν,θs) accounting for anisotropy could improve irradiance assessment but seems not essen-tial; b) SBDART radiances in 15µm CO2 band are somewhat different from HIRS measurements; nevertheless, it is found that associated error in OLR is not higher than 1 W.m-2.
Figures 3 and 4 suggest to assume the following algorithm for integral over infrared spectrum, based on GOES radiances:
(
)
0 6 6 6
3.9
,
OLR E dλ λ a aπBλ λ T ∞
=
∫
≈ + +(
)
(
)
8 8, 11 11 11, 11
aπBλ λ T a πBλ λ T
+ + +
(
)
(
*)
12 12 12
*
, ,
a Bλ T Bλ T d
λ
π λ ∞π λ λ
+ +
∫
(6)Here, indexes 6, 11 and 12 refer to the characteristic wave-length of those channels so that coefficients a6, a11 and a12 are weights
Figure 3 Spectral irradiances during passage of NOAA 14 for two selected pixels (see position in Figure 2). Squares ( no ) are HIRS radiances; circles ( ml) are GOES averages over a circle of 15 km radius within the HIRS pixel area. Typical blackbody spectrums are shown for several temperatures. Estimated irradiance
spectrum is also included as assessed by SBDART.
Figura 3 Irradiâncias espectrais durante a passagem do NOAA14 para dois pixels (ver localização na Figura 2). Os quadrados (no ) são radiância HIRS; os círculos ( ml ) são médias de GOES num círculo de 15 km de rádio na área do pixels HIRS. Mostram-se espectros típicos de corpo negro para várias
for GOES channels 3, 4, 5. An intermediate virtual channel for λ= 8.5
mm is considered, for which brightness temperature is the same as for channel 4. Integral on the right side of eq. (6) corresponds to a remain-ing blackbody tail beginnremain-ing at a proper wavelength λ*>15µm with
constant temperature T*<T
11 mainly associated to effects of water
vapor continuum. It is seen that T* is close to T11=T12 for high-level cloud, since water vapor density above cloud top is considerably low.
A simple parameterization for the blackbody tail integral may be built as follows. Integral expression
( )
(
)
0 1
, 1 ,
I T B T d
B λ
λ
λ = −
∫
λ λ(whereB=σT4 and 0 ≤ Ι ≤ 1) is actually a function of a single
variable x=λΤ . Proper tables for this function can be found in Paltridge & Platt (1976, chapter 2), it is found that it closely fits the potential function
( )
( )
2.480.0738
J λT = λT − (7)
forλ>15µm, so that
( )
1.52B dλ A T λ
λ λ
∞ ≈
∫
(8)It is interesting to note that this exponent does not exactly corre-spond to the Rayleigh-Jeans approximation for longwave blackbody ra-diation (which would provide an expression proportional to T*). A higher
value for λ∗ would be required for that.
A closer observation of Figure 4 shows that brightness tempera-ture is not constant in this wavelength interval, and proper values of λ∗ and T* should be defined for each cloudy scene. A first order (linear)
correspondence between T* and T
11 for the extreme cases (cloudless
and high-cloud cover) shown in figures 3 and 4 provides the expression
*
11
47 0.76
T = + T , (9)
where T* for the cloudless case was chosen from observation of figure 4. On the other hand, linear regression of OLR values in eq. (6) can provide the proper value for A(λ∗) as well as for coefficients ao, a6, a8, a11, a12.
ANALYSIS AND RESULTS
Several tests for regression were performed, considering differ-ent expondiffer-ents in eq. (8). Correlation coefficidiffer-ents were similar in all cases, so that exponent 1.52 was maintained. As a consequence, eq. (6) be-comes
Figure 4 Spectral outgoing irradiances as in Figure 3, for the λ > 15µm interval.
0 6 6,6 8 8,11
OLR≈a +a E +a E +
(
)
1.5211 11,11 12 1,12 12
a E +a E + +α b+cT ,
(
)
, ,
m n m n
E =πBλ λ T (10)
Here, the last term on the right corresponds to the blackbody tail for λ>15µm as described by eqs. (8) and (9).
Coefficients in eq. (10) were calculated for two days (165 and 166) by linear regression, assuming ITPP5 OLR estimates as true val-ues. In order to test the generality of results, these regression coeffi-cients were used for assessing OLR for julian day 170. All TOVS pixels (a set size of 6116) were considered. Table 1 illustrates the quality of approximations when several choices of GOES variables are adopted. It is seen that the mean difference md between GOES estimate and ITPP5 values is about +3 W.m-2 > 0 with standard deviation of about 11
W.m-2 in all cases. The squared correlation coefficient R2 estimates the
quality of regression: 87% of the variance is explained by the GOES approximation. The regression GOES|ITPP5 shows that GOES approxi-mation overestimates OLR values for colder TOVS pixels (associated to developed cloud systems), so that the constant term is higher than 20 W.m-2 in all cases. This behavior can be attributed to the higher
frequency of clear-sky TOVS pixels, forcing GOES approximation to bet-ter reproduce high-valued rather than low-valued OLR cases.
In order to compensate the above mentioned effect, an objec-tively weighted approximation was tested. ITPP5 OLR values were
con-sidered in steps of 1 W.m-2, and the corresponding mean values of GOES
irradiances were adopted. Therefore, similar weights were attributed to higher as well as to lower OLR values. Table 2 presents the results. Statistically, similar values are shown for me, s and R2; however,
con-stant term in GOES|ITPP5 regression is lower (about 18 W.m-2 or less),
especially when considering all GOES variables involved. As in Table 1, it is seen that similar quality is shown by the complete approximation proposed by (10) and by a simpler approximation which considers only channel 4 information (radiance in 11µm and irradiance in the longwave tail). Figures 5 illustrate the quality of both approximations. Case (a) considers all points with the same weight, overestimation being evident for lower OLR. Bias is not seen in case (b), which allows equal weights for each 1 W.m-2 OLR interval. Similar behavior is observed in case (c),
considering only channel 4 and longwave tail. Nevertheless, the latter case shows overestimation of about 7 W.m-2 for clear-sky conditions.
Coefficients for cases (b) and (c) are described in Table 3.
The extent of usefulness of estimates described by Table 3 was tested by considering their skill for a different epoch of the year. Com-parison with ITPP5 estimates for julian day 239 (in August, about 3 months later) showed values me ≈ -2, s ≈ 12 W.m-2 and R2= 0.94.
This result suggests that the coefficients in Table 3 exhibit an acceptable degree of confidence to describe OLR values along the entire year (that is, they constitute a physical synthesis of the different radiative proper-ties of cloud systems over the region).
It could be argued that standard deviation of GOES estimates is rather high. Nevertheless, such figures describe the case of single TOVS
Figures 5 GOES algorithm versus ITPP assessment: (a) using all variables, equal weight for all points; (b) grouping GOES pixels within 1 W.m-2 OLR intervals (ITPP assessment) and considering all variables; (c) using criterion (b), but considering only channel 4 and longwave tail.
Figuras 5 Algoritmo GOES versus estimativa ITPP: (a) usando todas as variáveis, com pesos iguais para todos os pontos; (b) grupando pixels GOES de acordo com intervalos de 1 W.m-2 (ROL estimada pelo SBDART) e considerando todas as variáveis; (c) usando o critério (b), mas considerando apenas o canal 4
targets (about 20km diameter). It is worthwhile to note that usual re-ports of OLR values (for example those of NCEP) are provided as means in a 2.5°´2.5° grid. For analyzing this aspect, means of GOES approxi-mation (simpler case) were estimated for TOVS pixels included in 1°×1° cells, julian day 239. Table 4 summarizes statistical results when con-sidering the all pixels and weighted OLR approximations. It is seen that all cases exhibit similar quality, but the weighted OLR criterion
shows lower bias (about 2.6 W.m-2). Standard deviation is about 7
W.m-2. Note that means over larger cells could be even lower. These
results are fairly good, when comparing with the accuracy of AVHRR-based estimates in 2.5°×2.5° cells (GRUBER et al., 1994).
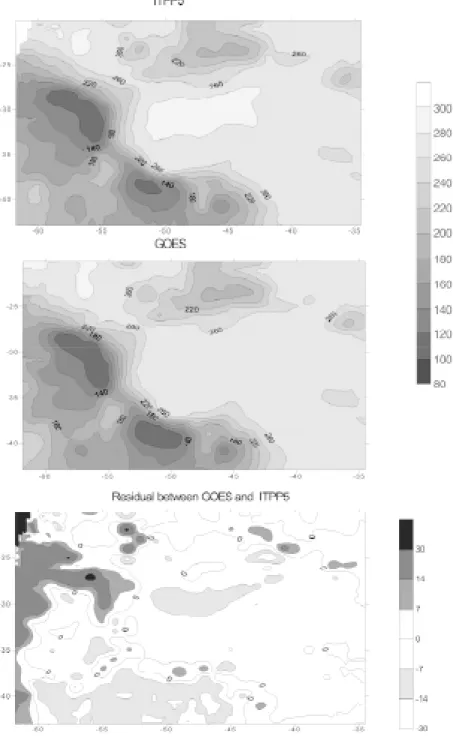
Figures 6 illustrate the results provided by the use of coefficients in Table 3. It is seen that OLR fields for ITPP and simpler GOES assess-ment show similar patterns. The difference between GOES and ITPP
as-Table 1 Mean difference and standard deviation for errors of GOES model adopting several choices of GOES variables and assuming ITPP5 as true reference. Day: June 19, 2001. Variables considered: all TOVS pixels and corresponding GOES variables, for June 14 and 15, 2001.
Tabela 1 Desvio médio e desvio padrão para erros do modelo GOES para várias escolhas de variáveis GOES, supondo estimativas ITPP5 como referência. Dia 19/ 06/2001. Variáveis consideradas: todos os píxeis TOVS e as variáveis GOES correspondentes, para 14 e 15/06/2001.
Table 2 Mean and standard deviation for errors of GOES model adopting several choices of GOES variables and assuming ITPP5 as true reference. Day: June 19, 2001. Variables considered: 1 w.m-2 steps for ITPP5 values, and respective means for GOES variables, for June 14 and 15, 2001.
Tabela 2 Valor médio e desvio-padrão para os erros do modelo GOES, para várias escolhas de variáveis GOES e supondo as estimativas ITPP5 como verdadeiras. Dia 19/06/2001. Variáveis consideradas: intervalos de 1 W.m-2 para valores de ITPP5 e as médias respectivas para variáveis GOES,
para os dias 14 e 15/06/2001.
Table 3 Regression coefficients for approximations described in Table 2.
Tabela 3 Coeficientes de regressão para as aproximações descritas na Tabela 2.
Table 4 Comparison between GOES approximation and ITPP5 estimates for means over 1°×1° cells, julian day 239. Regression cases described in Tables 1 and 2 are included.
Figure 6 Comparison of GOES approximation with ITPP5 estimates for 1×1 degree cells.
Figura 6 Comparação entre a aproximação GOES e a estimativa ITPP5 para células de 1°×1°.
sessment is also shown. It is seen that residuals lie within ±7 W.m-2
over most part of the region. GOES approximation deviates mainly 7-14 W.m-2 over cloudy and clear-sky areas. Higher deviations are present in
restricted areas; except on the left side of the figure; on one hand,
CONCLUSIONS
In spite of the simplifying assumptions for estimates of TOA out-going irradiance, GOES Imager provides approximations to OLR over the Brazilian region which are compatible with other estimates based on AVHRR/NOAA information (GRUBER et al., 1994). A simple algorithm shows errors with mean deviation of about 3 W.m-2 and standard
devia-tion of 11 W.m-2. This paper assumes ITPP5 estimate based on HIRS/
NOAA 14 as a reference true value for OLR.
The algorithm (a multivariate regression of GOES irradiances on OLR reference value) considers GOES channels 3 (6.4µm), 4 (11µm) and 5 (12µm), adding a virtual channel in 8 mm and a longwave tail (λ>15µm). Nevertheless, similar statistical errors are obtained by a linear combination of channel 4 irradiance and the longwave tail only. A better regression is obtained by assigning equal weights to OLR values rather than to single pixels. Sets of GOES pixels (and their mean radiances) were considered, classified according to steps of 1 W.m -2 in OLR. This criterion corrects overestimation of OLR for cloudy
condi-tions (lower OLR values).
When coefficients obtained for June 2001 are used for OLR as-sessment in August 2001, averages over a 1°×1° grid show errors with standard deviation of ±7 W.m-2. Absolute errors lower than 14 W.m-2
lie over the most part of NOAA overpass. This result suggests that the algorithm describes physical rather than statistical or seasonal proper-ties of outgoing longwave flux. Given the better resolution and higher frequency of GOES imagery, a detailed monitoring of daily and seasonal cycles of OLR over South American region could be allowed. Further analysis and improvements of these aspects are recommended, espe-cially comparisons with other OLR estimation models available for NOAA 14 and 16 and absolute measurements like those of CERES sensor.
Acknowledgements
This work was partially supported by CNPq/MCT research fellow-ship of first author and CAPES/MEC graduate studies fellowfellow-ship of the others.
REFERENCES
BAKSTROM, B. R. Ceres: the start of the next generation of radiation measurements. Adv. Space Res., Elsevier, v. 24, p. 907-914, 1999. CALVET, J. C.; VISWANADHAM, Y. Amazon forest radiation budget from satellite data. American Meteor. Soc., Boston, v. 32, p. 844-847, 1993.
ELLINGSON, R. G.; FERRARO, R. R. An examination of a technique for estimating the longwave radiation budget from satellite radiance obser-vations. American Meteor. Soc., Boston, v. 22, p. 1416-1423, 1983. ______; LEE, H.-T.; YANUK, D. Validation of a technique for estimat-ing Outgoestimat-ing Longwave Radiation from HIRS radiance observations.
American Meteor. Soc., Boston, v. 11, p. 357-365, 1994.
______ et al. A technique for estimating outgoing longwave radia-tion from HIRS radiance observaradia-tions. American Meteor. Soc., Boston, v. 6, p. 706-711, 1989.
GRUBER, A.; KRUEGER, A. F. The status of the NOAA outgoing longwave radiation data set. American Meteor. Soc., Boston, v. 65, p. 958-982, 1984.
______ et al. A comparison of ERBE and AVHRR longwave flux esti-mates. American Meteor. Soc., Boston, v. 75, p. 2115-2130, 1994. GUBE, M. Radiation budget parameters at the top of the Earths atmos-phere derived from Meteosat data. American Meteor. Soc., Boston, v. 21, p. 1907-1921, 1982.
KIDDER, S. Q.; VONDER HAAR, T. Satellite meteorology: an introduc-tion. [New York]: Academic Press, 1995.
LIOU, K .N. An introduction to atmospheric radiation. New York: Aca-demic Press, 1980.
MAMOUDOU, B. B.; ELLINGSON, R. G. A study of diurnal cycle of OLR using GOES Sounder data. In: INTERNATIONAL RADIATION SYMPOSIUM, 2000. St. Petersburg, 2000: Current Problems in Atmospheric Radiation
St. Petesburg: A. Deepak Pub., 2001, p. 505-508.
MCCLATCHEY, R. A. et al. Optical properties of the atmosphere. AFCRL Environmental Research Papers, Air Force Cambridge Research Labora-tory, Bedford, n. 411, 1972.
PALTRIDGE, G. W.& C.M.R. PLATT, C.M.R. Radiative processes in meteor-ology and climatmeteor-ology. Amsterdan: Elsevier, 1976.
RAMANATHAN, V. et al. Cloud radiative forcing and climate: results from the earth Radiation budget experiment. Science, [S.l.], v. 243, p. 57-63, 1989.
RICCHIAZZI, P. et al. SBDART: a research and teaching software tool for plane-parallel radiative transfer in the Earths atmosphere. American Meteor. Soc., Boston, v. 79, n. 10, p. 2101-2114, 1998.
__________ et al. SBDART: a practical tool for plane-parallel radiative transfer in the Earths atmosphere, 2000. http:// www.crseo.ucsb.edu/esrg/pauls_dir. Acesso em
SCHMETZ, J.; LIU, Q. Outgoing longwave radiation and its diurnal varia-tion at regional scales derived from Meteosat. American Geophys. Union,