Revista Brasileira de Geof´ısica (2008) 26(1): 5-20 © 2008 Sociedade Brasileira de Geof´ısica ISSN 0102-261X
www.scielo.br/rbg
FROM BARCHAN TO DOMIC SHAPE: EVOLUTION OF A COASTAL SAND DUNE
IN NORTHEASTERN BRAZIL BASED ON GPR SURVEY
Josibel G. Oliveira Jr.
1,2, Walter E. Medeiros
1, Werner F. Tabosa
1and Helenice Vital
1Recebido em 16 agosto, 2007 / Aceito em 14 dezembro, 2007 Received on August 16, 2007 / Accepted on December 14, 2007
ABSTRACT.A sand dune located near S˜ao Bento do Norte and Caic¸ara do Norte towns (northern coastal region of Rio Grande do Norte state, Northeastern Brazil) is rapidly migrating toward urban areas. To understand the depositional processes (evolution of the dune), a Ground Penetrating Radar (GPR) survey was carried out. The survey is composed by sixteen profiles in E-W direction, which is parallel to the dominant wind direction, and five profiles in N-S direction. In both directions, it was used antennas of 200 MHz and 80 MHz. Additionally, a topographic survey, excavations of two trenches, and grain size analysis were also carried out. The GPR imaged the internal sedimentary structures of the coastal deposits so that it was possible to reconstruct the depositional history of the area. Initially, marine sediments were deposited during the final period of a marine regression of Holocene age. After the exposure of the area, a first phase of aeolian deposition occurred over the marine sediments. Later, a depositional hiatus took place, probably associated with partial erosion of the dune. Finally, a second phase of aeolian deposition occurred, covering all previous strata. Based on the geometry of foresets and bounding surfaces, it was interpreted that, in the second phase of aeolian deposition, the dune changed its morphology from barchan to dome. The morphology change appears to have occurred when the migration front of the dune faced the obstacle constituted by a ramp along in the depositional surface dipping against the wind direction. According to the similarities of the foreset dips in the first and second phases of aeolian deposition, the prevailing dominant winds were very similar to present day dominant winds. So, it is likely that the rapidly migration process of the dune toward urban areas is an entirely natural process.
Keywords: dune evolution, GPR, dome-shaped dune, barchan dune, northeast Brazil, coastal deposits.
RESUMO.Uma duna localizada pr´oxima `as cidades de S˜ao Bento do Norte e Caic¸ara do Norte (litoral nordeste do Rio Grande do Norte, nordeste brasileiro) est´a migrando rapidamente sobre ´areas urbanas. Para entender o processo deposicional (evoluc¸˜ao da duna), um levantamento com Radar Penetrante no Solo (GPR) foi realizado. O levantamento ´e composto por dezesseis perfis na direc¸˜ao E-W, paralelos `a direc¸˜ao dos ventos dominantes, e cinco perfis na direc¸˜ao N-S (utilizando antenas de 200 MHz e 80 MHz). Adicionalmente, foram efetuados escavac¸˜oes de duas trincheiras, um levantamento topogr´afico e an´alises granulom´etricas. O GPR imageou as estruturas sedimentares dos dep´ositos costeiros de modo que foi poss´ıvel reconstruir a hist´oria deposicional da ´area. Inicialmente, sedimentos marinhos foram depositados durante o per´ıodo final de uma regress˜ao marinha ocorrida no Holoceno. Ap´os a exposic¸˜ao da ´area, uma primeira fase de deposic¸˜ao e´olica ocorreu sobre os sedimentos marinhos. Mais tarde, ocorreu um hiato deposicional, provavelmente associado com a eros˜ao parcial da duna. Finalmente, ocorreu uma segunda fase de deposic¸˜ao e´olica, cobrindo todos os estratos anteriores. Com base na geometria dosforesetse nas superf´ıcies limitantes, foi interpretado que, dentro da segunda fase de deposic¸˜ao e´olica, a duna mudou sua morfologia de barcana para dˆomica. A mudanc¸a na morfologia parece ter ocorrido quando a frente de migrac¸˜ao da duna encontrou um obst´aculo constitu´ıdo por uma rampa ao longo da superf´ıcie deposicional. Devido `as semelhanc¸as entre os mergulhos dosforesetsdentro da primeira e da segunda fase de deposic¸˜ao e´olica, os antigos ventos dominantes foram muito similares aos atuais. Portanto, ´e prov´avel que o r´apido processo de migrac¸˜ao da duna em direc¸˜ao a ´areas urbanas seja um processo totalmente natural.
Palavras-chave: evoluc¸˜ao de duna, GPR, duna dˆomica, duna barcana, nordeste brasileiro, dep´ositos costeiros.
1Programa de Pesquisa e P´os-Graduac¸˜ao em Geodinˆamica e Geof´ısica, Departamento de F´ısica/Departamento de Geologia, Centro de Ciˆencias Exatas e da Terra, Universidade Federal do Rio Grande do Norte, 59072-970, Natal, RN, Brazil. Phone/Fax: + 55 (84) 3215-3831 – E-mails: [email protected], [email protected],
INTRODUCTION
The internal sedimentary structures of consolidated aeolian de-posits have long been studied (Brookfield, 1977). However, until the nineties, few studies were available from modern dunes (e.g. McKee, 1966, 1979; Tsoar, 1982; Rubin & Hunter, 1985) because of the difficulties in sampling or excavating trenches in no con-solidated dry sand bodies. The availability of Ground Penetra-ting Radar (GPR) method, since the nineties, provided a fast non-invasive tool to image in detail near surface sedimentary struc-tures (e.g. Gawthorpe et al., 1993; Schenk et al., 1993; Harari, 1996; Bristow et al., 1996; Silva & Scherer, 2000; Neal & Roberts, 2000, 2001; Van Dam, 2002; Oliveira Jr. et al., 2003; Pedersen & Clemmensen, 2005). Comprehensive reviews of the use of GPR in sedimentological studies were done by Neal (2001) and Bristow & Jol (2003).
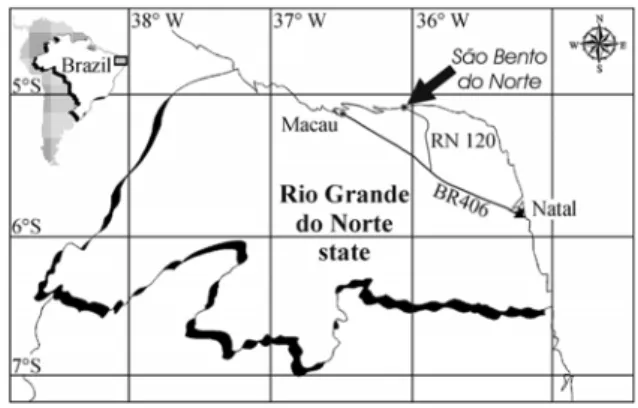
In this study, the depositional history of a recent dome-shaped sand dune is reconstructed based on GPR data interpretation. The studied dune is located near S˜ao Bento do Norte and Caic¸ara do Norte towns, in the northern coastline of Rio Grande do Norte State, Northeastern Brazil (Fig. 1). A comprehensive resume of the Holocene stratigraphy of the area was recently done by Cal-das et al. (2006). Because the studied dune is rapidly migrating towards urban areas of Caic¸ara do Norte town (Fig. 2), a better understanding of its evolution is necessary or important (Tabosa, 2000, 2002; Hustedt, 2000; Oliveira Jr., 2001; Tabosa et al., 2001) in order to guide preventive actions. A GPR survey was done in order to obtain information about the depositional history of the dune and, in particular, to verify if significant changes in the wind direction occurred. Preliminary results of this study were presen-ted by Oliveira Jr. et al. (2003). Data interpretation indicapresen-ted that the dune probably changed its morphology from a barchan to a dome shape, in very good accordance with changes in the depo-sitional process as described by McKee (1966). This aim of this paper is dedicated to this issue.
STUDY AREA
The coastal region of S˜ao Bento do Norte (Figs. 1 and 2) is a plain showing maximum gradient around 5◦, except where dunes occur (Vilac¸a et al., 1991). Several morphological elements are present, such as sand dunes, sand banks, shell middens, tidal flats, be-aches, and beach rocks (Caldas, 1996; Tabosa, 2000; Tabosa et al., 2001).
The climate is semi-arid (mean annual rainfall around 800 mm) with annual mean temperature equal to 26.5◦C and maximum variation of about 5◦C. Air humidity is normally equal
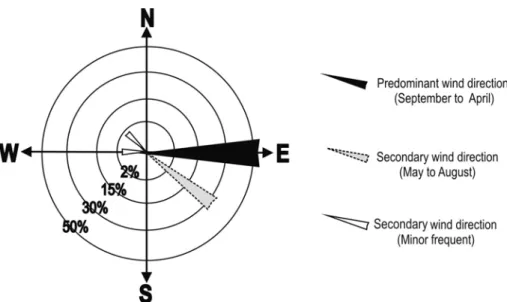
or greater than 68% (IDEMA, 1999). The wind blows up from East in the period August-April and from Northeast in the period May-July. From March to June, the mean wind velocity is equal to 4.8 m/s while between August and December the winds are stronger with mean velocity around 9.0 m/s (Costa Neto, 1997; Tabosa, 2002). A frequency distribution plot of the wind directi-ons is shown in Figure 3.
Figure 1– Location of the studied area in Rio Grande do Norte State, Northeas-tern Brazil. RN120 and BR406 are the main roads in the area.
Sand supply to some portions of the coastline is the result of longshore currents. Because the wind direction is approxima-tely constant (E-NE), long sandy sheets are along the coast. Dune sands are formed by fine to medium grain sizes with moderate sorting and composed mainly by quartz and shell fragments.
METHODOLOGY
GPR is a tool (of exploration) which images the shallow sub-surface of the Earth (usually up to 30 m) using electromagnetic waves with frequency in the range 10 MHz-1000 MHz. Because electromagnetic waves share relevant cinematic similarities with elastic waves, GPR data interpretation and processing can be con-ducted in a manner similar to other seismic data as long as cau-tion is taken in order to correct dispersion effects (Xavier Neto & Medeiros, 2006).
JOSIBEL G. OLIVEIRA Jr, WALTER E. MEDEIROS, WERNER F. TABOSA and HELENICE VITAL
7
Figure 2– Oblique photograph of the studied dune taken from a flight in low altitude showing the dune, its top and the well location shown in Figure 4 (Photo: H. Vital, October 2002).
dunes are in general formed by very low conductive material, as quartz-sand and shell fragments, they offer excellent conditions for GPR imaging, except if they are saturated with salty water. Details about the GPR method may be obtained in Davis & An-nan (1989), for example.
GPR and topographic surveys
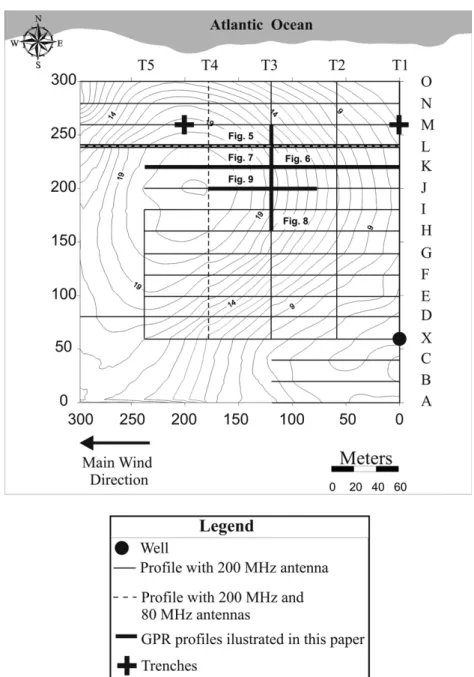
GPR data were obtained along 21 profiles (Fig. 4) using a GSSI-SIR System 2 equipment. Using a 200 MHz monostatic an-tenna, 16 profiles along E-W direction – parallel to the dominant wind direction – and 5 profiles along S-N direction were carried out. Profiles L (E-W direction) and T4 (S-N direction) were also surveyed with a bistatic 80 MHz antenna (Fig. 4). For both fre-quencies, a continuous mode acquisition was used. The distances were measured using an odometer and each trace was collected at steps of 5 cm. Topography was also measured at a maximum of 10 m spacing along the same profiles using a theodolite. In-terpolated elevation contours above sea level are also shown in Figure 4.
GPR data processing
Using the software REFLEXW (Sandmeier, 2000), the following GPR data processing flux composed by seven steps (Xavier Neto et al., 2001) was applied to the raw data. The 1ststep is the zero offset correction. This step corrects the effect in propagation ti-mes caused by non-null separation between transmission and re-ception antennas, thus correctly positioning the Earth’s surface in the radargrams. The 2nd step is the removal of inductive ef-fects (WOW). WOW’s are efef-fects characterized by low frequency and high amplitude caused by inductive coupling between trans-mission and reception antennas. Usually, they appear in the early parts of the trace (Young et al., 1995). Because they mask shallow reflectors, they should be removed (Johansson & Mast, 1994). The 3rdstep is background removal where reverberations associ-ated with direct ground and air waves were eliminassoci-ated. Reverbe-rations appear in radargrams as flat repetitive reflectors, regularly distributed in time. They might be removed by subtracting an ave-raged trace which is build up from a given time/distance range of the actual section (Sandmeier, 2000). The 4thstep is amplitude recovering where spherical and exponential time gains (Sand-meier, 2000) were applied to the traces to correct effects caused by energy absorption and geometrical spreading, although pre-serving amplitude ratios in the traces. The 5thstep is F-K Migra-tion (Stolt, 1978) where lateral events were correctly posiMigra-tioned in time. In particular, diffractions patterns were concentrated in
their original points. The migration velocity (0.13 m/ns) was pre-viously estimated by fitting hyperbolas associated to diffraction patterns in non-migrated radargrams (Olhoeft, 2000). F-K migra-tion is a very good migramigra-tion tool if the medium is approximately homogeneous (Stolte, 1994), which is the case of sand dunes. The same velocity (0.13 m/ns) was also used for time-depth con-version. The 6thstep is a low-pass filtering and Automatic Gain Control (AGC) where spurious high frequency events were eli-minated with low-pass filtering using cutting frequencies around 250 MHz and 550 MHz for data measured with 80 MHz and 200 MHz, respectively. In this step amplitudes were equalized with AGC gain. AGC changes amplitude ratios in the traces but emphasizes continuity in geometrical features in radargrams, thus making easier to interpret internal sedimentary boundaries, as in the present study. Finally, the 7th step consists of topographic correction where effects due to the fact that the Earth’s surface is not flat are corrected in the radargrams. In this step, the standard approach described by Sandmeier (2000) was used. Examples of radargrams resulting from this processing flux are shown in Figures 5a to 9a.
RESULTS AND DISCUSSION GPR data interpretation
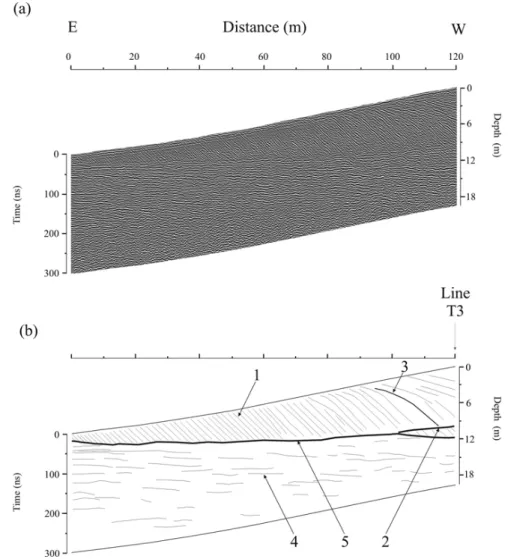
The resolution in the radargrams was sufficient to view in detail the internal sedimentary structures, (Figs. 5a, 5b and 6a): single foreset (as Mark 1, for example); the contact between two different dune generations, that is, a second order bounding surface (Mark 2); third order bounding surfaces (Mark 3); layers of sediments identified by Caldas et al. (2006) as beach ridges associated to marine deposits (Mark 4); contact between marine sediments on bottom and aeolian sediments on top (Mark 5). The water table was also detected (Mark 6) and its depth was checked by measu-ring the depth to the free water surface in the open well shown in Figures 2 and 4. The fact that Marks 5 and 6 appear as expected as very continuous and horizontal surfaces reveals that the proces-sing flux, in particular the migration and topographic correction steps, does not alter significantly the structures dips.
Stratigraphic units
JOSIBEL G. OLIVEIRA Jr, WALTER E. MEDEIROS, WERNER F. TABOSA and HELENICE VITAL
9
Figure 4– Topographic map of the studied dune. Contours are given in meters. The lines along which GPR and topographic profiles were measured and trenches were excavated are also indicated.
period of the last Holocene regression in the area. The conclusi-ons from Caldas et al. (2006) were based on vibracore descripti-ons and radiocarbon dating, besides GPR imaging. To corrobo-rate the results of Caldas et al. (2006), observe that inside these marine sediments, internal structures, indicated by Mark 4, ap-pear as subhorizontal layers in all E-W radargrams (e.g. Figs. 5, 6 and 7), which are parallel to the coastline. On the other hand, the same structures appear dipping toward the sea in radargrams orthogonal to the coastline (e.g. Fig. 8).
Figure 5 (a)– Processed GPR profile L, measured in E-W direction. Frequency center equals to 80 MHz.(b)– GPR profile L, measured in E-W direction. Interpretation: Mark 1 – individual foreset. Mark 2 – interface separating different dune generations or second order bounding surface. Mark 3 – third order bounding surface. Mark 4 – sand ridges associated to marine deposition. Mark 5 – interface separating marine sediments on bottom, and aeolian sediments on top. Mark 6 – water table.
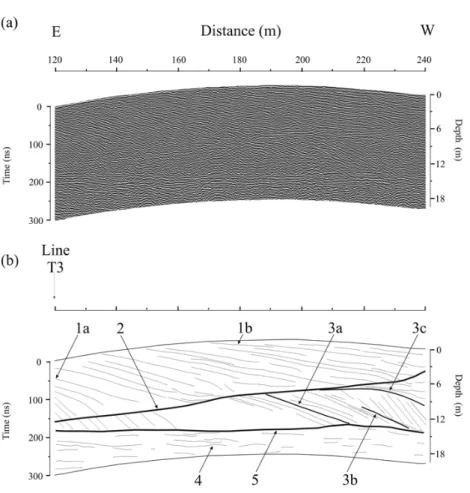
divided because its deposition history appears to be of more com-plex nature: judging by the variation of the foresets dips inside S1, several third-order bounding surfaces can be identified as Marks 3a, 3b, and 3c (Fig. 7b).
In addition it is possible to verify the dependence of the fo-reset dips with the dominant wind directions inside aeolian units S1 and S2. Regarding to S2 unit, note that the crossing point between profiles K (E-W direction) and T3 (S-N direction) are in-dicated both in Figures 7b and 8b. The same structure (Mark 1a), below this crossing point, shows angles around 9◦in E-W direc-tion (Fig. 7) and 0◦in S-N direction (Fig. 8), thus confirming that the maximum dip of the foreset occurs in the direction parallel to the dominant wind direction.
Regarding to S1 unit, the crossing point between profiles J (E-W direction) and T3 (S-N direction) is shown both in Figu-res 8b and 9b. The same foFigu-reset (Mark 1c), below this crossing point, shows angles around 10◦in E-W direction (Fig. 9) and 0◦ in S-N direction (Fig. 8). Therefore, judging by the similarities of the foresets dips inside S1 and S2, the prevailing past wind was probably very similar to the nowadays dominant wind.
Morphology change of the dune
According to McKee (1966), dome-shaped dunes lack a well-developed down-wind steep slip face. The most characteristic internal structure of dome-shaped dunes is the fact that foreset la-mina present low angles, even in the downwind part of the dune. In general, near the summit point, foresets are subhorizontal. The dominant depositional processes in dome-shaped dunes are tractional and grainfall depositions.
JOSIBEL G. OLIVEIRA Jr, WALTER E. MEDEIROS, WERNER F. TABOSA and HELENICE VITAL
11
Figure 6 (a)– Processed segment of GPR profile K (0 m–120 m), measured in E-W direction. Frequency center equals to 200 MHz.(b)– Segment of GPR profile K (0 m–20 m), measured in E-W direction. Interpretation: Marks 1 to 5 are described in the caption of Figure 5b. The crossing point with GPR profile T3 (Fig. 8) is indicated. A change in the dune morphology from barchan to dome-shaped is associated to the interpreted third order bounding surface indicated by Mark 3.
depositional surface may cause a change in the morphology of a dune (Harari, 1996).
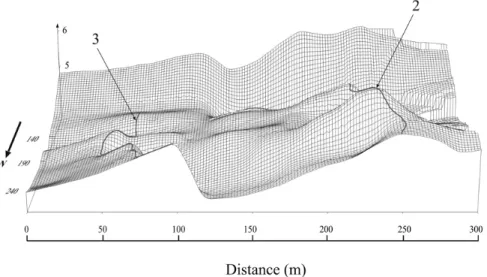
Nowadays the morphology of the studied dune is dome-shaped (Fig. 4). However, strong variation occur in the foreset dips along the wind direction inside stratigraphic unit S2: while in Figure 6 (Mark 1) the foreset dip is around 27◦, in Figure 7 the foreset dips present both intermediate values (9◦in Mark 1a) and low values (2◦in Mark 1b). Only the foreset dips present around the top of the dune are in accordance with its current dome shape. Figure 11 shows a 3D view of what would be the elevation of the dune if the sandy volume associated to the stratigraphic sub-unit S2b (Fig. 10) were removed. Observe that the shape of the southern ridge associated to the bounding surface
indica-ted by Mark 3 resembles a horn (Fig. 11). Because the northern ridge associated to the bounding surface indicated by Mark 3 is too close to the sea it might be very affected by erosion. By this reason, we did not use it in the interpretation.
Figure 7 (a)– Processed segment of GPR profile K (120 m–240 m), measured in E-W direction. Frequency center equals to 200 MHz.(b)– Segment of GPR profile K (120 m–240 m), measured in E-W direction. Interpre-tation: Marks 1a and 1b – individual foresets. Mark 2 – interface separating different dune generations or second order bounding surface. Marks 3a, 3b, and 3c – third order bounding surface. Mark 4 – sand ridges associated to marine deposition. Mark 5 – interface separating marine sediments on bottom and aeolian sediments on top. The crossing point with GPR profile T3 (Fig. 8) is indicated. Below this crossing point, the same foreset (Mark 1a), inside the second phase of aeolian deposition, shows angles around 9◦along E-W direction (this figure) and 0◦ along S-N direction (Fig. 8), as consequence of the E-W dominant wind direction.
sand is bimodal sorting. According to Mountney & Howell (2000), strata showing these characteristics may be the result of grain-flow and tractional depositional processes, respectively, in ac-cordance to the dominant processes described by McKee (1966) for barchan and dome-shaped dunes. Let us stress that foresets dips measured in the trenches are in a very good accordance with dips shown by radargrams (Figs. 5 to 7).
Interpretation of the data allows to discuss the shape of the dune during its evolution: the portion of the dune showing high foreset dips, associated to stratigraphic sub-unit S2a, was inter-preted as a remain of an older barchan dune. In other words, it is evidence that the present dome-shaped dune was previously a barchan.
The abrupt change of the foreset dips inside the
depo-JOSIBEL G. OLIVEIRA Jr, WALTER E. MEDEIROS, WERNER F. TABOSA and HELENICE VITAL
13
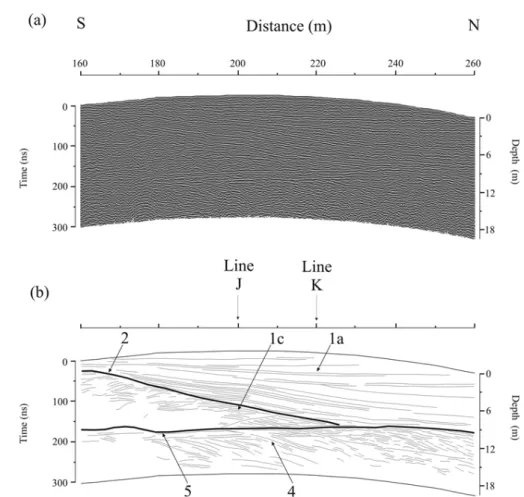
Figure 8 (a)– Processed segment of GPR profile T3 (160 m–260 m), measured in S-N direction. Frequency center equals to 200 MHz.(b)– Segment of GPR profile T3 (160 m–260 m), measured in S-N direction. Interpretation: Marks 1a and 1c – individual foresets. Mark 2 – interface separating different dune generations or second order bounding surface. Mark 4 – sand ridges associated to marine deposition. Mark 5 – interface separating marine sediments on bottom and aeolian sediments on top. The crossings points with GPR profiles J and K are indicated. Mark 1c (in this figure and in Fig. 9b) indicates foresets, inside the first phase of aeolian deposition, showing a similar dependence of the dips with wind direction as the dependence described for the foresets inside the second phase of aeolian deposition in Figure 7.
sition. This change in the depositional process ultimately cau-sed the change of the dune morphology from barchan to dome-shaped. In this way, the surface indicated by Mark 3 is the asso-ciated third-order surface (Brookfield, 1977).
Depositional history of the area
Four stages for conduction of the depositional processes in the area are recognized (Figs. 14a to 14d): Stage 1 corresponds to deposition of marine sediments (stratigraphic unit S0 in Fig. 10) during the final period of the last Holocene marine regression (Fig. 14a) (Caldas, 2002; Caldas et al., 2006). After the expo-sure of the area (stage 2 in Fig. 14b) aeolian deposition took place (stratigraphic unit S1 in Fig. 10) over the marine sedi-ments. Later, a depositional hiatus happened, probably affected
by erosion on parts of the dune and, finally, a second phase (sta-ges 3 and 4 in Figs. 14c and 14d, respectively) of aeolian depo-sition occurred (stratigraphic sub-units S2a and S2b in Fig. 10), covering all previous strata.
Figure 9 (a)– Processed segment of GPR profile J (80 m–180 m), measured in E-W direction. Frequency center equals to 200 MHz. (b)– Segment of GPR profile J (80 m–180 m), measured in E-W direction. Interpretation: Mark 1c – individual foreset. Mark 2 – interface separating different dune generations or second order bounding surface. Mark 4 – sand ridges associated to marine deposition. Mark 5 – interface separating marine sediments on bottom and aeolian sediments on top. The crossings points with GPR profile T3 is indicated. Mark 1c (in this figure and in Fig. 8b) indicates foresets, inside the first phase of aeolian deposition, showing a similar dependence of the dips with wind direction as the dependence described for the foresets inside the second phase of aeolian deposition in Figure 7.
CONCLUSIONS
The GPR survey imaged the internal sedimentary structures of the coastal deposits so that it was possible to reconstruct the depositional history of the area, because the resolution in the radargrams was sufficient to view in detail the internal sedimentary structures. The fundamental objective of the radar data proces-sing was to enhance the geometry of the internal structures of the due; this justify the application of a AGC gain filter. The studied dune is located near S˜ao Bento do Norte and Caic¸ara do Norte towns, in the northern coastline of Rio Grande do Norte State, Northeastern Brazil.
Based on the relationship among the internal structures of
the dune, particularly the differences in geometry of the structu-res as seen in GPR profiles surveyed along directions parallel and perpendicular to the dominant wind, it was possible to recons-truct the evolution of the dune.
Initially, marine sediments were deposited during the final period of the last Holocene marine regression. Inside these ma-rine sediments, internal structures appear as subhorizontal layers in all radargrams parallel to the coastline. On the other hand, the same structures appear dipping toward the sea in radargrams orthogonal to the coastline, thus corroborating the results of Caldas et al. (2006) about its marine origin.
de-JOSIBEL G. OLIVEIRA Jr, WALTER E. MEDEIROS, WERNER F. TABOSA and HELENICE VITAL
15
Figure 10– Stratigraphic units: S0 – marine sediments. S1 and S2 – aeolian sediments. S2 was divided in two sub-units S2a and S2b. This figure may be compared with Figure 5.
Figure 11– 3D view of what would be the elevation of the dune if the sandy volume associated to the stratigraphic sub-unit S2b (Fig. 10) were removed. Curves indicated by the numbers 2 and 3 correspond to the ridges of the bounding surfaces in-dicated by Marks 2 and 3 in Figure 5b, respectively. This view was constructed using all surveyed radargrams. All dimensions are given in meters and the reference system is the same used in Figure 4. The front view of this figure corresponds to section along GPR profile L (Fig. 5); thus just the southern ridge of surface indicated by Mark 3 can be seen.
position occurred, directly over marine sediments, followed by a depositional hiatus, when erosion may have occurred in parts of the existing dune. Finally, a second phase of aeolian deposition occurred, covering all previous strata.
It is interpreted that in the second phase of aeolian deposition the dune changed its morphology from barchan to dome-shaped.
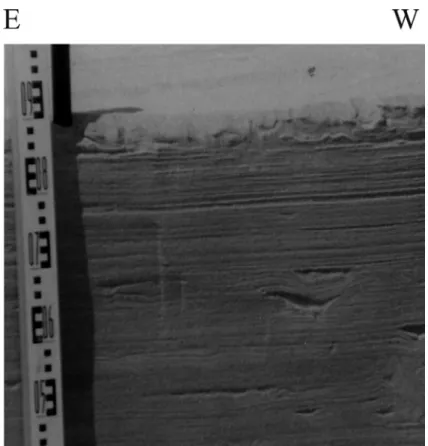
Figure 12– Photograph of the trench excavated in the bottomset of the dune in position 0 m (Fig. 4). Parallel laminae with thicknesses varying from 3 to 6 cm and dips between 25◦and 30◦can be seen. These laminae were associated to grainflow depositional process in a previous barchan stage of the present dome-shaped dune.
JOSIBEL G. OLIVEIRA Jr, WALTER E. MEDEIROS, WERNER F. TABOSA and HELENICE VITAL
17
Figure 14 (a)– Schematic model for the four-stages depositional history of the area. Stage 1 – deposition of marine sediments during the last Holocene regression.
The previous dominant winds were very similar to the pres-ent-day dominant wind, at least in direction. So, the rapid migra-tion process of the dune toward urban areas is an entirely natural process.
ACKNOWLEDGEMENTS
Financial support to this study was given by MAMBMAR´E (Proc. CNPq n◦ 468045/2000-7 – CNPq-CTPETRO), “K¨uste-nentwicklung und Heutige K¨ustendynamik in Rio Grande do Norte – Ne-Brasilien” (GTZ/DFG), and PROBRAL CAPES/DAAD (98/072 and 150/02), an international cooperation between Bra-zil and Germany. The GPR equipment was acquired with PADCT 3/CNPq/FINEP financial support. J.G. Oliveira Jr. and W.F. Tabosa thank Brazilian Agency CAPES for the PhD fellowships in Germany, during the period September 2002–August 2003. W.E Medeiros and H. Vital thank CNPq for the research fel-lowships (PQ). Adriano, Anne, Arthur, Ozian, and Valdocir helped in the field survey. Dr. Aderson F. do Nascimento kindly revised the English text.
REFERENCES
BRISTOW CS & JOL HM. 2003. Ground Penetrating Radar in Sediments. Geological Society of London. Special Publication No. 211. 330 pp.
BRISTOW CS, PUGH J & GOODALL T. 1996. Internal structure of aeolian dunes in Abu Dhabi determined using ground-penetrating ra-dar. Sedimentology, 43: 995–1003.
BROOKFIELD ME. 1977. The origin of bounding surfaces in ancient aeolian sandstone. Sedimentology, 24: 303–332.
CALDAS LHO. 1996. Geologia costeira da regi˜ao de S˜ao Bento do Norte e Caic¸ara do Norte, Litoral Norte Potiguar. Relat´orio de Graduac¸˜ao, Departamento de Geologia, UFRN, 83 pp.
CALDAS LHO. 2002. Late Quaternary coastal evolution of the northern Rio Grande do Norte coast, NE Brazil. Unpublished PhD Thesis, Institute of Geosciences, University Christian-Albrechts zu Kiel, 92 pp.
CALDAS LHO, OLIVEIRA Jr JG, MEDEIROS WE, STATTEGER K & VITAL H. 2006. Geometry and evolution of Holocene transgressive and regres-sive barriers on the semi-arid coast of NE Brazil. Geo-Marine Letters, 26: 249–263.
COSTA NETO LX. 1997. Evoluc¸˜ao geol´ogica-geomorfol´ogica recente da plataforma continental interna ao largo do Delta do Rio Ac¸u, Macau-RN. Dissertac¸˜ao de Mestrado, Programa de P´os-Graduac¸˜ao em Geologia e Geof´ısica Marinha, UFF, 214 pp.
DAVIS JL & ANNAN AP. 1989. Ground Penetrating Radar for high reso-lution mapping of soil and rock stratigraphy. Geophysical Prospecting, 37: 531–551.
GAWTHORPE RL, COLLIER REL, ALEXANDER J, LEEDER MR & BRIDGE JS. 1993. Ground Penetration Radar: application to sand body geometry and heterogeneity studies. Geological Society, London, Special Publica-tion, 73: 421–432.
HARARI Z. 1996. Ground Penetrating Radar (GPR) for imaging strati-graphic features and groundwater in sand dunes. Journal of Applied Geophysics, 36: 43–52.
HAYT Jr WH. 1988. Engineering Electromagnetic. 5thed. London:
McGraw Hill, 496 pp.
HUGGENBERGER P. 1993. Radar facies: recognition of facies patterns and heterogeneities within Pleistocene Rhine gravels, NE Switzerland. Geological Society, London, Special Publication, 75: 163–176.
HUSTEDT S. 2000. Aeolian morphodynamics in the region S˜ao Bento do Norte on the NE-coast of Brazil. Unpublished MSc. dissertation, Univer-sity Christian-Albrechts zu Kiel, 102 pp.
IDEMA. 1999. Secretaria de Planejamento e Financ¸as. Instituto de Desenvolvimento Econˆomico e Meio Ambiente do Rio Grande do Norte – IDEMA. Informativo Municipal: S˜ao Bento do Norte, 5: 1–14.
JOHANSSON EM & MAST JE. 1994. Three dimensional ground penetra-ting radar imaging using synthetic aperture time-domain focusing. SPIE, 2275: 205–214.
McKEE ED. 1966. Structures of dunes at White Sands National Monu-ment, New Mexico (and a comparison with structures of dunes from other selected areas). Sedimentology, 7: 3–69.
McKEE ED. 1979. Sedimentary structures in dunes. In: McKEE ED (Ed.). A study of global sand seas. US Geol. Survey. Prof. Pap., 1052: 83–113.
MOUNTNEY N & HOWELL J. 2000. Aeolian architecture, bedform clim-bing and preservation space in the Cretaceous Etjo Formation, NW Namibia. Sedimentology, 47: 825–849.
NEAL A. 2001. Ground-penetrating radar and its use in sedimentology: principles, problems and progress. Earth-Science Reviews, 66: 261– 330.
NEAL A & ROBERTS CL. 2000. Applications of ground penetrating radar (GPR) to sedimentological, geomorphological studies in coastal envi-ronments. In: PYE K & ALLEN JRL (Ed.). Coastal and Estuarine Environ-ments: sedimentology, geomorphology and geoarchaeology. Geological Society London Special Publications, 175: 139–171.
NEAL A & ROBERTS CL. 2001. Internal structure of a trough blowout, determined from migrated ground-penetrating radar profiles. Sedimen-tology, 48: 791–810.
OLHOEFT GR. 2000. Maximizing the information return from ground penetrating radar. Journal of Applied Geophysics, 43: 175–187.
JOSIBEL G. OLIVEIRA Jr, WALTER E. MEDEIROS, WERNER F. TABOSA and HELENICE VITAL
19
e localizac¸˜ao de dutos de ´oleo enterrados. Dissertac¸˜ao de Mestrado, PPGG, UFRN, 86 pp.
OLIVEIRA Jr JG, MEDEIROS WE, VITAL H, XAVIER NETO P & STATTEG-GER K. 2003. GPR imaging of the internal structure of a sand dune in Rio Grande do Norte State, Brazil. Journal of Coastal Research. Special Issue, 35: 271–278.
PEDERSEN K & CLEMMENSEN LB. 2005. Unveiling past aeolian lands-capes: a ground-penetrating radar survey of a Holocene coastal dunefield system, Thy, Denmark. Sedimentary Geology, 177: 57–86.
ROTH K, SCHULIN R, FL ¨UHER H & ATTINGER W. 1990. Calibration of time domain reflectometry for water content measurement using a com-posite dielectric approach. Water Resources Research, 26: 2267–2273.
RUBIN DM & HUNTER RE. 1985. Why deposits of longitudinal dunes are rarely recognized in the geologic record. Sedimentology, 32: 147–157.
SANDMEIER KJ. 2000. REFLEXW, Version 1.4, program for processing of seismic, acoustic or electromagnetic reflection and transmission data, version 1.4, Karlsruhe, Germany, 197 pp.
SCHENK CJ, GAUTIER DL, OLHOEFT GR & LUCIUS, JE. 1993. Internal structure of an aeolian dune using ground penetrating radar. Spec. Publs. Int. Assoc. Sediment, 16: 61–69.
SILVA FG & SCHERER CMS. 2000. Morphological characterization of ancient aeolian dunes using the ground-penetrating radar, Botucatu Formation, Southern Brazil. Revista Brasileira de Geociˆencias, 30(3): 531–534.
STOLT R. 1978. Migration by Fourier transformation. Geophysics, 43: 23–48.
STOLTE C. 1994. E-MIGRATION: Image Enhancement for Subsurface Ob-jects of Constant Curvature in Ground Probing Radar Reflection Data. Unpublished PhD. Thesis, University Christian-Albrechts zu Kiel, 87 pp.
SUTINEN R. 1992. Glacial deposits, their electrical properties and sur-veying by image interpretation and ground penetrating radar. Geological Survey Finland Bulletin, 359: 1–123.
TABOSA WF. 2000. Dinˆamica costeira da regi˜ao de S˜ao Bento do Norte e Caic¸ara do Norte-RN. Relat´orio de Graduac¸˜ao, Departamento de Geo-logia, UFRN, 76 pp.
TABOSA WF. 2002. Monitoramento Costeiro das Praias de S˜ao Bento do Norte e Caic¸ara do Norte – RN: Implicac¸˜oes para o P´olo Petrol´ıfero de Guamar´e. Dissertac¸˜ao de Mestrado, PPGG, UFRN, 112 pp.
TABOSA WF, LIMA ZMC, VITAL H & GUEDES IMG. 2001. Monitora-mento Costeiro das Praias de S˜ao Bento do Norte e Caic¸ara do Norte – NE Brasil. Revista Pesquisas em Geociˆencias, 28: 383–392.
TOPP GC, DAVIS JL & ANNAN AP. 1980. Electromagnetic determination of soil water content: measurements in coaxial transmission lines. Water Resources Research, 16: 574–582.
TSOAR H. 1982. Internal structures and surfaces geometry of longitudi-nal (seif) dunes. J. Sed. Petrol., 52: 823–831.
VAN DAM RL. 2002. Internal structure and development of an aeo-lian river dune in the Netherlands, using 3-D interpretation of ground-penetrating radar data. Netherlands Journal of Geosciences, 81: 27–37.
VILAC¸A JG, CUNHA EMS & SILVEIRA IM. 1991. Levantamento Hidro-geol´ogico do Munic´ıpio de Galinhos. Anais IV Congresso Nordestino de Ecologia. Recife: SNE, p. 56.
XAVIER NETO P & MEDEIROS WE. 2006. A practical approach to cor-rect attenuation effects in GPR data. Journal of Applied Geophysics, 59: 140–151.
XAVIER NETO P, OLIVEIRA Jr JG & MEDEIROS WE. 2001. Processamento de dados de GPR como uma etapa imprescind´ıvel para obtenc¸˜ao de boas imagens sobre solos condutivos: Um exemplo associado `a localizac¸˜ao de dutos. 7thInternational Congress of the
Bra-zilian Geophysical Society. Salvador. CD-ROM.
YOUNG RA, DENG Z & SUN J. 1995. Interactive processing of GPR data. The Leading Edge, April, 275–280.
NOTES ABOUT THE AUTHORS
Josibel Gomes de Oliveira J´uniorreceived a BS (1998) in physics, a MS in geophysics (2001), and a PhD (2006) in geophysics, all degrees from Federal University of Rio Grande do Norte, Brazil. He studied in Germany, at the Christian-Albrechts Universit¨at zu Kiel (2003), as part of his PhD research. He worked with seismic processing in CGG (2005-2006) and Brain Tecnologia (2006-2007). Presently he is working as geophysicist at Flamoil Servic¸os Ltda., in Natal/RN, Brazil. His areas of interest are processing and acquisition of seismic and GPR data. He is a member of SBGf.
Walter Eugˆenio de Medeirosreceived a BS (1981) in civil engineering from Federal University of Rio Grande do Norte, a MS (1987) in geophysics from Federal University of Bahia, and a PhD (1993) in geophysics from Federal University of Par´a, Brazil. He is professor of Federal University of Rio Grande do Norte since 1983. His professional interests include inverse problems in geophysics, near-surface geophysics and exploration geophysics. He is a member of SBGf, SEG, and AAPG.