Is There a Difference in Credit Constraints Between Private and Listed
Companies in Brazil? Empirical Evidence by The Cash Flow Sensitivity
Approach
Alan Nader Ackel Ghani
PhD Student, Business Administration Department, School of Economics, Administration and Accounting, University of São Paulo e-mail: [email protected]
Roy Martelanc
Professor, Business Administration Department, School of Economics, Administration and Accounting, University of São Paulo e-mail: [email protected]
Eduardo Kazuo Kayo
Professor, Business Administration Department, School of Economics, Administration and Accounting, University of São Paulo e-mail: [email protected]
Received on 4.28.2014 – Desk acceptance 5.2.2014 – 2nd version accepted 9.2.2014
ABSTRACT
This article analyzes the credit constraints, using the cash flow sensitivity approach, of private and listed companies between 2007 and 2010. According to this approach, the econometric results show that the credit constraints are the same for either private or listed com-panies. This paper seeks to contribute to the literature because the study of credit constraints of private companies based on cash flow sensitivity in Brazil has been rare.
1 INTRODUCTION
ter correlation between cash low and investment. Given this hypothesis, the main objective of this study is to use the cash low sensitivity approach to determine whether private companies indeed have higher credit constraints, compared to listed companies. Although there have been other studies of the cash low sensitivity of Brazilian com-panies, including those by Terra (2003) and Aldrighi and Bisinha (2010), the application of this approach for priva-te companies is unprecedenpriva-ted in Brazil.
A comparison of investment-cash low sensitivity be-tween private and listed companies was conducted throu-gh econometric analysis in a dynamic panel, using a sam-ple obtained from the Institute for Accounting, Actuarial and Financial Research Foundation (Fundação Instituto de Pesquisas Contábeis, Atuariais e Financeiras - Fipe-cai), consisting of 164 listed companies and 688 private companies in the period from 2007 to 2010.
he results showed no diference in credit constraints for listed or private companies because the diference in investment-cash low sensitivity was not statistically sig-niicant between them, according to the cash low sensi-tivity approach.
At irst, an interaction term was used to diferentiate listed companies from private ones. To analyze robust-ness, estimates were also obtained using separate regres-sions (only private companies) and other methods: OLS (ordinary least squares) or OLS with lagged dependent variables, in addition to irst-diference GMM (generali-zed method of moments; Wooldridge, 2002). In all of the cases, the results were very similar.
In addition to this introduction, the present study is organized as follows: section 2 presents a literature re-view on the topic, and section 3 presents the econome-tric methodology. Section 4 describes the sample data, whereas the econometric results are shown and analyzed in section 5, and finally, in section 6, the final conclu-sions are presented.
According to Fazzari, Glenn and Petersen (1988), in-formation asymmetry causes capital constraints by rai-sing the costs of external inancing1 (debt or issuance of
shares), because shareholders and creditors will charge premiums for taking the risk of inancing struggling com-panies, masked by the lack of information transparency between managers and investors. he less transparent the information of a company is, the more diicult (high inte-rest rates or legal inte-restrictions) it will be to obtain credit or to issue shares to inance its operating activities. In turn, the greater the information asymmetry is, the more the company will use internal funds to inance its investments because these companies have higher constraints regar-ding external sources of capital.
To measure the degree of corporate capital constraints, Fazzari et al. (1988) proposed an econometric model in which investment was a function of Tobin’s Q (a variable that captures future investment opportunities) and opera-ting cash low. According to this approach, if the company did not have capital constraints, investment would not be signiicantly correlated with cash low because the com-pany would use credit or the issuance of shares to inance itself, and all cash surplus would be distributed in the form of dividends. Conversely, if the company had external i-nancing constraints generated by information asymmetry between managers and investors, the cash low would have a signiicant and positive correlation with investment. his approach to measuring the degree of capital constraints of companies is known as cash low sensitivity (investment sensitivity to cash low luctuations). In summary, the hi-gher the information asymmetry of a company is, the grea-ter the exgrea-ternal inancing constraints are, relected in incre-ased investment-cash low sensitivity.
In principle, private companies, due to having more information asymmetry in light of the lower require-ments regarding information transparency to the market, should have greater credit constraints caused by a
2 LITERATURE REVIEW
he measurement of capital constraints by the econo-metric cash low sensitivity approach, controlled by other variables (usually Tobin’s Q), is a very current topic and has been widely discussed in corporate inance.
his line of research began with an article by Fazzari et al. (1988). In this study, the authors partitioned the sample ac-cording to the distributions of dividends, based on the follo-wing premise: companies that pay fewer dividends are con-sidered more constrained because they would have to retain cash to fund their investments. In addition to conirming this hypothesis, the article encouraged the application of the cash low sensitivity approach in several subsequent studies
that attempted to capture the capital constraints for diferent companies from the perspective of diferent variables (size, credit rating, inancial market proximity, asset tangibility).
Hoshi (1991), for example, found that companies with close relationships to bankers (belonging to a keiretsu – a Japanese industrial group) have fewer capital constraints. Furthermore, Gilchrist and Himmelberg (1995) showed that companies that undergo credit rating evaluations (commercial paper issuers) have lower credit constraints, while Carpenter and Petersen (2002) showed that new irms linked to the technology sector had more external inancing constraints.
Moreover, Almeida and Campelo (2007) showed the importance of collateral (tangibility) in reducing cre-dit constraints. In the following year, Ratti, Lee and Seol (2008) showed that banking concentrations reduced the credit constraints of companies.
In Brazil, Aldrighi and Bisinha (2010) showed that large companies had higher investment-cash low sensi-tivity, contradicting the results of Terra (2003), who sho-wed that large companies and multinationals had lower credit constraints. However, the author showed that, with the exception of these two groups, Brazilian companies exhibited, on average, capital constraints from 1986 to 1997. To reach this conclusion, Terra adopted two dife-rent approaches: the classical approach, in which Tobin’s Q appears as a control variable in the cash low sensiti-vity model; and another approach, in which current and lagged income replaces Tobin’s Q to capture investment opportunities. Both models reached the same results.
Brown and Petersen (2009) drew attention to the in-crease in cash low sensitivity coeicients over the years. To the authors, this decline indicated lower capital cons-traints due to the development of the stock market in the United States (creation of Nasdaq - National Associa-tion of Securities Dealers Automated QuotaAssocia-tions, in the 1970s) and a greater weight of investments in intangible assets not captured in previous studies.
However, there have been studies criticizing this ap-proach. Kaplan and Zingales (1997), Cleary (1999) and Kadapakkam, Kumar and Riddick (1998) questioned the cash low sensitivity methodology. In broad terms, the studies showed that companies with better inancial he-alth (more cash availability, lower levels of debt) are those with the highest investment-cash low sensitivity.
In Moyen’s view (2004), diferences in the interpre-tation of the investment-cash low sensitivity coeicient result from the type of sample partitioning. If this rela-tionship is tested for samples rated according to infor-mation asymmetry criteria (size, retention of dividends, capital control, among others), cash low sensitivity will
capture capital constraints, as initially proposed by Fazza-ri et al. (1988). However, if companies are grouped accor-ding to factors related to the availability of internal funds, the investment-cash low sensitivity coeicient will have the opposite relationship, i.e., the better that the inancial health of a company is, the greater the investment-cash low sensitivity is.
Cleary (2007) conirmed the interpretation of Moyen (2004), using a theoretical model (U curve) that was empi-rically tested. In his study, the results showed that support the works by Fazzari et al. (1988) and by Kaplan and Zin-gales (1997). Guaraglia (2008) also conirmed the U cur-ve. To reach this conclusion, the author analyzed private companies in the UK. If companies are rated according to information asymmetry criteria, the investment-cash low sensitivity increases with increasing constraints. Ho-wever, if companies are rated according to the availability of internal funds or with inancial indices, the greater the capital constraints are, the lower the investment-cash low sensitivity is.
he notion behind the U curve is that companies in bad inancial conditions would use more credit to invest and ensure their survival (negative relationship) when fa-cing cash low reductions. Conversely, companies in good inancial condition, as their cash low increased, would use more internal funds to invest not to sufer a capital cost increase (cost efect). According to the author, the central point for the divergence of results is to understand whether, in fact, credit constraints are conditioned by in-formation asymmetry or by issues related to the inancial performances of companies.
Another issue raised in the literature (Alti, 2003) is that the use of Tobin’s average Q in the regression as a non-observable proxy of Tobin’s marginal Q can generate biased results in the interpretation of cash low sensitivity. Despite the diferences in the interpretation of cash low sensitivity, the investment-cash low sensitivity con-tinues to be investigated fairly and to be used as a credit constraint measurement.
3 ECONOMETRIC METHODOLOGY
Because the present study investigates the investment--cash low sensitivity – including for private companies – the use of Tobin’s Q as a control variable will not be
possible, because the market value of private companies is not available. In this case, the sales accelerator model used by Terra (2003) is adopted:
he sales accelerator model assumes that the invest-ment made in a given year is a function of current inco-me and incoinco-me from the previous year. Incoinco-me increa-ses would signal greater investment opportunities due to the need for company growth. hus, the income variable would replace Tobin’s Q as an indicator variable of invest-ment opportunities.
In the absence of capital constraints, which assume the-re is no difethe-rence in costs between internal inancing and external inancing to the company, the investment should be inanced only with debt equity or the issuance of sha-res, and all of the cash low generated should be distribu-ted in the form of dividends. hus, if cash low is reladistribu-ted to investment, it is an indication of capital constraints, to
α
β
(
)
+
β
(
− −)
+
β
β
I
K
Inc
K
Inc
/
K
(
CF
/
K
F
K
)
u
the extent that the company uses internal funds to inance itself (Fazzari et al., 1998). hus, the cash low variable (
) is included in the sales accelerator model described above to capture capital constraint. As in Aldrighi and Bisi-nha (2010), the EBITDA variable is used as a proxy for cash low (
CF
it), which is obtained from the sum of operatingincome plus depreciation. Variable is the investment in ixed assets (Capex - capital expenditure) held by a parti-cular company during year t. he investment is calculated by the diference between the ixed assets from one year to another. Variables and represent the company’s income in year t and the previous year t-1, respectively. he Dit.CFit variable represents the interaction term to captu-re the difecaptu-rence in the cash low coeicient between listed and private companies (private D=0, and listed company D=1). All of the variables were divided by ixed assets from the previous year ( ) to avoid size distortions.
he model hypothesis is the same as that discussed in the previous sections. If the coeicient of the cash low has a signiicant relationship with investment, that is an indication of capital constraint; otherwise, there is no cre-dit constraint. In turn, the interaction dummy measures the existence of diferences in credit constraints between private and listed companies. It is worth remembering that the cash low coeicient of listed companies is the linear combination (sum) of the cash low coeicient and interaction dummy.
he analysis is performed by the irst-diference GMM technique proposed by Arellano and Bond (1991). Widely used in this literature, the use of the lagged dependent variable (dynamic panel) is justiied by the correlation between current investment and past investment. It is re-asonable to assume that unobservable, idiosyncratic ixed factors of the company afect investment decisions and are related to the explanatory variables (income and cash low). In this case, the ixed efect is removed by the irst diference. However, the presence of the lagged variable
using the irst diference generates endogeneity that is corrected with instrumental variables that are the higher lags of the explanatory variables in the model. he use of these instruments must be validated by the Sargan test (Wooldridge, 2002), and the errors should not be auto--correlated. he statistics of these tests are presented in section 5 (Result Analysis).
It is worth noting that these instruments only solve the problem generated by the actual removal of ixed efects from the dynamic panel. It is reasonable to question that the-re might be a simultaneity bias between cash low and invest-ment. his type of endogeneity, in this line of research, has been little explored in the literature. In fact, the investment made in one year can generate cash low in the same year. However, this efect is small in almost all cases because the investment is relatively small relative to existing assets, and such investment generates cash low for a limited number of months during the year. herefore, it is expected that the incremental cash low generated by investment during the year is small, compared to the existing cash low.
Although the focus of interest is the irst-diference GMM, the results are reported by POLS and dynamic POLS (with the lagged dependent variable), although in these cases, stronger assumptions are required regarding the relationship between the error and the explanatory variables. he presentation of results using other techni-ques requires more robustness of the study in that it asses-ses the stability of results when using diferent techniques. Finally, questions could be raised regarding the issues of multicollinearity and autocorrelation between the va-riables. Regarding the issue of (imperfect) multicollinea-rity between income and cash low, it is noted that such problems do not lead to estimation bias, leading only to an increase in the standard error of the estimator. In contrast, autocorrelation could be a problem in the case of large pa-nels. However, in small panels, as in the case of the present study, this issue becomes negligible (Wooldridge, 2002).
2 The Fipecai sample is used for the publication of the “Largest and Best” by Exame Magazine. We thank Fipecai for the data provided for the study.
4 DATA DESCRIPTION
Data for the study were provided by Fipecai2. he
sample consists of annual balance sheet data (2007, 2008, 2009, 2010) of the top 1,000 companies (private and lis-ted companies) ralis-ted by Fipecai according to net income. he “Top 1,000” correspond to the 1,000 highest net inco-me values for each year. Because the data from 1,000 com-panies were provided for the four years mentioned, the initial sample included 4,000 observations. However, not all of the companies were included in the sample for each year. here have been companies that have reached a cer-tain level of income in one year but not in a diferent year. In addition, some companies have not reported the data required for the study. hus, the inal sample consisted of 852 companies and 2,651 observations in an unbalanced panel. Of these companies, 81% are private, and 19% are listed (Table 1).
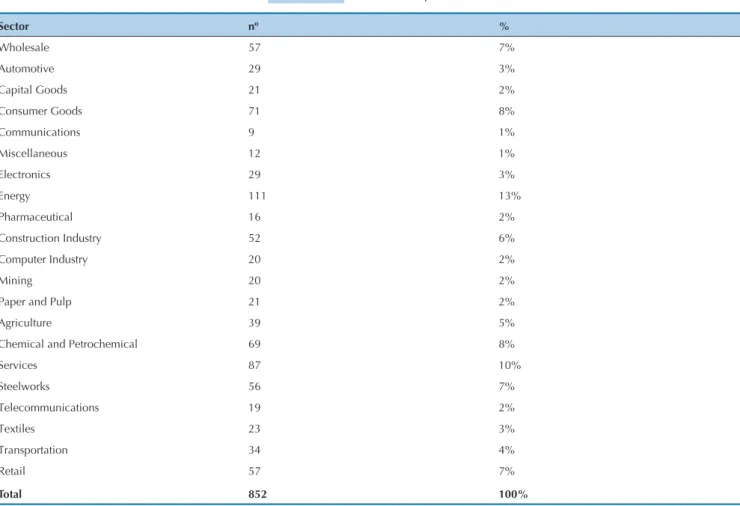
Table 2 shows the sample composition by sector. It is worth remembering that this type of study excludes inan-cial companies because there would not be a clear divi-sion among inancing, investment and operating results. According to table 2, the stock market in Brazil is well diversiied, with emphases on the energy and services sec-tors. Of this total, 67% of the sample companies are Brazi-lian and private, 8% are BraziBrazi-lian state-owned companies, and the remainder are foreign multinationals.
Capital Control nº %
Listed companies 164 19%
Private companies 688 81%
Total 852 100%
Source: Fipecai
Table 3 shows the mean and median values of the study variables. he discrepancy between the mean and the median in the sample is explained by the existence of observations with high values in the sample. he results show that investment has remained almost stable over
the years, with slight increases in 2007 and 2010. In those same years, cash low and income had the highest means and medians, compared to other periods. It is worth no-ting that the economy exhibited growth of 6.09% in 2007 and 7.53% in 2010 (Banco Central, 2012).
5 RESULTS AND ANALYSIS
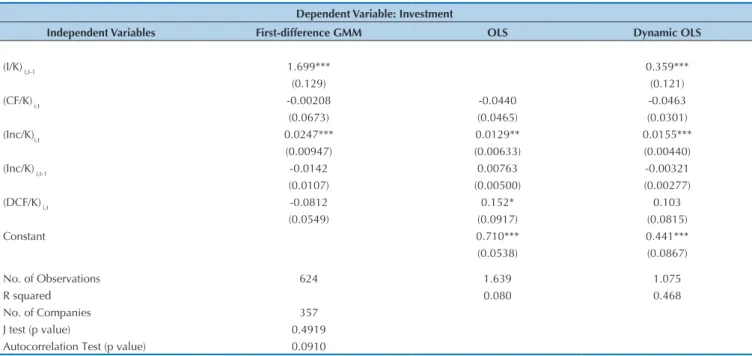
Table 4 presents the results using the interaction dummy to capture the diferences in the cash low coeicient of private and listed companies. It is interesting to note that despite the
diferent methods used, the results point in the same direc-tion, indicating no diference in the investment-cash low sen-sitivity between the listed companies and private companies.
Sector nº %
Wholesale 57 7%
Automotive 29 3%
Capital Goods 21 2%
Consumer Goods 71 8%
Communications 9 1%
Miscellaneous 12 1%
Electronics 29 3%
Energy 111 13%
Pharmaceutical 16 2%
Construction Industry 52 6%
Computer Industry 20 2%
Mining 20 2%
Paper and Pulp 21 2%
Agriculture 39 5%
Chemical and Petrochemical 69 8%
Services 87 10%
Steelworks 56 7%
Telecommunications 19 2%
Textiles 23 3%
Transportation 34 4%
Retail 57 7%
Total 852 100%
Source: Fipecai
Table 2 Sector Composition
Source: Prepared by the author with Fipecai data
Variables 2007 2008 2009 2010
Mean Median Mean Median Mean Median Mean Median
Income/Kt-1 44.39 4.91 34.28 4.76 22.74 4.30 59.72 5.50
Cash Flow/Kt-1 1.44 0.45 1.97 0.49 1.39 0.37 7.80 0.46
Investment/Kt-1 4.59 0.04 3.56 0.04 3.77 0.04 4.71 0.07
lated by the “annualization” of the average daily trading volume per company in the stock exchange divided by its market value. he results indicate that the turnover is much lower in Brazil than in the US. While the median Brazilian turnover is 21%, the 1st quartile is 4%, and the
3rd quartile is 55%, in the US, the median turnover is 82%,
the 1st quartile is 4%, and the 3rd quartile is 178%. It could
also be argued that the similar behavior between listed and private companies in Brazil is related to the perfor-mance of private equity funds that increase the liquidity of private companies. Nevertheless, the results are consis-tent with the study of Chen and Chen (2012), showing the disappearance of the investment-cash low sensitivity in companies located in the US during the inancial crisis in that country but without identifying a speciic cause for the phenomenon. From the perspective of Brown and Pe-tersen (2009), the disappearance of the investment-cash low sensitivity is linked to investments in intangible as-sets not captured in balance sheets and to the develop-ment of the capital market. Both argudevelop-ments could be valid in the Brazilian context. he investment data used in this study refer only to investments in ixed assets. hus, there could be a dependency of the cash low on investments in intangible assets not captured by a limitation of the study data. In turn, the development of the capital market might have led Brazilian companies to become less dependent on their internal cash low to inance their expansion. Such a line of thinking is conirmed by the growing num-ber of initial public oferings (IPOs) during the period. In 2007, 64 companies made public oferings of its shares.
Another factor that might have reduced the capital cons-traints was the credit incentive promoted by the Brazilian government (release of funds and reduction of the interest rate) during the US banking crisis, aiming to avoid the stag-he results show that lagged investment during a
pe-riod is correlated with the investment during the follo-wing year. Such a result is also intuitive because compa-nies that invested more in the past tend to invest more in the subsequent year to maintain the same level of opera-ting activities. It is noteworthy that the instrumentaliza-tion through the use of the lagged dependent variable in the dynamic panel was validated by the Sargan test and the error autocorrelation test, at a 5% signiicance level.
In turn, the interaction dummy was signiicant only for 10% of the model by OLS without the lagged depen-dent variable. However, it is worth noting that the cash low coeicient for listed companies is measured by the sum of the interaction dummy with the cash low of the regression and not by the isolated value of the interac-tion dummy. In the three models, the cash low coeicient of listed companies is not signiicant for the linear form (sum of cash low with the interaction dummy).
In other words, the three methods indicate that there were no diferences in credit constraints for listed compa-nies, compared to private companies. his result does not conirm the hypothesis that listed companies should have lower capital constraints as a result of having less informa-tion asymmetry. A possible explanainforma-tion for this inding is that private companies within the top 1,000 companies can have a high level of disclosure (information transpa-rency) due to being very large companies with high ma-rket visibility that might consider IPOs in the near future.
Another possible explanation for the phenomenon is that Brazilian companies have low turnover, behaving in practice as private companies. To support this hypothesis, the turnover of Brazilian companies was calculated with data from the Capital IQ database and was compared with the turnover of US companies. he turnover was
calcu-Dependent Variable: Investment
Independent Variables First-difference GMM OLS Dynamic OLS
(I/K) i,t-1 1.699*** 0.359***
(0.129) (0.121)
(CF/K) i,t -0.00208 -0.0440 -0.0463
(0.0673) (0.0465) (0.0301)
(Inc/K)i,t 0.0247*** 0.0129** 0.0155***
(0.00947) (0.00633) (0.00440)
(Inc/K) i,t-1 -0.0142 0.00763 -0.00321
(0.0107) (0.00500) (0.00277)
(DCF/K) i,t -0.0812 0.152* 0.103
(0.0549) (0.0917) (0.0815)
Constant 0.710*** 0.441***
(0.0538) (0.0867)
No. of Observations 624 1.639 1.075
R squared 0.080 0.468
No. of Companies 357
J test (p value) 0.4919
Autocorrelation Test (p value) 0.0910
Note: Source - Fipecai. *** p<0.01, ** p<0.05, * p<0.1. Robust errors in brackets. Instruments validated by Sargan test (H0: instruments are valid). Lack of autocorrelation between errors in irst difference (H0: lack of irst-order autocorrelation). K: ixed assets in t-1. I: Investment. Inc: Income. DCF: Interaction dummy to capture differences between the coeficient of listed and private companies.
nation of Brazilian companies. It is worth mentioning that, in addition to the increase in the credit volume, the basic in-terest rate of the economy continued on a downward trend.
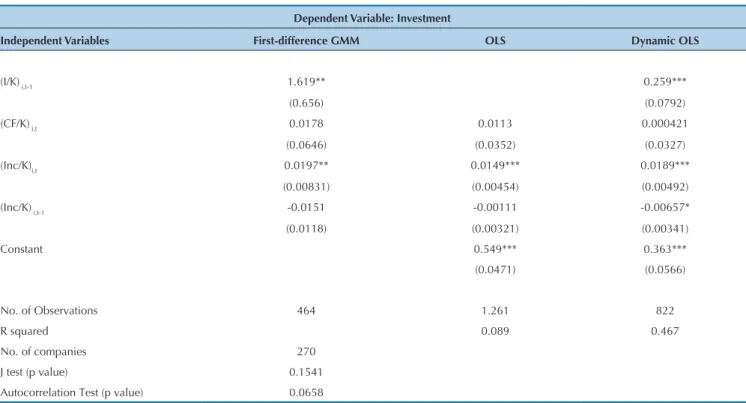
To give more robustness to the results, regressions were
obtained separately for the private and listed companies. he results were similar to the model with the use of the in-teraction dummy, evidencing no credit constraint in both cases (Tables 5 and 6).
Dependent Variable: Investment
Independent Variables First-difference GMM OLS Dynamic OLS
(I/K) i,t-1 -0.449*** 1.003***
(0.0419) (0.108)
(CF/K) i,t -0.0708 -1.371 0.00383
(0.231) (1.324) (0.557)
(Inc/K)i,t 0.0292 0.450 0.189
(0.0759) (0.359) (0.162)
(Inc/K) i,t-1 -0.00312 0.170 -0.123
(0.0600) (0.237) (0.115)
Constant -0.361 -0.275
(0.706) (0.469)
No. of Observations 160 378 256
R squared 0.311 0.901
No. of Companies 90
J test (p value) 0.3743
Autocorrelation Test (p value) 0.9876
Note: Source - Fipecai. *** p<0.01, ** p<0.05, * p<0.1. Robust errors in brackets. Instruments validated by Sargan test (H0: instruments are valid). Lack of autocorrelation between errors in irst difference (H0: lack of irst-order autocorrelation). K: ixed assets in t-1. I: Investment. Inc: Income.
Table 5 Regression Results for the Sample with Only Listed Companies
Dependent Variable: Investment
Independent Variables First-difference GMM OLS Dynamic OLS
(I/K) i,t-1 1.619** 0.259***
(0.656) (0.0792)
(CF/K) i,t 0.0178 0.0113 0.000421
(0.0646) (0.0352) (0.0327)
(Inc/K)i,t 0.0197** 0.0149*** 0.0189***
(0.00831) (0.00454) (0.00492)
(Inc/K) i,t-1 -0.0151 -0.00111 -0.00657*
(0.0118) (0.00321) (0.00341)
Constant 0.549*** 0.363***
(0.0471) (0.0566)
No. of Observations 464 1.261 822
R squared 0.089 0.467
No. of companies 270
J test (p value) 0.1541
Autocorrelation Test (p value) 0.0658
Note: Source - Fipecai. *** p<0.01, ** p<0.05, * p<0.1. Robust errors in brackets. Instruments validated by Sargan test (H0: instruments are valid). Lack of autocorrelation between errors in irst difference (H0 lack of irst-order autocorrelation). K: ixed assets in t-1. I: Investment. Inc: Income.
6 CONCLUSION
ther interesting result was the disappearance of the invest-ment-cash low sensitivity during the analyzed period. A similar result was found by Chen and Chen (2012), but for companies in the US during the banking crisis there. his evidence suggests a common dynamic of investment-cash low sensitivity for both countries during the crisis. Based on Brown and Petersen (2009), the development of the ca-pital market and the increase in investments in intangible assets could have explained the non-dependence on cash low for investments in ixed assets during the analyzed period. Another possible explanation might be related to credit incentives from the government that could have re-duced the dependence on cash low for investments from 2007 to 2010.
his study analyzed the credit constraints of Brazilian companies from 2007 to 2010 by the cash low sensitivity approach. he results showed that there is no diference in the investment-cash low sensitivity between listed and private companies. According to the cash low sensitivi-ty approach, there is no diference in credit constraints between listed and private companies. his evidence su-ggests that the degree of information asymmetry of listed and private companies might be the same in Brazil for the analyzed sample. Additionally, the results might have been inluenced by the low turnover of Brazilian listed companies, by the performance of private equity funds in private companies, and by the high rate of the disclosure of information transparency of private companies.
Ano-Almeida, H., & Campello, M. (2007). Financial constraints, asset tangibility and corporate investments.he Review of Financial Studies, 20(5), 1429-1460.
Alti, A. (2003). How sensitive is investment to cash low when inancing is frictionless? Journal of Finance, 58, 707–722.
Arellano, M., & Bond, S. R. (1991). Some speciication tests for panel data: Monte Carlo evidence and an application to employment equations.
Review of Economic Studies, 58, 277-298.
Aldrighi, D. M., & Bisinha, R. (2010). Restrição ao crédito em Empresas com Ações Negociadas na BOVESPA. Revista Brasileira de Economia,
64(1), 25-47.
Banco Central do Brasil (2012). Sistema Gerenciador de Séries Temporais. Recuperado em 15 julho, 2012 de https://www3.bcb.gov.br/sgspub/ localizarseries/localizarSeries.do?method=prepararTelaLocalizarSeries. Brown, J. R., & Petersen, B. C. (2009). Why has the investment-cash
low sensitivity declined so sharply? Rising R&D and equity market developments. Journal of Banking and Finance, 33, 971-984. Carpenter, R. E, & Petersen, B. C. (2002). Capital Market Imperfections,
High-Tech Investment, and new equity inancing. he Economic Journal, 112. Chen, H. J., & Chen, S. J. (2012). Investment-cash low sensitivity can-not
be a good measure of inancial constraints: Evidence from the time series. Journal of Fi-nancial Economics, 103, 393-410.
Cleary, S. (1999). he relationship between irm investment and inancial status. Journal of Finance, 54(2), 673-692.
Cleary, S., Povel, P., & Raith, M. (2007). he U-shaped investmetn curve: heory and evidence. Journal of Financial and Quantitative Analysis, 42, 1-40.
Fazzari, S. M., Glenn, R. H., & Petersen, B. C. (1988). Financing constraints and corporate investment. Brookings Papers on Economic Activity, 1, 141-206.
Guaraglia, A. (2008). Internal inancial constraints, external inancial constraints, and investment choice: Evidence from a panel of UK irms. Journal of Banking and Finance, 32, 1795-1809.
Gilchrist, S., & Himmelberg, C. P. (1995). Evidence on the role of cash low for investment equations. Journal of Monetary Economics, 36, 541-572. Hoshi, T., Kashyap, A. K., & Scharfstein, D. (1991). Corporate structure,
liquidity, and investment: Evidence from Japanese panel data.
Quarterly Journal of Economics, 106, 33-60.
Kadapakkam, P., Kumar, P. C., & Riddick, L. A. (1998). he impact of cash lows and irm size on investment: he international evidence.Journal
of Banking and Finance,22, 293-320.
Kaplan, S., & Zingales, L. (1997). Do investment cash low sensitivities provide useful measures of inancing constraints? Quarterly Journal of
Economics, 112(1), 169-215.
Moyen, N. (2004). Investment-cash low sensitivities: constrained versus unconstrained irms. he Journal of Finance, LIX(5).
Ratti, R. A., Lee, S., & Seol, Y. (2008). Bank concentration and inancial constraints on irm-level investment in Europe. Journal of Banking and Finance, 31, 2684-2694.
Terra, M. C. (2003). Credit constraints in Brazilian irms: evidence from panel data. Revista Brasileira de Economia, 57(2).
Wooldridge, J. M. (2002). Econometric analysis of cross section and panel data. Cambridge, Mass.: MIT Press.