Analysis of the Relevance of Information Content of the Value Added
Statement in the Brazilian Capital Markets
*Márcio André Veras Machado
Ph.D Professor, Department of Management, Federal University of Paraíba E-mail: [email protected]
Marcelo Alvaro da Silva Macedo
Ph.D Professor, Department of Accounting Sciences, Federal University of Rio de Janeiro E-mail: [email protected]
Márcia Reis Machado
Ph.D Professor, Department of Finances and Accounting, Federal University of Paraíba E-mail: [email protected]
Received on 12.09.2013– Desk acceptance on 01.03.2014 – 2nd version accepted on 12.19.2014
ABSTRACT
The usefulness of financial statements depends, fundamentally, on the degree of relevance of the information they disclose to users. Thus, studies that measure the relevance of accounting information to the users of financial statements are of some importance. One line of research within this subject is in ascertaining the relevance and importance of accounting information for the capital markets: if a par-ticular item of accounting information is minimally reflected in the price of a share, it is because this information has relevance, at least at a certain level of significance, for investors and analysts of the capital markets. This present study aims to analyze the relevance, in the Brazilian capital markets, of the information content of the Value Added Statement (or VAS) – referred to in Brazil as the Demonstração do Valor Adicionado, or DVA. It analyzed the ratio between stock price and Wealth created per share (WCPS), using linear regressions, for the period 2005–2011, for non-financial listed companies included in Melhores & Maiores (‘Biggest & Best’), an annual listing published by Exame Magazine in Brazil. As a secondary objective, this article seeks to establish whether WCPS represents a better indication of a company’s result than Net profit per share (in this study, referred to as NPPS). The empirical evidence that was found supports the concept that the VAS has relevant information content, because it shows a capacity to explain a variation in the share price of the companies stu-died. Additionally, the relationship between WCPS and the stock price was shown to be significant, even after the inclusion of the control variables Stockholders’ equity per share (which we abbreviate in this study to SEPS) and NPPS. Finally, the evidence found indicates that the market reacts more to WCPS (Wealth created per share) than to NPPS. Thus, the results obtained give some indication that, for the Brazilian capital markets, WCPS may be a better proxy concept for referring to a company’s result than NPPS.
Keywords: relevance of accounting information, Value Added Statement, wealth created.
DOI: 10.1590/1808-057x201512240
1 INTRODUCTION
performance indicator. his is very similar to the indication of value added presented in the VAS, the main diference being inclusion in economic value distributed of invest-ments in the community – which include voluntary con-tributions and investment of funds in the community as a whole. his fact shows a perceived relevance of value added created and distributed, and also its recognition internatio-nally, whether in the manner suggested in the guidelines of the GRI, or according to current accounting standards.
Accounting is not only a technique. It is recognized that social questions can inluence accounting and that this, in turn, can mobilize and change the behavior of the user. Ho-wever, these interactions have been little investigated. he relationship between accounting and social aspects is usu-ally indicated and presumed, we can say, rather than des-cribed and analyzed (Burchell, Clubb, & Hopwood, 1985).
From the point of view of accounting as an institutio-nal and social practice, in the view of authors of the Bri-tish school, in the ‘perfect world (the hypothesis of eicient markets, without transaction costs, information perfectly disseminated between agents, etc.) that economists tend to use as a basis of work, there is no space for accounting’ (Lopes & Martins, 2005, p. 24). On this line of thinking, ac-counting needs to be widely inserted into a social and cul-tural context (Burchell et al., 1985; Lopes & Martins, 2005; Zanchet & Martins, 2011).
he Value Added Statement (VAS), the focus of this investigation, exists in this context – since it is a state-ment that aims to show the value added generated by the entity, and how this value is distributed between all those who have made the efort to create that value, which in-cludes not only the holders of capital, but also employees, who provide the workforce, other parties that inance the company’s activity, society as a whole – through charges and contributions paid to the government, and how much is retained in the company.
It is in this context, then, that an attempt is thus made to analyze the efect of publication of a VAS being made obligatory – by means of a value relevance study of the information about wealth created; and whether the VAS contains information that is relevant for the Brazilian ca-pital markets.
In other words the study aims to ascertain the relevan-ce of the information content of the VAS for the Brazilian capital markets. It analyses the relationship between share price and the VAS of non-inancial listed companies inclu-ded in the list of Maiores & Melhores, adopting Wealth Cre-ated Per Share (WCPS) as a proxy for the result of the VAS, for the period 2005 through 2011. Maiores & Melhores (‘Bi-ggest and Best’) is a listing published annually by Exame
Magazine, in partnership with the Accounting, Actuarial and Financial Studies Foundation (Fundação Instituto de Pesquisas Contábeis, Atuárias e Financeiras, orFIPECAFI). As a second objective, this article seeks to ind out whether WCPS, in that period, was a better proxy than Net Proit
he usefulness of inancial statements depends, funda-mentally, on the relevance of the information that is publi-shed to users. In general, accounting information can be said to be relevant when it has certain characteristics, such as: (i) that it helps to reduce the asymmetry of information between internal users (e.g. managers, executives, etc.) and external users of the company (stockholders, creditors, go-vernment, etc.); or (ii) that it helps the user to evaluate the potential efect of past, present and future transactions on future cash lows (predictive value) and/or to conirm or correct prior evaluations (conirmatory value); or (iii) when its use alters the user’s decision, that is to say, when the user takes a diferent decision than he/she would otherwise have taken without certain information.
he relative importance of accounting information can be observed from various points of view, since there is a va-riety of users. Studies that seek to analyze the relationship between companies’ market value and accounting igures are referred to as “value relevance” studies. hese studies aim to determine the relevance of a given item of tion to the capital markets, by seeing whether that informa-tion is relected in a company’s stock prices. Barth, Beaver, and Landsman (2001) considered an item of information to be relevant if it was correlated with the company’s ma-rket valuation.
hese studies, as Brown, Lo, and Lys (1999) point out, are normally made using regression analyses, using as a dependent variable a proxy related to the share price, and as independent variables certain accounting information, most commonly proxies related to proit and stockholders’ equity. Barth et al. (2001) add that these surveys are focu-sed on the coeicients of the items of accounting informa-tion in the regression equainforma-tion. In other words, to be of importance, an item of accounting information has to have a non-zero coeicient in the regression equation.
Some of the studies of this type, referred to as Relative Association Studies, aim to make a comparative analysis of the importance of alternative accounting information items. Recently, some of these studies have looked at the efects of the process of harmonization of Brazilian accoun-ting rules with international inancial reporting standards. In Brazil, this process of convergence began oicially with Law 11638 of 2007, which changed Law 6404/1976 (known in Brazil as ‘the Corporate Law’), making several changes to accounting law so as to approximate Brazilian accounting to international accounting.
Per Share (NPPS), which is a measurement commonly used as a proxy for accounting information.
A suicient reason for this survey would be the fact that
studies on the subject are scarce, possibly because the value added statement is not obligatory, internationally, and in Brazil has been obligatory only for listed companies, and only since 2007. It is known that inclusion of a new obli-gatory statement causes an increase of work, and conse-quently costs, for its preparation, auditing and publication – a further justiication for studies investigating whether
providing it does provide beneit to users. And this can be
studied by consideration from the point of view of value re-levance. Finally, earlier studies exist, but their results have not yet provided suicient grounds for a signiicant
state-ment on whether the VAS has information content, espe-cially since they covered shorter periods.
his article has ive sections. he next (Section 2)
pre-sents the theoretical framework, dealing with the concept of the relevance of accounting information, and the Value Added Statement. Section 3 deals with methodology; and Section 4 with the results of the investigation. he ith
sec-tion is the conclusion, and is followed by the bibliography.
2 VALUE RELEVANCE: THE STUDY OF THE RELEVANCE OF ACCOUNTING
INFORMATION
he aim of accounting is to measure and
communica-te the group of economic events relacommunica-ted to the results of the subject entity. Relevant accounting information can be considered to be whatever changes the ‘state of the art’ of the entity’s user’s knowledge about the entity, since, ater
interpretation, he/she uses it to solve problems (Yamamoto & Salotti, 2006).
In this sense, the study of the role of accounting as pro-vider of information to the capital markets is extremely important for evaluating the eiciency of accounting
in-formation (Iudícibus & Lopes, 2004). he importance of
information for the capital markets is not only in the ques-tion of allocaques-tion of funds, but also in the establishment of prices of securities, ater risks and returns have been
consi-dered (Hendriksen & van Breda, 1999).
hus, using the inancial market as their test laboratory,
these studies seek to establish the relevance of a given item of accounting information for the capital markets. In other words, they seek to establish whether accounting informa-tion is able to help users evaluate the potential efects of
past, present and future transactions (i.e. whether it has predictive value), and/or conirm or correct their prior
va-luations (conirmatory value), based on the eicient
ma-rkets hypothesis – that prices of shares relect all and any
information that is relevant and available, and adjust the-mselves as a function of this group of information (Famá, 1970).
Holthausen and Watts (2001) classify value relevance studies in three categories, and any individual study may be in more than one of them: (i) “Relative association stu-dies”, which, like this present study, compare the associa-tion between the market value of shares (or changes in those values) and various forms of measurement, such as an existing accounting standard, or one that is being pro-posed. hese studies normally compare the R2 of regression
models, in which an accounting standard with a higher R2
is evaluated as more relevant; (ii) “Incremental association studies”, which investigate whether the accounting compo-nent analyzed serves as an indicator of igures such as, for
example, proit or returns, over periods of time (it being
important to include other variables). A factor is conside-red to be relevant if its estimated regression coeicient is
signiicantly diferent from zero; and (iii) “Marginal
infor-mation content studies”, which investigate whether a given factor increases investors’ power in relation to the infor-mation available. Typically, event study methodologies are used, in which the interest lies in assessing whether the availability of certain information is associated with alte-rations of asset value (price reactions) – in which reactions are considered to be indications of relevance.
here are various studies that aim to ascertain the
re-levance of accounting information. hese start with Ball
and Brown (1968), and Beaver (1968), which, according to Yamamoto and Salotti (2006) were the precursors of this type of study. Other important studies, according to Ko-thari (2001), and Iudícibus and Lopes (2004), have been: Beaver, Clarke, and Wright (1979); Beaver, Lamber, and Morse (1980); Collins, Maydew, and Weiss (1997); Brown et al. (1999); and Lopes (2001, 2002a and 2002b).
Other studies to be mentioned include: Foster (1977); Board and Walker (1990); Strong and Walker (1993); Harris, Lang, and Moller (1994); Collins, Pincus, and Xie (1999); Francis and Schipper (1999); Dhaliwal, Subra-manyam, and Trezevant (1999); Sarlo Neto (2004); Costa and Lopes (2007); Lopes, Sant’Anna, and Costa (2007); Galdi and Lopes (2008); Bastos, Nakamura, David, and Rotta (2009), Malacrida (2009) and Zanini, Cañibano, and Zani (2010).
Various authors, such as Brown et al. (1999); Kothari (2001); Holthausen and Watts (2001); and Barth, Beaver, and Landsman (2001) began the debate on the relationship between the relevance of accounting information and alter-native accounting standards and rules.
Based on this theoretical framework, some studies tried to show the impact of changes in accounting standards on the relevance of the information produced by accounting and, more recently, on the efects of the process of
(2008), Chalmers, Clinch, and Godfrey (2008), Morais and Curto (2009), Chalmers, Clinch, and Godfrey (2009), Kadri, Aziz, and Ibrahim (2009) and Lima (2011) showed gains in the relevance of accounting information when there was a mi-gration from a local standard to the international standard. In the contrary sense, the work of Niskaen, Kinnunen, and Ka-sanen (2000), Van der Meulen, Gaeremynck, and Willekens (2007) and Morais and Curto (2008) showed that changes
resulting from the process of accounting harmonization with IFRS did not give rise to any gains in relevance, or that any such changes were not signiicant.
hat is the context of this study, which examines the
relevance of accounting information in an environment of changes, especially in the context of presentation of the Va-lue Added Statement (VAS) becoming obligatory for Brazi-lian listed companies.
3 THE VALUE ADDED STATEMENT
(
VAS
)
he Value Added Statement (VAS, or DVA as referred
to in Brazil) aims to report the wealth generated by a com-pany, and its distribution between the elements that con-tribute to the generation of that wealth, i.e. to set out the portion of the value added that is allocated to: holders of capital; other inanciers of the entity’s activity; employees;
society as a whole – and how much is retained in the com-pany.
Value added refers to the increase in wealth generated by the productive use of the firm’s resources before its alloca-tion among shareholders, bondholders, workers, and the government. Thus, while the profit is the final return ear-ned by the shareholders, the value added refers to the total return earned by the team of workers, capital providers, and the government. (Riahi-Belkaoui, 1992, p. 1)
he wealth created, the subject of the DVA, is
unders-tood to mean the increase in value that the company attri-butes to the inputs of production for which payment was made to other parties during the production process. Gross wealth created can be calculated as the arithmetic dif
eren-ce between the value reeren-ceived as a result of sales and the amount paid for inputs to outside parties; net wealth crea-ted is understood to be gross wealth creacrea-ted adjuscrea-ted by the efect of depreciation.
he information used in the Value Added Statement
is, normally, extracted from the Proit and Loss Account
(PLA); but they have complementary, rather than similar, objectives. he priority of the PLA is to emphasize net pro-it, while the priority of the VAS is to show the portion of
value added that is allocated to the holders of the capital. In the PLA the other portions of value added that are alloca-ted to employees, to the government and to external i
nan-ciers appear as expenses.
It can be said that the PLA uses the criterion of type, while the VAS uses the criterion of beneit. For example
in the PLA the salaries of employees involved in the pro-duction process are considered as costs, and the salaries of management staf as expenses. In the DVA, whatever their
nature – cost or expense – salaries paid are part of the value added allocated to employees, that is to say, the criterion
of the beneit of the income, on its own, is used (Iudícibus,
Martins, Gelbcke, & Santos, 2010).
he VAS became better known at the end of the 1970s
in various European countries, achieving popularity in the United Kingdom, with the publication of heCorporate
Re-port, in 1975, by the Accounting Standards Steering Com-mittee. hat publication, among other things,
recommen-ded a statement of Value Adrecommen-ded, showing how the beneits
of the eforts of the enterprise are shared between
employe-es, providers of capital, the state and reinvestment. he
re-commendation was accepted by the UK government and, in 1997, a legislative proposal put forward that the “value added statement would be the future of reporting” (Bur-chell, Clubb, & Hopwood, 1985; Riahi-Belkaoui, 1992). he
result was that the number of companies that prepared a VAS increased, each year. A survey in 1980, in the UK, re-ported that one-ith of large companies produced a VAS in
that period (Riahi-Belkaoui, 1992).
In Brazil, until 2007, the VAS was not obligatory. Howe-ver, the Brazilian Securities Commission (Comissão de Va-lores Mobiliários, or CVM) had been encouraging compa-nies to prepare and publish the VAS since 1992. It was only in December 2007 that Law 11638/07 made publication of the VAS obligatory for listed companies.
he current Corporate Law in Brazil considers the VAS
to be a inancial statement similar to the other statements,
based on the data extracted from the accounting records.
he Accounting Pronouncements Committee (Comitê de
Pronunciamentos Contábeis, or CPC), in Technical Pro-nouncement CPC 09 (of 2008), established the framework for preparation and disclosure of the VAS, and stated that it is one of the elements comprising the set of a company’s
inancial statements, and that the great majority of the data
for its preparation is obtained from the Proit and Loss
Account. he model presented by the CPC is very similar
to the model suggested by FIPECAFI, which was used by many companies before it became obligatory. CPC 09 spe-ciies that the model to be followed for the VAS is in two
parts. he function of the irst part is to show the total value
ten treated separately from the Social statement, and pre-sented in a manner similar to the other accounting state-ments, such as the PLA, the Statement of inancial position
(balance sheet), and the Statement of cash low. In other words it is understood that due to its relevance, the VAS can be regarded both as the economic component of the social statement, and the social component of the inancial statements.
Riahi-Belkaoui (1992) states that the VAS has the follo-wing advantages: (i) it provides a good organizational climate for workers, by highlighting their importance for the company’s inal result; (ii) it supplies a more practical manner of agreeing bonuses, with the possibility of tying them to value added; (iii) it is helpful in predictions and diagnostics; (iv) it helps in the measurement of national income; (v) it serves as a measure of scale and size, for companies; (vi) it serves as a basis for negotiations with employees; (vii) it helps in forecasting of proits, expected returns and the total risk associated with securities; (viii) it demonstrates the portion of value added that relates to the employees, indicating the scale of their importance to ma-nagement; (ix) it provides a better image of the company’s policies on re-investment, by showing separately the funds generated internally for replacement of ixed assets; (x) for multinationals, it provides information to the host country, as to their contributions to the process of local economic development; and (xi) it serves as an index of performance. As well as the advantages of the VAS put forward by Riahi-Belkaoui (1992), especially in the Brazilian context, it can be used as a tool to evaluate companies’ contributions when granting tax beneits – as well as being an alternative for calculation of GDP. As Santos (2007, p. 38) adds: ‘[...] it appears to be beyond doubt that it helps in the calcula-tion of GDP and of extremely important social indicators. In this statement, decisions on investments by area, region, state, etc. will have an excellent instrument for the solution of conlicts.’
Internationally, empirical investigations on the VAS are not plentiful, possibly because international accounting standards do not include the VAS as part of the group of
inancial statements to be presented in the annual report, so that their disclosure is voluntary (Van Staden, 2000).
he existing studies include investigations on the use of the VAS (Van Staden, 1998; Stainbank, 2009), and studies focu-sed on the magnitude of their information content (Riahi--Belkaoui & Fekrat, 1994; Riahi(Riahi--Belkaoui & Picur, 1994; Riahi-Belkaoui & Picur, 1999).
Riahi-Belkaoui and Fekrat (1994) analyzed the varia-tion and persistence of performance indicators derived from the value added statement, and indicators extracted from the inancial statements. he variables they used were net value added, operational cash low, representing a me-tric arising from the cash method of reporting, and proit, representing a method based on the accrual method. Data was used from 673 US companies, over the period 1981– 1990. he results showed indicators based on net value added presenting lower variability and greater persistence than indicators based on net proit or operational cash low. (Revenue) – (Inputs acquired from third parties) –
(De-preciation, amortization and depletion) + (Value added received by transfer)
he function of the second part of the VAS is to show how the value added is distributed between the agents that contributed to its generation: (i) employees: through sala-ries and beneits received, and payments to the employe-es’ FGTS funds; (ii) the government: through federal, state and municipal taxes, which represent the remuneration for the social, political and economic structure that provided the conditions necessary for the company to operate; (iii)
inancing entities: remuneration of capital from third par-ties, through interest, rentals, rights of authorship, etc.; and (iv) holders of the company’s capital: remuneration of that capital, through dividends, Interest on Equity [a speciically Brazilian alternative form of dividends], retained earnings and/or losses for the period.
he model for a VAS given by CPC 09 does not include voluntary contributions, and investments of funds in the community as a whole, nor contributions allocated to en-vironmental issues. On this subject, Fregonesi (2009) pro-poses that social and environmental investments should be declared separately in the DVA, in a speciic line within the listing of purposes of allocation of value added, and should include investments with the following features: (i) there is a disbursement by the investor company that is separate from and in addition to payments expended on the pro-duction process, or, at least, the amount should have been recorded in the company’s accounting; (ii) there is a be-neit for the community further to those provided by the company’s existence alone; (iii) the inal consumption of the good or service that is the subject of social investment takes place in the community; (iv) the disbursement is not a compensation for negative external factors generated by the production process; (v) the disbursement does not re-present consumption of goods or services used in the pro-duction process; and (vi) there is no use of a tax incentive system in the form of deduction from tax payable.
De Luca (1998) considers that the VAS is part of the ‘social statement’ whose purpose is to present informa-tion of an economic nature to the various users, demons-trating the economic performance of the company and its relationships with society. In the view of Santos (2007), the VAS is a component of the Social Statement and ‘should be understood as the most competent manner created by Accounting of assisting in the measurement and reporting of an entity’s capacity to generate, and distribute, wealth’ (Santos, 2007, p. 37). Note that both Santos (2007) and De Luca (1998) take the view that the VAS is an integral part of the ‘Social Statement’.
of-Also, the authors highlighted that accounting risk measu-res based on net value added have a higher association with the market than measures based on proit or cash low.
he utility of net cash low for explaining the return on shares of a sample of US companies was investigated by Riahi-Belkaoui and Picur (1994). he study investigated whether net value added and variation in net value added were relevant for predicting return. For this, the authors assumed (i) that the stock price relects information that is included in the annual net value added of a past time series; and (ii) that the stock price relects information from a past series on annual variation of net value added. he result of the study indicated that both value added, and its variation, are relevant in indicating the return on shares; and that net value added has a better association with return than the variation in net value added.
Riahi-Belkaoui and Picur (1999) evaluated the useful-ness of replacing proit by net value added in a model for valuation of companies. For this study, they used the model of Feltham and Ohlson (1995), replacing proit, as a mea-sure of wealth, by net value added. he sample of the study was the companies listed on the NYSE and AMEX that had data for the period from 1978 to 1995 in COMPUSTAT: a total of 3,999 observations. he results indicated that net value added is more successful than proit for predicting price. hese authors highlight the need for valuation mo-dels to include relevant elements of information that are not components of proit, such as net value added; they also highlight the predictive power of net value added.
In Brazil some studies, from this same point of view, de-serve mention. Scherer (2006) investigated whether value added, as supplied by the VAS spontaneously published by companies in Brazil over the period from 2000 to 2004, was relevant, for the Brazilian capital markets. With a very
si-milar methodology to the one used in the present study, the author concluded that value added is a signiicant element of information, although it was not shown to be superior to proit and stockholders’ equity.
In the study by Crippa and Coelho (2012), there is the same line of investigation, but using a sample of listed com-panies in the period from 2007 to 2010, which included a period during which publication of the VAS was manda-tory. he authors found evidence that there is a signiicant positive relationship between the wealth generated by the companies of the sample and the return on their shares; and thus concluded that wealth created was relevant for the Brazilian capital market.
Barros, Catapan, Scherer, and Isidoro (2013) continued Scherer’s study of 2006, but analyzing a more recent period, during the whole of which publication of the VAS was obli-gatory in Brazil. However, the results were very diferent from those found by Scherer (2006), since this study found no evidence of relevance of value added, with the exception of the companies listed on the specialized segments of the BM&FBOVESPA (the São Paulo Stock Exchange) that re-quire commitments to higher levels of corporate governance.
Finally, more recently, the study by Martins, Machado, and Callado (2014) evaluated how much value relevan-ce the Statement of Cash Flow and the VAS added to the group of inancial statements in the context of the Brazilian equities market. heir principal result was to show that the VAS, represented by the variable Wealth Created, did not show any information content added in isolation into the group of inancial statements, nor when added jointly with the Statement of Cash Flow. hese authors took the view that this can be explained by the fact that the VAS does not present new content, beyond what has already been presen-ted in the Proit and Loss Account.
4 METHODOLOGY
4.1 Characterization of the investigation.
A choice was made in favor of an empirical-analytic study. According to Martins (2002, p. 34), “(...) these are approaches using markedly quantitative techniques of col-lection, treatment and analysis (...). here is a strong focus on the causal relationship between variables. Validation of scientiic proof is sought through tests with instruments, degrees of signiicance, and systematization of operational deinitions”.
4.2 Sample.
he process of sampling is not probabilistic, since it starts with a naturally restricted universe: the companies chosen were those on the listing in the database of Melhores & Maiores, an annual publication of Exame Magazine, in partnership with FIPECAFI.
To be part of the sample, the companies had to have the following characteristics:
◆ Not be a listed inancial company.
◆ Have information available on the databases of Melhores
& Maiores, and Economática, in the period from 2005 to 2011.
he resulting database of Exame and Fipecai provided a total of 1,271 units of analysis, of which 376 units did not have valid information, leading to a total of 895 units. For 184 of these, information was not found in the database of Economática, resulting in 711 valid units for analysis.
Finally, the study has a possible limitation in that it in-cludes companies that presented VASs voluntarily in the period from 2005 to 2007. his could result in the study having a bias in that only the companies that had some in-terest in the publication of VASs brought this information into evidence.
4.3 Econometric model.
Adopting the methodology of Collins et al. (1997), Cos-ta and Lopes (2007), Morais and Curto (2008) and Macedo, Machado, Murcia, and Machado (2011), a linear regression was used to analyze whether the VAS presented value rele-vant information content, as per Equations 1:
+ 1
Where:
= A dependent variable, representing the share price of company i, at time t;
= Intercept; = Slope coeicient;
WCPS = An independent variable resulting from divi-sion of wealth created, taken from the VAS, by the number of the shares of company i, at time t;
= Random error (white noise) with normal distribu-tion, zero mean and constant variance.
Having in mind that other factors, as well as wealth created, may inluence the share price, certain control variables were included in the empirical analysis, to en-sure robustness. hese are: Net proit per share (NPPS) and Stockholders’ equity per share (SEPS) – since these variables were found in a large part of the studies on va-lue relevance, such as Collins, et al. (1997), Costa and Lo-pes (2007), Morais and Curto (2008) and Macedo et al. (2011).
hus, an analysis was made of whether WCPS has re-levant information content, ater control by NPPS and by SEPS. he objective is to analyze whether there is an in-formation gain when WCPS (Equation 3) is added to the model with NPPS and SEPS (Equation 2).
α
α
α
23
To analyze whether there was a gain or a loss of con-tent when the WCPS was included, the adjusted R2 of the
regressions was compared. hus, if the adjusted R2 of
Equa-tion 3 was greater than the adjusted R2 of Equation 2, it
could be concluded that there was an information gain and, thus, that the VAS has value relevance. Additionally, the Wald test was used.
he comparison of the models using the Wald test, via F statistics, is preferable to the comparison through adjusted R2
(Heij, de Boer, Franses, Kloek, & van Dijk, 2004). For this, the original model, referred to as the restricted model (Equation 2), needs to be compared with the model with the new explanatory variables added, referred to as the unrestricted model (Equa-tion 3). he objective is to evaluate whether the inclusion of the variable WCPS improves the explanatory power of the model. For this test, the F statistic is calculated as per Equation 4:
4
Where:
:
R
2 from the unrestricted model (Equation 3);: from the restricted model (Equation 2);
m: number of restrictions;
n: number of observations;
k: number of coeicients of the unrestricted model. For price, the price of the company’s share with the hi-ghest liquidity on April 30 of the year subsequent to that of the published inancial statements was used. he data for we-alth created were obtained from the database of FIPECAFI. he information on stock price, number of shares, net proit and stockholders’ equity were extracted from the database of Economática. Since the data for wealth created were sup-plied in US dollars, the information on stock price, net proit and stockholders’ equity was also collected in US dollars.
Finally, note that every analysis of the relevance of the VAS is focused on a single proxy: Wealth created per share (WCPS), thus, the results of the investigation are also sub-ject to that limitation.
5 RESULTS: PRESENTATION AND ANALYSIS
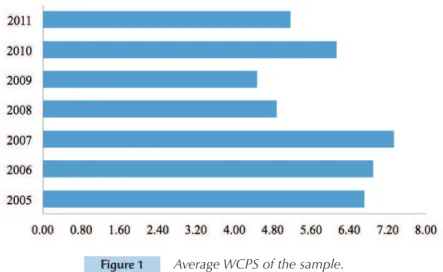
Figure 1 shows the average WCPS of the companies con-tained in the sample. It is seen that the companies generated, on average, wealth of US$5.90 per share, with a minimum of US$4.47 in 2009, and a maximum of US$7.33, in 2007. It is
Table 1 shows the results of the regression, using we-alth created per share (WCPS) as the explanatory
varia-ble and the share price as the dependent variavaria-ble, as per Equation 1.
Figure 1 Average WCPS of the sample.
Panel A
Explanatory variable KABł?EAJP Standard error* T-statistic p-value
C 4.823 0.903 5.339 0.000
WCPS 0.948 0.182 5.205 0.000
Panel B
Description Value Description Value
R2 0.650 F test (statistic) 1318.40
Adjusted R2 0.650
F test (p-value) 0.000
Schwarz 7.660 White test (statistic) 431.91
Akaike 7.647 White test (p-value) 0.000
Jarque-Bera (statistic) 28028.67 Durbin-Watson*** 1.94
Jarque-Bera (p-value)** 0.000 Number of observations 711
* Estimated standard errors with correction for White’s heteroskedasticity, since the null hypothesis of homoskedastic variances was rejected, at the level of 1%. **In accordance with the central limit theorem and considering that 711 observations were used, the supposition of normality can be relaxed (Brooks, 2002). Also, the White correction increases the standard error, reducing the t statistic, making its estimation more robust.
*** The hypothesis of autocorrelation in the residuals is rejected.
Table 1 Results of the regression with WCPS, and without Control variables
According to Table 1, Panel B, the estimated regres-sion, considered in isolation, was statistically signiicant
at the level of 1%, since the p-value obtained for the F sta-tistic is lower than 0.01. A coeicient of determination of 0.650 was obtained, indicating that 65.0% of the variation in the stock price is explained by the variation in weal-th created. In terms of signiicance, Panel A, of Table 1,
through the t statistic, indicates that the variable WCPS was statistically signiicant at the level of 1%, and with the
predicted sign. his shows that WCPS is a variable that is
able to explain the stock price, that is to say, that wealth created is a relevant item of information for the Brazilian capital markets. In the irst instance, these results conirm
the indings of Belkaoui and Picur (1994),
Riahi--Belkaoui and Picur (1999), Scherer (2006) and Crippa and Coelho (2012); but are partially in disagreement with the results obtained by Barros et al. (2013) and divergent
from the study by Martins et al. (2014).
Table 2 shows the results of the regression, using net proit per share (NPPS) and stockholders’ equity per share
(SEPS) as explanatory variable and the stock price as de-pendent variable, as per Equation 2.
According to Table 2, Panel B, the estimated regression, considered in isolation, was statistically signiicant at the
level of 1%, since the p-value obtained for the F statistic is less than 0.01. A coeicient of determination of 0.713 was obtained, showing that 71.3% of the variation in the share price is explained by the variation of NPPS and SEPS. As to signiicance, Panel A, of Table 2, through the t statistic,
indicates that both the variable NPPS and SEPS were statis-tically signiicant at the level of 1%, and had the predicted
sign. hus, there is conirmation of the relevance of
infor-mation on proit and stockholders’ equity for the Brazilian
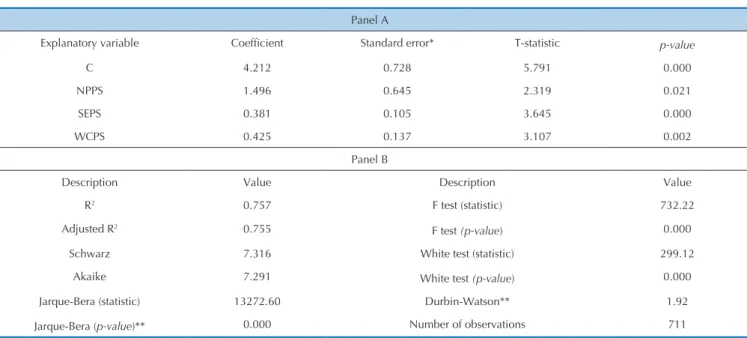
To verify whether the results obtained in Table 1 were consistent, that is to say, whether the VAS has relevant in-formation content, control variables were included, to as-certain whether there was a change in the sign or in the statistical signiicance of the variable WCPS.
It is seen that the inclusion of the control variables NPPS and SEPS (Equation 3) did not change the signiicance, nor
the sign of the variable WCPS (Table 3). Also, an improve-ment in the adjusted coeicient of determination is seen, in relation to the results of Table 2. An information gain is seen, also, from analysis of the adjusted coeicient of determination (Tables 2 and 3), when the WCPS is added in the model with NPPS and SEPS (adjusted R2 0.712), since the model that uses
WCPS (Table 3) presented a larger adjusted R2 (0.755).
Panel A
Explanatory variable KABł?EAJP Standard error* T-statistic p-value
C 4.830 0.754 6.402 0.000
SEPS 0.508 0.122 4.159 0.000
NPPS 2.786 0.737 3.782 0.000
Panel B
Description Value Description Value
R2 0.713 F test (statistic) 879.51
Adjusted R2 0.712 F test (p-value) 0.000
Schwarz 7.471 White test (statistic) 155.83
Akaike 7.452 White test (p-value) 0.000
Jarque-Bera (statistic) 25349.18 Durbin-Watson*** 1.96
Jarque-Bera (p-value)** 0.000 Number of observations 711
* Estimated standard errors with correction for White’s heteroskedasticity, since the null hypothesis of homoskedastic variances was rejected, at the level of 1%. **In accordance with the central limit theorem and considering that 711 observations were used, the supposition of normality can be relaxed (Brooks, 2002). Also, the White correction increases the standard error, reducing the t statistic, making its estimation more robust.
*** The hypothesis of autocorrelation in the residuals is rejected.
To detect the presence of multicolinearity, variance inflation factor (VIF) tests were used. A VIF of 2.573 was obtained, it being concluded that there is a tolerable level of colinearity (Levine, Berenson, & Stephan, 2000).
Table 2 Results of the regression with NPPS and SEPS
Panel A
Explanatory variable KABł?EAJP Standard error* T-statistic p-value
C 4.212 0.728 5.791 0.000
NPPS 1.496 0.645 2.319 0.021
SEPS 0.381 0.105 3.645 0.000
WCPS 0.425 0.137 3.107 0.002
Panel B
Description Value Description Value
R2 0.757 F test (statistic) 732.22
Adjusted R2 0.755
F test (p-value) 0.000
Schwarz 7.316 White test (statistic) 299.12
Akaike 7.291 White test (p-value) 0.000
Jarque-Bera (statistic) 13272.60 Durbin-Watson** 1.92
Jarque-Bera (p-value)** 0.000 Number of observations 711
* Estimated standard errors with correction for White’s heteroskedasticity, since the null hypothesis of homoskedastic variances was rejected, at the level of 1%. **In accordance with the central limit theorem and considering that 711 observations were used, the supposition of normality can be relaxed (Brooks, 2002). Also, the White correction increases the standard error, reducing the t statistic, making its estimation more robust.
*** The hypothesis of autocorrelation in the residuals is rejected.
To detect the presence of multicolinearity, variance inflation factor (VIF) tests were used. VIF values of 2.892, 3.444 and 3.013 were obtained for the variables SEPS, NPPS and WCPS, it being concluded that there is tolerable colinearity (Levine et al., 2000).
he analysis of information gain or loss, with the inclu-sion of WCPS, according to the Wald test, reveals that the model of Equation 3 showed itself to be signiicantly
supe-rior to the model of Equation 2, at the level of 1% (p value of 0.002, for F statistic of 9.654). hus, it can be concluded that the inclusion of the WCPS variable in the model of Equation 2 improves the explanatory power of that model. hus, it can be concluded that the variable WCPS has value relevance.
With this, it is perceived that the results obtained up to this point show that Wealth created – information which comes from the VAS – not only has relevance for the Bra-zilian capital markets, but also adds information content to the information on proit and stockholders’ equity. hat
is to say, it is perceived that there is marginal information content in the VAS for investors. his is a inding that
pre-vious investigators had not observed.
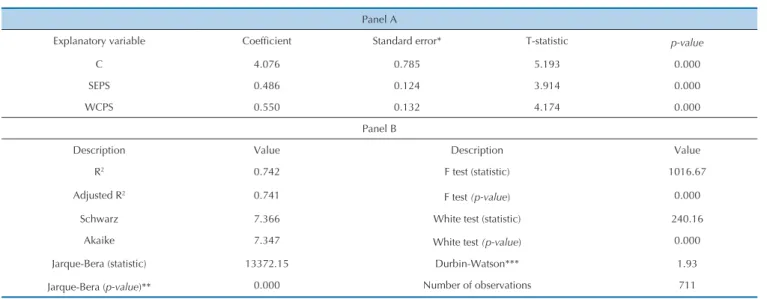
As a secondary objective, this article sought to analyze whether WCPS represents a better proxy for the result of a
company than NPPS. For this, irstly, it was found, using a
Wald test, that the respective variables added information gain, when included in the model with SEPS (restricted model), as per Equations 2, 5 and 6.
5
6
According to the Wald test, both the model of Equa-tion 2 (p value 0.00, for F statistic 14.30), and the model of Equation 6 (p value 0.00, for F statistic of 17.42), sho-wed themselves to be signiicantly superior to the model
of Equation 5, at the level of 1%. hus, it can be concluded that the inclusion both of the variable WCPS, and also of NPPS, in the model of Equation 5, improves the explana-tory power of that model. hus, it can be concluded that the variables WCPS and NPPS have value relevance.
Panel A
Explanatory variable Coefficient Standard error* T-statistic p-value
C 4.076 0.785 5.193 0.000
SEPS 0.486 0.124 3.914 0.000
WCPS 0.550 0.132 4.174 0.000
Panel B
Description Value Description Value
R2 0.742 F test (statistic) 1016.67
Adjusted R2 0.741
F test (p-value) 0.000
Schwarz 7.366 White test (statistic) 240.16
Akaike 7.347 White test (p-value) 0.000
Jarque-Bera (statistic) 13372.15 Durbin-Watson*** 1.93
Jarque-Bera (p-value)** 0.000 Number of observations 711
* Estimated standard errors with correction for White’s heteroskedasticity, since the null hypothesis of homoskedastic variances was rejected, at the level of 1%. **In accordance with the central limit theorem and considering that 711 observations were used, the supposition of normality can be relaxed (Brooks, 2002). Also, the White correction increases the standard error, reducing the t statistic, making its estimation more robust.
*** The hypothesis of autocorrelation in the residuals is rejected.
To detect the presence of multi-colinearity, VIF (variance inflation factor) tests were used. A VIF of 2.251 was obtained, it being concluded that there was a tolerable level of colinearity (Levine et al., 2000).
Table 4 Results of the regression with SEPS and WCPS
The models represented by Equations 3 (Table 3) and 6 (Table 4) were then compared. It is observed that, when including NPPS in the model with SEPS and WCPS (Ta-ble 3), there is practically no alteration in the adjusted coefficient of determination. Further, according to the Wald test, the model represented by Equation 3 did not show itself to be superior to the model of Equation 6 (p
value 0.021, for F statistic 5.38), at the level of 1% of sig-nificance. These results are contrary to those obtained when the models represented by Equations 2 and 3 were compared.
Further, when comparing the adjusted coefficient of determination and the Schwarz information criterion of
Studies of value relevance aim to ind the relevance of
a given item of accounting information to the capital ma-rkets. he objective of these studies is to ind out whether
certain information is relected in the stock price of a com-pany. hus, for the accounting information to have relevant
information content its coeicient in the regression
equa-tion needs to be signiicantly diferent from zero.
Within this context, the aim of this study was to analyze the relevance of the information content of the Value Ad-ded Statement (VAS) in the Brazilian market. For this, the relationship between the price of shares and wealth crea-ted per share (WCPS) was analyzed, for the period from 2005 to 2011, of non-inancial listed companies included
in the Melhores & Maiores annual publication of Exame
Magazine. As a secondary objective, this article has sought to analyze whether WCPS represents a better proxy for a company’s result than NPPS.
he empirical evidence found suggests that the VAS has
relevant information content, because it succeeds in explai-ning the stock price variation of the companies researched. Also, the relationship between WCPS and the stock price was shown to be signiicant, even ater the inclusion of the
control variables.
It is observed that, when including NPPS in the model with SEPS and WCPS, there is practically no alteration in the adjusted coeicient of determination. Further, the
comparison between the models with SEPS and WCPS and with SEPS and NPPS revealed evidence that the ma-rket reacts more to WCPS than to NPPS. hus, the results
obtained reveal indications that WCPS represents a better proxy for the result of the company than NPPS, corro-borating the results of Riahi-Belkaoui and Fekrat (1994), Riahi-Belkaoui and Picur (1994) and Riahi-Belkaoui and Picur (1999).
Possibly, this result is justiied because wealth created is
a wider measure of the performance of the company than net proit, which represents only the portion of the wealth
created that is allocated to the holders of capital. hus, it
is presumed that the market expects from companies not only remuneration of their own capital, but principally, the generation of wealth that can guarantee future viability, and also remunerate all those whose eforts have generated the
wealth. It is supposed, also, that the market may be taking into account the social responsibility of the company, whi-ch is also evidenced in the VAS. he result corroborates the
studies of Scherer (2006) and Crippa and Coelho (2012). However, it is contrary to the indings of Barros et al. (2013)
and Martins et al. (2014).
In general, the results show that the process of changes of accounting standards in Brazil is adding information content to the inancial statements in relation to the capital markets,
that is to say, the requirement for the VAS improves the in-formation quality of the inancial statements. his is in
har-mony with the results of Bartov et al. (2005), Hung and Su-bramanyam (2007), Barth et al. (2008), Chalmers et al. (2008), Morais and Curto (2009), Chalmers et al. (2009), Kadri et al. (2009) and Lima (2011), who also found an improvement in the information content of the inancial statements ater the
process of convergence to international accounting standards. Finally, it is possible to raise the hypothesis that VAS has provided utility to the investor, and to suggest that fur-ther studies about the information content should be made, increasing the number of observations, and also including other control variables and analyzes that diferentiate the
companies studied, especially in relation to the adoption of social-environmental practices, adoption of governance practices, the sector to which the company belongs and the manner of distribution of the value added.
6 CONCLUSION
Amir, E., Harris, T. S., & Venutti, E. K. (1993). A comparison of value relevance of US versus non-US-GAAP accounting measures using Form 20-F reconciliations. Journal of Accounting Research Supplement, 31, 230–264.
Ball, R., & Brown, P. (1968). An empirical evaluation of accounting income numbers. Journal of Accounting Research, 6, 159–177.
Barros, C. M. E., Catapan, A., Scherer, L. M., & Isidoro, C. (2013). Relevância do valor adicionado: um estudo empírico em sociedades anônimas abertas brasileiras. Registro Contábil, 4 (3), 147-162. Barth, M. E., Beaver, W. H., & Landsman, W. R. (2001). he relevance of
value relevance literature for inancial accounting standard setting: another view. Journal of Accounting and Economics, 31, 77-104.
Barth, M. E., Landsman, W. R., & Lang, M. H. (2008). International accounting standards and accounting quality. Journal of Accounting Research, 46 (3), 467-498.
Bartov, E., Goldberg, S. R., & Kim, M. (2005). Comparative value relevance among German, U.S., and international accounting standards: a German stock market perspective. Journal of Accounting, Auditing & Finance, 20, 95-119.
Bastos, D. D., Nakamura, W. T., David, M., & Rotta, U. A. S. (2009). A relação entre o retorno das ações e as métricas de desempenho: evidências empíricas para as companhias abertas no Brasil. REGE, 16 (3), 65-79. Beaver, W. (1968). he information content of annual earnings
Beaver, W., Clarke, R., & Wright, F. (1979). he association between unsystematic security returns and the magnitude of earnings forecast errors. Journal of Accounting Research, 17, 316–340.
Beaver, W., Lambert, R., & Morse, D. (1980). he information content of security prices. Journal of Accounting and Economics, 2, 3–28. Board, J. G. L., & Walker, M. (1990). Intertemporal and cross-sectional
variation in the association between unexpected accounting rates of return and abnormal returns. Journal of Accounting Research, 28 (1), 182-192.
Brooks, C. (2002). Introductory econometrics for inance. Cambridge: Cambridge University Press.
Brown, S., Lo, K., & Lys, T. (1999). Use of R2 in accounting research:
measuring canges in value relevance over the last four decades. Journal of Accounting and Economics, 28, 83-115.
Burchell, S., Clubb, C.; & Hopwood, A. G. (1985). Accounting in its social context: towards a history of value added in the United Kingdom. Accounting, Organizations and Society, 10 (4), 381-413.
Chalmers, K., Clinch, G. J., & Godfrey, J. M. (2008). Adoption of international inancial reporting standards: impact on the value relevance of intangible assets. Australian Accounting Review, 18, 237-247.
Chalmers, K., Clinch, G. J., & Godfrey, J. M. (2009). Changes in value relevance of inancial information upon IFRS adoption. SSRN. Recuperado de www.ssrn.com.
Collins, D., Maydew, E. L., & Weiss, L. (1997). Changes in the value relevance of earnings and book value over the past forty years. Journal of Accounting and Economics, 24, 39-67.
Collins, D., Pincus, M., & Xie, H. (1999). Equity valuation and negative earnings: the role of book value equity. he Accounting Review, 74, 29-61.
Comitê de Pronunciamentos Contábeis (CPC). (2008). Pronunciamento técnico CPC 09: demonstração do valor adicionado. Brasília. Costa, F. M., & Lopes, A. B. (2007). Ajustes aos US-GAAP: estudo
empírico sobre sua relevância para empresas brasileiras com ADRs negociadas em bolsa de Nova Iorque. Revista Contabilidade & Finanças, Edição 30 anos de Doutorado, 45-57.
Crippa, M., & Coelho, A. C. D. (2012, junho). Relevância e conteúdo informacional da demonstração do valor adicionado: evidências para o Brasil. Anais da Associação Nacional De Programas de Pós-Graduação em Ciências Contábeis, Florianópolis, SC, Brasil, 6. De Luca, M. M. M. (1998). Demonstração do valor adicionado: do cálculo
da riqueza criada pela empresa ao valor do PIB. São Paulo: Atlas. Dhaliwal, D., Subramanyam, K. R., & Trezevant, R. (1999). Is
comprehensive income superior to net income as a measure of firm performance? Journal of Accounting and Economics, 26, 43–67. Famá, E. F. (1970). Eicient markets: a review of theory and empirical
work. Journal of Finance, 25 (2), 383-417.
Feltham, G. A., Ohlson, J. A. (1995). Valuation and clean surplus accounting for operating and inancial activities. Contemporary Accounting Research, 11 (2), 689-731.
Foster, G. (1977). Quarterly accounting data: time-series properties and predictive-ability results. he Accounting Review, 52, 1–21. Francis, J., & Schipper, K. (1999). Have inancial statements lost their
relevance? Journal of Accounting Research, 37 (2), 319-352. Fregonesi, M. S. F. A. (2009). Investimentos socioambientais na
demonstração do valor adicionado: formação ou distribuição do valor adicionado? (Tese de Doutorado). Universidade de São Paulo, São Paulo, SP, Brasil.
Galdi, F. C., & Lopes, A. B. (2008). Relação de longo prazo e causalidade entre o lucro contábil e o preço das ações: evidências do mercado latino-americano. RAUSP, 43 (2), 186-201.
Harris, T. S., Lang, M., & Moller, H. P. (1994). he value relevance of German accounting measures: an empirical analysis. Journal of Accounting Research, 32, 187–209.
Heij, C., de Boer, P., Franses, P. H., Kloek, T., & van Dijk, H. K. (2004). Econometric methods with applications in business and economics. Oxford: Oxford University Press.
Hendriksen, E. S., & van Breda, M. F. (1999). Teoria da contabilidade. São Paulo: Atlas.
Holthausen, R. W., & Watts, R. L. (2001). he relevance of value relevance literature for inancial accounting standard setting. Journal of Accounting and Economics, 31, 3-75.
Hung, M. (2001). Accounting standards and value relevance of inancial statements: an international analysis. Journal of Accounting and Economics, 30, 401-420.
Hung, M., & Subramanyam, K. R. (2007). Financial statement efects of
adopting international accounting standards: the case of Germany. Review of Accounting Studies, 12, 623-657.
Iudícibus, S., & Lopes, A. B. (Coords.). (2004). Teoria avançada da contabilidade. São Paulo: Atlas.
Iudícibus, S., Martins, E., Gelbcke, E. R., & Santos, A. (2010). Manual de contabilidade societária. São Paulo: Atlas.
Kadri, M. H., Aziz, R. A., & Ibrahim, M. K. (2009). Value relevance of book value and earnings: evidence from two diferent inancial reporting regimes. Journal of Financial Reporting & Accounting, 7 (1), 1-16.
Kothari, S. P. (2001). Capital markets research in accounting. Journal of Accounting and Economics, 31, 105-231.
Lei n°. 6.404, de 15 de dezembro de 1976. (1976). Dispõe sobre as sociedades por ações. Diário Oicial da União. Brasília. (1976). Lei n°. 11.638, de 28 de dezembro de 2007. (2007). Altera e revoga
dispositivos da Lei no 6.404, de 15 de dezembro de 1976, e da Lei no 6.385, de 7 de dezembro de 1976, e estende às sociedades de grande porte disposições relativas à elaboração e divulgação de demonstrações inanceiras. Diário Oicial da União. Brasília. (2007). Levine, D. M., Berenson, M. L., & Stephan, D. (2000). Estatística: teoria e
aplicações. Rio de Janeiro: LTC.
Lima, J. B. N. (2011). A relevância da informação contábil e o processo de convergência para as normas IFRS no Brasil. (Tese de Doutorado). Universidade de São Paulo, São Paulo, SP, Brasil.
Lopes, A. B. (2001). A relevância da informação contábil para o mercado de capitais: o modelo de Ohlson aplicado à BOVESPA. (Tese de Doutorado). Universidade de São Paulo, São Paulo, SP, Brasil. Lopes, A. B. (2002a). he value relevance of Brazilian accounting numbers:
an empirical investigation. SSRN. Recuperado de www.ssrn.com. Lopes, A. B. (2002b). A informação contábil e o mercado de capitais. São
Paulo: Pioneira homson Learning.
Lopes, A. B.; Martins, E. (2005). Teoria da contabilidade: uma nova abordagem. São Paulo: Atlas.
Lopes, A. B., Sant’Anna, D. P., & Costa, F. M. (2007). A relevância das informações contábeis na BOVESPA a partir do arcabouço teórico de Ohlson: avaliação dos modelos de residual income valuation e abnormal earnings growth. RAUSP, 42 (4), 497-510.
Macedo, M. A. S., Machado, M. A. V., Murcia, F. D., & Machado, M. R. (2011). Análise do impacto da substituição da DOAR pela DFC: um estudo sob a perspectiva do value-relevance. Revista de Contabilidade e Finanças, 22 (57), 299-318.
Machado, M. R. (2010). As informações sociais e ambientais evidenciadas nos relatórios anuais das empresas: a percepção dos usuários. (Tese de Doutorado). Universidade de São Paulo, São Paulo, SP, Brasil. Malacrida, M. J. C. (2009). A relevância do lucro líquido versus luxo
de caixa operacional para o mercado de ações brasileiro. (Tese de Doutorado). Universidade de São Paulo, São Paulo, SP, Brasil. Martins, G. (2002). Manual para elaboração de monograias e dissertações.
(3. ed.). São Paulo: Atlas.
Martins, V. G., Machado, M. A. V. & Callado, A. L. C.(2014). Análise da aditividade de value relevance da DFC e da DVA ao conjunto de demonstrações contábeis: evidências de empresas do mercado de capitais brasileiro. Contabilidade, Gestão e Governança, 17 (1), 74-94. Medida Provisória n° 449, de 3 de dezembro de 2008. (2008). Altera a
legislação tributária federal relativa ao parcelamento ordinário de débitos tributários, concede remissão nos casos em que especiica, institui regime tributário de transição, e dá outras providências. Diário Oicial da União. Brasília. (2008)
Morais, A. I., & Curto, J. D. (2008). Accounting quality and the adoption of IASB standards – portuguese evidence. Revista Contabilidade & Finanças, 19 (48), 103-111.
Morais, A. I., & Curto, J. D. (2009). Mandatory adoption of IASB standards: value relevance and country-speciic factors. Australian Accounting Review, 19 (49), 128-143.
Niskanen, J., Kinnunen, J., & Kasanen, E. (2000). he value relevance of IAS reconciliation components: empirical evidence from Finland. Journal of Accounting and Public Policy, 19, 119-137.
Riahi-Belkaoui, A. (1992). Value added reporting: lessons for the United States. New York: Quorum Books.
Riahi-Belkaoui, A., & Fekrat, M. A. (1994). he magic in value added: merits of derived accounting indicator numbers. Managerial Finance, 20 (9), 3–15.
Riahi-Belkaoui, A., & Picur, R. D. (1994). Net value added as an explanatory variable for returns. Managerial Finance, 20 (9), 56–64. Riahi-Belkaoui, A., & Picur, R. D. (1999). he substitution of net value added
Santos, A. (2007). Demonstração do valor adicionado: como elaborar e analisar a DVA. (2. ed.). São Paulo: Atlas.
Stainbank, L. J. (2009). he value added statement: does it add any value? Meditari Accountancy Research, 17 (2), 137-149.
Sarlo Neto, A. (2004). A reação dos preços das ações à divulgação dos resultados contábeis: evidências empíricas sobre a capacidade informacional da contabilidade no mercado acionário brasileiro. (Dissertação de Mestrado). Fundação Instituto Capixaba de Pesquisas em Contabilidade, Economia e Finanças, Vitória, ES, Brasil.
Scherer, L. M. (2006). Valor adicionado: análise empírica de sua relevância para as companhias abertas que publicam a demonstração do valor adicionado. (Tese de Doutorado). Universidade de São Paulo, São Paulo, SP, Brasil.
Strong, N., & Walker, M. (1993). he explanatory power of earnings for stock returns. he Accounting Review, 68 (2), 385-399.
Van der Meulen, S., Gaeremynck, A., & Willekens, M. (2007). Attribute diferences between U.S. GAAP and IFRS earnings: an exploratory
study. he International Journal of Accounting, 42, 123-142.
Van Staden, C. J. (1998). he usefulness of the value added statement in South Africa. Managerial Finance, 24 (11), 44-59.
Van Staden, C. J. (2000). he value added statement: bastion of social reporting or dinosaur of inancial reporting? SSRN. Recuperado de www.papers.ssrn.com.
Yamamoto, M. M., & Salotti, B. M. (2006). Informação contábil: estudos sobre a sua divulgação no mercado de capitais. São Paulo: Atlas. Zanchet, A., & Martins, G. A. (2011, setembro). Calculabilidade,
contabilidade e performatividade: imbricações na institucionalização da demonstração do valor adicionado. Anais da Associação Nacional de Pós-Graduação e Pesquisa em Administração, Rio de Janeiro, RJ, Brasil, 35.