Pulse Pressure Variation Patterns in a Swine Model of
Hypovolemia under Spontaneous Breathing vs.
Invasive Positive-Pressure Ventilation
Mauricio Maca´rio Rocha, Jose´ Marconi Almeida de Souza, Angelo Amato Vincenzo de Paola, Antoˆnio Carlos Camargo Carvalho, Adriano Henrique Pereira Barbosa, Guilherme Drummond Fenelon Costa
Interventionist Cardiology, Federal University of Sa˜o Paulo, Sa˜o Paulo, SP, Brazil
OBJECTIVE:This study was performed to obtain the title of Master in Medicine, Nov/2012 – Jul/2013. Improvement in cardiac output after fluid administration is known as fluid responsiveness. A reliable parameter for its evaluation is pulse pressure variation: it has established its utility in predicting volume responsiveness in mechanically ventilated patients.
METHOD: Pulse pressure variation was analyzed in 10 anesthetized male pigs at four different stages: I) normovolemia and spontaneous breathing; II) hypovolemia and spontaneous breathing; III) hypovolemia under mechanical ventilation; and IV) after volume replacement, under mechanical ventilation. Cardiac output, pulmonary artery occlusion pressure, systolic pressure variation, mean arterial pressure, and heart rate were measured at all stages; red blood cell count was determined at stages I, II, and IV.
RESULTS:Mean pulse pressure variation values during hypovolemia with spontaneous breathing (stage II) were significantly higher than at any other stage. After institution of mechanical ventilation, pulse pressure variation values returned to baseline without fluid administration. The lowest values were achieved after volume replacement.
CONCLUSION:Pulse pressure variation values are higher during spontaneous breathing than during mechanical ventilation. Thus, it may be useful for assessment of fluid volume under these conditions, with baseline values as a starting point to which serial measurements should be compared after institution of specific therapy.
KEYWORDS: pulse pressure variation; hypovolemia; swine model; spontaneous breathing.
Rocha MM, Souza JMA, Paola AAV, Carvalho ACC, Barbosa AHP, Costa GDF. Pulse Pressure Variation Patterns in a Swine Model of Hypovolemia under Spontaneous Breathing vs. Invasive Positive-Pressure Ventilation. MEDICALEXPRESS. 2014;1(6):359-365.
Received for publication onOctober 28 2014;First review completed onNovember 12 2014;Accepted for publication onNovember 25 2014 Email: dr.macario@hotmail.com
B INTRODUCTION
Shock is a syndrome characterized by the inability of the circulatory system to adequately provide oxygen and nutrients to body tissues to meet their metabolic needs. Regardless of its etiology, early and vigorous fluid replacement (except in cardiogenic shock due to left ventricular involvement) should be instituted to reverse hypotension and, consequently, progression to multiple organ dysfunction.1
Static and dynamic variables parameters have been developed to guide appropriate volume replacement. Dynamic variables include the pulse pressure variation (DPP), the systolic pressure variation (DPS), the dynamic range of the vena cava and the aortic flow variation. Static variables for predicting fluid responsiveness include
central venous pressure (CVP), pulmonary artery occlusion pressure (PAOP), and the left and right ventricular end-diastolic volumes. There is no single optimal variable, and all have major limitations.2 – 22
One variable that has been used in recent years for this purpose is DPP. During the breathing cycle, the peak and minimum pulse pressures (defined as the difference between systolic and diastolic pressure) are calculated and used to derive the DPP, as described below, in methods. A DPP
.13% discriminates patients that will respond to volume replacement with an increase in cardiac output; those with
DPP values #13% will not exhibit such a response. This parameter thus defines two groups of patients: volume expansion responders and nonresponders.2 – 5,23 – 26
For any value of arterial distensibility, pulse pressure amplitude is directly related to the left ventricular stroke volume. Thus, changes in arterial pulse pressure essentially reflect left ventricular stroke volume.24 – 26
DOI:10.5935/MedicalExpress.2014.06.13
The utility ofDPP is limited in patients with spontaneous ventilation and/or cardiac arrhythmias, in whom its accuracy is reduced. The changes in alveolar and intrapleural pressure during spontaneous ventilation are smaller than the changes induced by positive-pressure mechanical ventilation; thus they are insufficient to alter ventricular preload – and, consequently, left ventricular stroke volume – to an extent measurable by DPP. Furthermore, active expiratory movements can change alveolar pressure from one respiratory cycle to another and generate fluctuations in ventricular volumes due to the outflow of blood from the abdomen to the chest during contraction of the diaphragm and abdominal muscles. Cardiac arrhythmias, in turn, can cause fluctuations in ventricular volumes and in cardiac output independently of changes in intrathoracic pressures or blood volume, thus interfering substantially with the accuracy of DPP as a marker of blood volume.2 – 5,23 – 26
In patients undergoing elective procedures with risk of bleeding and without systemic inflammation and/or hemodynamic instability, DPP may be useful as an additional parameter for assessment of fluid volume and, more specifically, of fluid responsiveness. Moreover, little is known about the pattern ofDPP in spontaneous ventilation, and there are no validated DPP cutoff values for use in spontaneously breathing patients. Few studies have assessed
DPP in spontaneous ventilation, and all included patients with systemic inflammation.27 – 37
Within this context, we sought to analyze theDPP in swine models of hypovolemia, both during spontaneous breathing and under positive-pressure mechanical ventilation, in the absence of systemic inflammation.
B MATERIALS AND METHODS Preparation of animals
The sample comprised 10 male pigs. Before the exper-iments, the animals were fasted for 12 hours. Pre-anesthetic medication consisted of intramuscular acepromazine mal-eate 1% (0.1 to 0.25 mg/kg) and midazolam (0.5 mg/kg). After 30 minutes, the animals were placed in the supine position on a V-shaped table, rectal temperature was measured, and continuous ECG monitoring was started to record the heart rate and enable detection of arrhythmias. A left ear vein was cannulated for drug infusion. After orotracheal intubation, the animals were kept on spon-taneous ventilation with supplemental O2 to maintain
oxygen saturations above 95%.
Vascular access
The following vessels were dissected and cannulated for measurement of hemodynamic variables: (i) right femoral artery: pigtail catheter into the aortic arch for central blood pressure monitoring; (ii) right femoral vein: Swan-Ganz catheter for pulmonary artery pressure, pulmonary artery occlusion pressure, and cardiac output monitoring; (iii) left femoral artery: for peripheral blood pressure monitoring; (iv) left femoral vein: for infusion of drugs and fluids.
Measurement and calculation of hemodynamic variables
Cardiac output was measured by the thermodilution technique (Dixtal 2010w); the average of three measurements
was considered for analysis. Central blood pressure,
peripheral blood pressure, pulmonary artery pressure, and pulmonary artery occlusion pressure were recorded on a polygraph (TEB SP 32w) for subsequent interpretation,
analysis, and manual calculation. Systolic and diastolic blood pressures (both central and peripheral) were measured and pulse pressure calculated as the difference between these two pressures. Peak and minimum systolic blood pressure and pulse pressure values were measured over three different respiratory cycles, as described elsewhere;23 – 26 Figure 1 illustrates the procedures. Using these values,DPP (periph-eral pulse pressure variation) and the central pulse pressure variation (cDPP) were calculated according to the formula:23
DPP (%)51003[(peak peripheral pulse pressure2 minimum peripheral pulse pressure)/(peak peripheral pulse pressure1minimum peripheral pulse pressure)/2].
cDPP (%)51003[(peak central pulse pressure2 minimum central pulse pressure)/(peak central pulse pressure1minimum central peripheral pulse press-ure)/2].
The peripheral systolic pressure variation (DPS) and the central systolic pressure variation (cDPS) were determined using the formula:
DPS (%)51003[(peak peripheral systolic pressure2 minimum peripheral systolic pressure)/(peak periph-eral systolic pressure1minimum peripheral systolic pressure)/2].
cDPS (%)51003[(peak central systolic pressure2 minimum central peripheral systolic pressure)/(peak central systolic pressure1minimum central systolic pressure)/2].
Mean arterial pressure (MAP) was calculated as follows: MAP (mmHg)¼[(2£diastolic blood pressure)þsystolic
blood pressure]/3, as shown in Figure 1.
Invasive positive-pressure mechanical ventilation
The animals were ventilated in controlled positive-pressure mode using the following settings (Takaoka CC 500w): tidal volume (VT) 7 mL/kg, positive end-expiratory
pressure (PEEP) 6 mmHg, respiratory rate (RR) 12 bpm, inspiratory-expiratory ratio (I:E)¼1:2, and fraction of
inspired oxygen (FiO2)¼40%.
Induction of hypovolemia and fluid replacement
Hypovolemia was induced by controlled bleeding of 17 mL/kg over a period of 4 minutes. This model was based on a pilot experiment with five animals, which showed that a blood loss of 17 mL/kg is sufficient to reduce blood pressure by 30%. The removed blood was stored in plastic transfusion bags (Fresenius Kabi CompoFlex CPDA-1w) for later
reinfusion.
Protocol
Cardiac output, central and peripheral blood pressure, pulmonary arterial pressure, pulmonary artery occlusion pressure and complete blood counts were obtained from all animals according to the following sequence:
Stage I:
- Normovolemia, mild sedation, and spontaneous ventilation;
Stage II:
- Mild sedation and spontaneous ventilation;
- Induction of hypovolemia (controlled bleeding of 17 mL/kg; average bleeding time of 3 minutes and 54 seconds);
- Ten-minute waiting period for hemodynamic stabilization;
- Measurement of hemodynamic variables and complete blood count.
Stage III:
- Hypovolemia, deep sedation with intravenous thiopental sodium (100 mg loading dose and 5-10 mg/kg/hour maintenance dose) and fentanyl (10 mg/kg/hour), and paralysis (pancuronium
0.2 mg/kg intravenous bolus) to eliminate respiratory activity;
- Institution of mechanical ventilation;
- Ten-minute waiting period for hemodynamic stabilization;
- Measurement of hemodynamic variables. Stage IV:
- Same level of sedation and mechanical ventilation as stage III;
- Replacement of blood volume withdrawn during stage II (average reinfusion time of 10 minutes); - Ten-minute waiting period for hemodynamic stabilization;
- Measurement of hemodynamic variables and complete blood count.
Statistical analysis
Means and standard deviations, ranges, and medians were calculated for all numeric variables. Repeated-measures analysis of variance (ANOVA) was used to compare normally distributed means. The Kolmogorov– Smirnov test, Levene’s test, and Tukey’s and Dunnett’s multiple comparisons procedures were used in this analysis. The significance level was set at P,0.05.
Ethical approval
This study was approved by Ethical Committee of the Universidade Federal de Sa˜o Paulo. Case number 0318/12.
B RESULTS General
The mean body weight of the animals included in this project was 32.8^3.6 kg, and their, mean rectal temperature was 39.5^1.38C. Table 1 summarizes the mean values of the hemodynamic variables of interest at each stage of the experiment.
Pulse pressure variation (DPP)
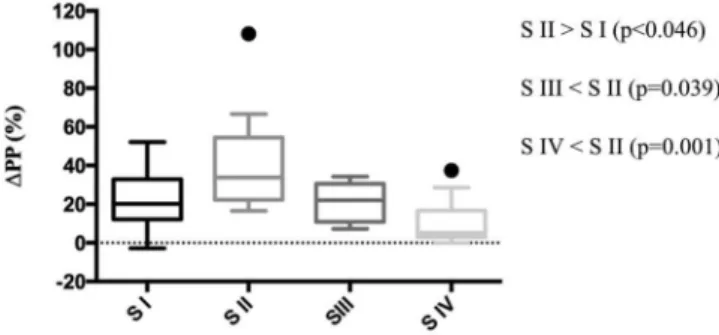
The mean DPP value at the first stage of the experiment was 22.30%^15.27%, increasing significantly to 42.27%
^27.84% (p,0.046) during stage II (hypovolemia plus spontaneous ventilation). During stage III, DPP fell to
21.80%^9.63%, a level similar to that of stage I (p.0.999) and significantly lower compared to stage II (p¼0.039).
The lowestDPP (10.48%^12.55%) was observed in stage IV, with no statistically significant difference compared to stage I (p¼0.372) or III (p¼0.410), but significantly lower than
that observed at stage II (p¼0.001). The medianDPP values
showed similar characteristics (Figure 2).
Cardiac output
The initial mean CO value (L/min) was 5.85^1.65. At stage II, CO fell to 4.11^0.52, a value significantly lower than that observed in stage I (p,0.048). At stage III, this value increased to 5.04^1.19, with no significant difference from stage II (p¼0.248). During the last stage of the
experiment, the mean CO value was 8.93^1.99, signifi-cantly higher from those observed at stages I (p¼0.009), II
(p,0.001), and III (p¼0.001). The median CO values
behaved similarly, as shown in Figure 3.
Pulmonary artery occlusion pressure (PAOP)
The mean PAOP values (mmHg) at each stage of the study were 6.92^2.19, 4.08^2.67, 7.01^2.37, and 9.22^2.15 respectively. There was no statistically significant difference between stages I and II (p¼0.058). At stage III (hypovolemia
plus mechanical ventilation, deep sedation, and paralysis), the mean value increased to 7.01^2.37, which was significantly higher than at stage II (p¼0.049). The
difference between stages II and IV was also significant (p,0.001). Comparison between the mean PAOP values at stages III and IV showed no statistically significant difference (p¼0.192).
B DISCUSSION
The main finding of this study was that mean and median
DPP values were significantly higher in hypovolemic animals during spontaneous ventilation as compared to the under positive-pressure mechanical ventilation values. The higher meanDPP value (42.27%^27.84%) observed in stage II (hypovolemia and spontaneous ventilation) is probably related to the variability of tidal volumes in animals at this stage of the experiment. The institution of positive-pressure mechanical ventilation in stage III led to a
Table 1 -Mean values of hemodynamic variables at each stage of the experiment.
Variable Stage I Stage II Stage III Stage IV P-value
SBP, mmHg* 136.2^26.54 92.1^22.45 106.9^27.84 134.8^15.36 p,0.001
DBP, mmHg* 86.1^20.71 57.53^21.76 62.59^23.16 67.13^13.71 p¼0.017
MAP, mmHg* 102.8^21.91 69.05^21.73 77.12^24.53 89.79^12.68 p,0.003
PAOP, mmHg* 6.92^2.19 4.08^2.67 7.01^2.37 9.22^2.15 p,0.001
CO, L/min* 5.85^1.65 4.11^0.52 5.04^1.19 8.93^1.99 p,0.001
HR, bpm* 126.82^23.15 142.21^32.01 169.29^49.31 171.25^39.87 p¼0.001
Hb, g/dL 10.41^0.93 10.28^0.78 n/a 10.55^0.97 p¼0.577
Hct, % 31.80^3.61 31.40^3.06 n/a 32.2^3.71 p¼0.326
DPP, %* 22.3^15.27 42.27^27.84 21.8^9.63 10.48^12.55 p¼0.002
cDPP, % 35.5^35.27 22.4^21.65 12.73^7.09 8.72^7.7 p¼0.067
SPV, % 12^6.42 16.2^9.66 13.78^3.61 13.9^11.57 p¼0.680
cSPV, % 12.4^6.31 13.28^4.71 10.03^3 10.18^4.36 p¼0.372
decrease in DPP (21.80%^9.63%), but the difference in comparison with the preceding stage did not reach statistical significance. This can be explained by the consistency in tidal volumes induced by mechanical ventilation, leading to less marked changes in ventricular volumes as compared with spontaneous ventilation. However, fluid resuscitation during stage IV caused a further decrease in DPP (10.48^12.55%), which returned to baseline (normovo-lemic) values, similar to those found in stage I (22.3%
^15.27%).
All previous studies that evaluated DPP during spon-taneous ventilation did so in heterogeneous patient groups, and mostly in the setting of systemic inflammation and/or sepsis.
Heenen et al.28analyzed the ability of certain static and dynamic preload parameters to predict fluid responsiveness in 21 patients with various clinical conditions (sepsis, status post cardiac surgery, gastrointestinal bleeding, etc.). Twelve patients were on a face mask and nine were mechanically ventilated on pressure support mode. PAOP, CVP,DPP, and inspiratory CVP variation were measured before and after volume expansion with colloids. Responders were defined as patients who exhibited a$15% increase in cardiac output from baseline. TheDPP value at baseline ranged from 0% to 49%, and the median baseline value was 11%. In mechanically ventilated patients, the area under the ROC curve forDPP was 0.64^0.26, versus 0.29^0.17 in patients breathing through a face mask (p¼0.25). There
were no statistically significant differences in any of the analyzed variables between responders and nonresponders.
Fluid responsiveness was predicted more efficiently by static indices than by dynamic parameters, with areas under the ROC curve of 0.73^0.13 for PAOP versusDPP (p,0.05), 0.69^0.12 for PVC versusDPP (p¼0.054), 0.40^0.13 for
DPP, and 0.53^0.13 for inspiratory changes in PVC (p¼not
significant in relation toDPP). The median value in stage II of our study was 33%, versus 11% in the Heenen et al.28 investigation. This can be attributed to the greater variation in tidal volume in our sample. Both spontaneous ventilation and spontaneous ventilation with pressure support cause oscillations in tidal volume, a phenomenon that is known to interfere with the interpretation of DPP values. In our opinion, the use of pressure support mode and face mask mitigated those oscillations by providing a the tidal volume more constant thus explaining the lowerDPP values found by Heenen et al.28 as compared with our sample. In our experiment, we did not stratify animals as fluid responders and nonresponders, but rather the pattern of DPP in hypovolemic animals during spontaneous breathing fol-lowed by mechanical ventilation and fluid resuscitation. Taking into account the definition of volume responsiveness used by Heenen et al.,28 all animals in our sample were responders. However, several differences in methodology between the two studies preclude any further comparisons. In another study, Dahl et al.31hypothesized that, during spontaneous breathing, the use of inspiratory and/or expiratory resistors could improve the accuracy of DPP and DPs in identifying volume responsiveness. Eight anesthetized and spontaneously breathing pigs were subjected to a sequence of 30% hypovolemia, normovolemia, and 20% and 40% hypervolemia. The mean DPP values observed in spontaneously breathing animals, during 30% hypovolemia without any resistor, with an inspiratory resistor, with an expiratory resistor, and with a combination of inspiratory and expiratory resistors were 17^5%, 25^6%, 25^6%, and 26^7% respectively. Using a combination of inspiratory and expiratory resistors and a cutoff value of 16%, DPP, Dahl et al. study31 was able to predict fluid responsiveness with 100% sensitivity and 81% specificity. These DPP values differ from those found in stage II (hypovolemia and spontaneous ventilation) of our experiment (mean¼42.27%). One explanation for this
discrepancy may be the greater degree of hypovolemia in our experiment. In the Dahl et al. study, there were no differences in heart rate or cardiac output between the hypovolemia and normovolemia stages. This leads us to believe that the degree of hypovolemia in their study was not as severe as that induced in our investigation. Moreover, the higher mean DPP value (42.27^27.84%) observed in our study may have been due to our non-use of any mechanisms that could have made tidal volumes more constant in spontaneously breathing animals, thus leading to greater variability in ventricular volumes and, consequently, DPP values. However, this is precisely what our study sought to evaluate and we should stress that, to the best of our knowledge, this has never been previously described in the literature, namely: the DPP value in a setting where tidal volumes were not fixed by mechanical ventilation, sedation, and paralysis and in the absence of a systemic inflammatory response.
Clinical implications
This experiment can contribute to the assessment of patients undergoing elective invasive procedures, in the absence of
Figure 2 -Box plot ofDPP values at each stage of the experiment.
DPP¼pulse pressure variation; † ¼outlier; S I¼stage I; S II¼stage II; S III¼stage III; S IV¼stage IV.
systemic inflammation, in which blood loss poses a concern. Measurement of baselineDPP levels before the procedure will enable identification of any changes in this parameter in response to hypovolemia and positive-pressure ventilation. By monitoring these values and the variation thereof, clinicians can evaluate the need for volume replacement.
Limitations
Some limitations of this study are worth noting. The animals were studied without induction of systemic inflammatory response or sepsis, and fluid replacement consisted of reinfusion of the same fluid removed rather than administration of crystalloid; the behavior of the parameters of interest might have been different in the presence of these conditions. Furthermore, we did not use a control group. However, our population of animals exhibited similar clinical conditions, which makes for a homogeneous group. Although we did not evaluate fluid responders and nonresponders volume and did not establish a cutoff value for DPP, this study demonstrated the importance of using this variable for the assessment of blood volume in spontaneously breathing patients, alongside other markers of hypovolemia known and employed in routine clinical practice. Measurement of DPP at baseline and over time during an elective procedure should be the optimal manner of monitoring this parameter for diagnosis of hypovolemia and response to therapy, as demonstrated by Rooke et al. with regard to systolic pressure variation34.
B CONCLUSION
We therefore conclude that DPP values are higher in hypovolemic pigs during spontaneous ventilation when compared to those observed under positive-pressure ventilation, and that this parameter may assist in the measurement of blood volume from a baseline with which measurements should be compared serially and after institution of specific therapy in elective procedures performed in the absence of systemic inflammation.
B RESUMO
OBJETIVO:Este estudo foi realizado para obtenca˜o do tı´tulo de Mestre em Medicina, Novembro/2012 – Julho/2013. A melhoria do de´bito cardı´aco apo´s a administraca˜o de fluidos e´ conhecida como a capacidade de resposta do fluido. Um paraˆmetro confia´vel para sua avaliaca˜o e´ a variaca˜o da pressa˜o de pulso, cuja utilidade na previsa˜o da capacidade de resposta voleˆmica em pacientes sob ventilaca˜o mecaˆnica e´ reconhecida.
ME´TODO:A variaca˜o de pressa˜o de pulso foi analisada em 10 suı´nos machos, anestesiados em quatro diferentes esta´gios: I) normovolemia e respiraca˜o espontaˆnea; II) hipovolemia e respiraca˜o espontaˆnea; III) hipovolemia sob ventilaca˜o mecaˆnica; e IV) apo´s a reposica˜o voleˆmica, sob ventilaca˜o mecaˆnica. O de´bito cardı´aco, a pressa˜o de oclusa˜o da arte´ria pulmonar, a variaca˜o da pressa˜o sisto´lica, a pressa˜o arterial me´dia e frequeˆncia cardı´aca foram medidos em todas as fases; a contagem de hema´cias foi determinada nas fases I, II e IV.
RESULTADOS: Os valores de variaca˜o de pressa˜o de pulso durante a hipovolemia com respiraca˜o espontaˆnea (esta´gio II) foram significativamente maiores do que em qualquer outra fase Apo´s a instituica˜o da ventilaca˜o mecaˆnica, os valores de variaca˜o de pressa˜o de pulso voltaram ao valor inicial, sem a administraca˜o de fluidos. Os valores mais baixos foram obtidos apo´s a reposica˜o.
CONCLUSA˜ O:Os valores de variaca˜o da pressa˜o de pulso sa˜o maiores durante a respiraca˜o espontaˆnea do que durante a ventilaca˜o mecaˆnica. Assim, esse paraˆmetro pode ser u´til para a avaliaca˜o do volume de fluido sob estas condico˜es. Os valores da linha de base devem ser tomados como ponto
de partida contra o qual as medico˜es seriadas devem ser comparadas apo´s a instituica˜o da terapeˆutica especı´fica.
B REFERENCES
1. Knobel E, Ju´nior CJF, Silva E, Akamine N. Fisiopatologia do Choque e da Disfunca˜o de Mu´ltiplos Orga˜os. Condutas no Paciente Grave. Editora Atheneu 3ª¯ edica˜o 2006; p. 41-60.
2. Michard F, Teboul JL. Predicting fluid responsiveness in ICU patients: a critical analysis of the evidence. Chest. 2002;121(6):2000-8.
3. Bendjelid K, Romand JA. Fluid responsiveness in mechanically ventilated patients: a review of indices used in intensive care. Intensive Care Med. 2003;29(3):352-60.
4. Cavallaro F, Sandroni C, Antonelli M. Functional hemodynamic monitoring and dynamic indices of fluid responsiveness. Minerva Anestesiol. 2008;74(4):123-35.
5. Marik PE, Cavallazzi R, Vasu T, Hirani A. Dynamic changes in arterial waveform derived variables and fluid responsiveness in mechanically ventilated patients: a systematic review of the literature. Crit Care Med. 2009;37(9):2642-7.
6. Gelman S. Venous Function and Central Venous Pressure: A Physiologic Story. Anesthesiology. 2008;108(4):735-48.
7. Calvin JE, Driedger AA, Sibbald WJ. The hemodynamic effect of rapid fluid infusion in critically ill patients. Surgery. 1981;90(1):61-76. 8. Calvin JE, Driedger AA, Sibbald WJ. Does the pulmonary capillary wedge
pressure predict left ventricular preload in critically ill patients? Crit Care Med. 1981;9(6):437-43.
9. Reuse C, Vincent JL, Pinsky MR. Measurements of right ventricular volumes during fluid challenge. Chest. 1990;98(6):1450-4.
10. Siniscalchi A, Pavesi M, Piraccini E, De Pietri L, Braglia V, Di Benedetto F, et al. Right ventricular end-diastolic volume index as a predictor of preload status in patients with low right ventricular ejection fraction during orthotopic liver transplantation. Transplant Proc. 2005;37(6):2541-3.
11. Diebel L, Wilson RF, Heins J, Larky H, Warsow K, Wilson S. End-diastolic volume versus pulmonary artery wedge pressure in evaluating cardiac preload in trauma patients. J Trauma. 1994;37(6):950-5.
12. Schneider AJ, Teule GJ, Groeneveld AB, Nauta J, Heidendal GA, Thijs LG. Biventricular performance during volume loading in patients with early septic shock, with emphasis on the right ventricle: a combined hemodynamic and radionuclide study. Am Heart J. 1988;116(1 Pt 1):103-12.
13. Squara P, Journois D, Estagnasie´ P, Wysocki M, Brusset A, Dreyfuss D, et al. Elastic energy as an index of right ventricular filling. Chest. 1997;111(2):351-8.
14. Diebel LN, Wilson RF, Tagett MG, Kline RA. End-diastolic volume: a better indicator of preload in the critically ill. Arch Surg. 1992 Jul;127(7):817-821, discussion 821-2.
15. Berkenstadt H, Friedman Z, Preisman S, Keidan I, Livingstone D, Perel A. Pulse pressure and stroke volume variations during severe hemorrhage in ventilated dogs. Br J Anaesth. 2005;94(6):721-6.
16. Marx G, Cope T, McCrossan L, Swaraj S, Cowan C, Mostafa S, et al. Assessing fluid responsiveness by stroke volume variation in mechani-cally ventilated patients with severe sepsis. Eur J Anaesthesiol. 2004;21(2):132-8.
17. Pener A, Faber T. Stroke volume variation does not predict fluid responsiveness in patients with septic shock on pressure support ventilation. Acta Anaesthesiol Scand. 2006;50(9):1068-73.
18. Perel A, Pizov R, Cotev S. Systolic blood pressure variation is a sensitive indicator of hypovolemia in ventilated dogs subjected to graded hemorrhage. Anesthesiology. 1987;67(4):498-502.
19. Coriat P, Vrillon M, Perel A, Baron JF, Le Bret F, Saada M, et al. A comparison of systolic blood pressure variation and echocardiographic estimates of end-diastolic left ventricular size in patients after aortic surgery. Anesth Analg. 1994;78(1):46-53.
20. Tavernier B, Makhotine O, Lebuffe G, Dupont J, Scherpereel P. Systolic pressure variation as a guide to fluid therapy in patients with sepsis-induced hypotension. Anesthesiology. 1998;89(6):1313-21.
21. Monnet X, Rienzo M, Osman D, Anguel N, Richard C, Pinsky MR, et al. Passive leg raising predicts fluid responsiveness in the critically ill. Crit Care Med. 2006;34(5):1402-7.
22. Lafaneche`re A, Pe`ne F, Goulenok C, Delahaye A, Mallet V, Choukroun G, et al. Changes in aortic blood flow induced by passive leg raising predict fluid responsiveness in critically ill patients. Crit Care. 2006;10(5):R132. 23. Michard F, Boussat S, Chemla D, Anguel N, Mercat A, Lecarpentier Y,
et al. Relation between respiratory changes in arterial pulse pressure and fluid responsiveness in septic patients with acute circulatory failure. Am J Respir Crit Care Med. 2000;162(1):134-8.
24. Jardin F. Cyclic Changes in Arterial Pressure During Mechanical Ventilation. Intensive Care Med. 2004;30(6):1047-50.
26. Michard F, Teboul JL. Using heart-lung interactions to assess fluid responsiveness during mechanical ventilation. Crit Care. 2000;4(5):282-9. 27. De Backer D, Pinsky MR. Can one predict fluid responsiveness in spontaneously breathing patients? Intensive Care Med. 2007;33(7):1111-3. 28. Heenen S, De Backer D, Vicent JL. How can the response to volume expansion in patients with spontaneous respiratory movements be predicted? Crit Care. 2006;10(4):R102.
29. Soubrier S, Saulnier F, Hubert H, Delour P, Lenci H, Onimus T, et al. Can dynamic indicators help the prediction of fluid responsiveness in spontaneously breathing critically ill patients? Intensive Care Med. 2007;33(7):1117-24.
30. Pre´au S, Dewavrin F, Soland V, Bortolotti P, Colling D, Chagnon JL, et al. Hemodynamic Changes during a Deep Inspiration Maneuver Predict Fluid Responsiveness in Spontaneously Breathing Patients. Cardiol Res Pract. 2012;2012:191807.
31. Dahl MK, Vistisen ST, Koefoed-Nielsen J, Larsson A. Using an expiratory resistor, arterial pulse pressure variations predict fluid responsiveness during spontaneous breathing: an experimental porcine study. Critical Care. 2009;13(2):R 39.
32. Charron C, Fessenmeyer C, Cosson C, Mazoit JX, Hebert JL, Benhamou D, et al. The influence of tidal volume on the dynamic variables of fluid responsiveness in critically ill patients. Anesth Analg. 2006;102(5):1511-7. 33. De Backer D, Heenen S, Piagnerelli M, Koch M, Vincent JL. Pulse pressure variations to predict fluid responsiveness: influence of tidal volume. Intensive Care Med. 2005;31(4):517-23.
34. Rooke GA, Schwid HA, Shapira Y. The effect of graded hemorrhage and intravascular volume replacement on systolic pressure variation in humans during mechanical and spontaneous ventilation. Anesth Analg. 1995;80(5):925-32.
35. Wiesenack C, Fiegl C, Keyser A, Prasser C, Keyl C. Assessment of fluid responsiveness in mechanically ventilated cardiac surgical patients. Eur J Anaesthesiol. 2005;22(9):658-65.
36. Hoyt JD, Leatherman JW. Interpretation of the pulmonary artery oclusion pressure in mechanically ventilated patients with large respiratory excursion in intrathoracic pressure. Intensive Care Med. 1997;23(11):1125-31.