Soil fauna and its relation with environmental variables in soil
management systems
1Fauna edáfica e sua relação com variáveis ambientais em sistemas de manejo do solo
Dilmar Baretta2*, Marie Luise Carolina Bartz3, Ivandro Fachini2, Rafael Anselmi2, Talyta Zortéa2 e Carolina
Riviera Duarte Maluche Baretta4
ABSTRACT - The present study aims to generate knowledge about the soil fauna, its relation to other explanatory
environmental variables, and, besides it, to select edaphic indicators that more contribute to separate the land use systems (LUS). Five different LUS were chosen: conventional tillage with crop rotation (CTCR); no-tillage with crop rotation (NTCR); conventional tillage with crop succession (CTCS); no-tillage with crop succession (NTCS) and minimum tillage with crop succession (MTCS). The samples were made in the counties Chapecó, Xanxerê and Ouro Verde located in the state of Santa Catarina, Brazil, and were considered the true replicates of the LUS. In each site, nine points were sampled in a sampling grid of 3 x 3. At the same points, soil was sampled for the physical, chemical and biological attributes (environmental variables). Pitfall traps were used to evaluate the soil fauna. Data were analyzed using principal component analysis (PCA) and canonical discriminant analysis (CDA). The soil fauna presented potential to be used as indictors of soil quality, since some groups proved to be sensible to changes of the environmental variables and to soil management and tillage. The soil management using crop rotation (NTCR and CTCR) presented higher diversity, compared to the systems using crop succession (NTCS, MTCS and NTCS), evidencing the importance of the soil tillage, independent of the season (summer or winter). The variable that better contributed to explain these changes were the chemical variables (potassium, pH, calcium, organic matter, available phosphorus, potential acidity), and biological variables (Shannon diversity index, Collembola, Pielou equitability index and microbial biomass carbon), respectively.
Key words: Sustainability. Soil quality indicators. No-tillage. Conventional tillage.
RESUMO - O presente estudo objetivou gerar conhecimento sobre a fauna edáfica e sua relação com outras variáveis ambientais
explicativas, além de selecionar os indicadores edáficos que mais contribuem para separar os sistemas de uso do solo (SUS). Foram escolhidas cinco SUS, sendo: plantio convencional com rotação de culturas (CTCR); plantio direto com rotação de culturas (NTCR), plantio convencional com sucessão de culturas (CTCS), plantio direto com sucesso de culturas (NTCS) e cultivo mínimo com sucessão de culturas (MTCS). As amostragens foram realizadas nos municípios catarinenses de Chapecó, Xanxerê e Ouro Verde e estes foram considerados como repetições verdadeiras dos SUS. Em cada área foram amostrados nove pontos, em uma grade amostral 3x3. No mesmo ponto, foram coletadas amostras para avaliação de alguns atributos físicos, químicos e biológicos do solo (variáveis ambientais). A fauna do solo foi avaliada utilizando armadilhas do tipo “Pitfall traps”. Os dados foram analisados por meio de análises de componentes principais (PCA) e canônica discriminante (ACD). A fauna edáfica apresentou potencial para ser usada na avaliação da qualidade do solo, pois alguns grupos se mostraram sensíveis às alterações nas variáveis ambientais, ao preparo e manejo do solo. Os SUS com rotação de culturas (NTCR e CTCR) apresentaram a maior diversidade edáfica, em comparação aos com sucessão de culturas (CTCS, NTCS e MTCS), evidenciando a importância do cultivo do solo, independente da época de amostragem (inverno e verão). As variáveis que contribuíram mais para explicar essas modificações nos SUS foram os atributos químicos: potássio, pH, cálcio, matéria orgânica, fósforo disponível, acidez potencial e os biológicos: índice de diversidade de Shannon, Collembola, índice de equitabilidade de Pielou e carbono da biomassa microbiana do solo, respectivamente.
Palavras-chave: Sustentabilidade. Indicadores de qualidade do solo. Plantio direto. Plantio convencional.
*Autor para correspondência
1Recebido para publicação em 27/01/2014; aprovado em 13/06/2014
Pesquisa realizada com suporte financeiro da Fundação Agrisus pelo projeto PA 741/10
2Centro de Educação Superior do Oeste, Universidade do Estado de Santa Catarina, Rua Beloni Trombeta Zanin 680E, Santo Antônio, Chapecó-SC,
Brasil, 89.815-630, dilmar.baretta@udesc.br, ivandro.iaf@hotmail.com, rafinha_anselmi@hotmail.com, talizortea@hotmail.com
3Programa de Pós-Graduação em Gestão Ambiental, Universidade Positivo, Curitiba-PR, Brasil, bartzmarie@up.edu.br
4Centro de Educação Superior do Oeste, Universidade do Estado de Santa Catarina, Campus Chapecó e do Curso de Agronomia, Universidade Comunitária
INTRODUCTION
There are many inter-relations between physical, chemical and biological attributes in the soil which control the processes and related aspects to its variation in time
and space (BARETTA et al., 2006; BROOKES, 1995;
LAVELLE et al., 2006; PEREIRA et al., 2013). The
evaluation of these environmental variables in different agricultural systems consists in an important tool to define the better management to be adopted, contributing to a higher quality and sustainability of the system.
The adoption of conservation management systems has emerged as a viable alternative to ensure the sustainability of agricultural land use (BARTZet al., 2013; HUNGRIAet al., 2009; SILVAet al., 2000). In this context, the no-tillage (NT), different of the other types of soil management systems, as the minimum tillage (MT) and conventional tillage (CT), is the best option for the maintenance and improvement of soil attributes.
The NT is a system that has been widely used in the western region of the state of Santa Catarina which principles are the minimal soil disturbance, permanent soil cover, less susceptibility to soil erosion, and crop rotation, therefore providing the basis to accumulation of organic matter, important for physical, chemical and biological balance of the soil (BARETTAet al., 2003; BARTZet al., 2013; FEBRAPDP, 2013).
The different types of tillage and cover can influence the quality of the attributes of soil, because there are differences such as the relation C:N, which influences the speed of the straw degradation, and can also change
the diversity of the soil fauna (BARETTAet al., 2003;
BARTZ et al., 2014). The sort of soil tillage associated
to crop rotation can modify the soil physical, chemical e biological attributes, promoting modifications on the populations of soil organism that lives in soil, through direct and indirect effects on factors related to soil and
plants (ALVESet al., 2006; DUPONTet al., 2010).
The influence of soil management on the biological component usually presents a quicker response than the other edaphic attributes, serving as sensitive indicators of ecological changes in agroecosystems. Thereby, the knowledge of fauna and their ecological relations are important for the evaluation of soil quality and to the understanding of
the dynamics of production systems (LAVELLEet a l.,
2006; LIMA et a l., 2013; PAOLETTI; BRESSAN,
1996; SILVAet al., 2006; SILVAet al., 2013).
In Brazil, the research related to different soil management systems, focused in the study of physical and chemical parameters solely and there are a small number of papers analyzing chemical, physical and
biological soil properties together (PEREIRAet al., 2013). In this way, the present study comes to contribute with information on soil fauna and its relationship with environmental variables, and also aims to select environmental variables that contribute to separate the land use systems in the western region of Santa Catarina.
MATERIAL AND METHODS
The study was carried out in the western region of Santa Catarina (SC) state, Brazil, in Chapecó and in the neighbor counties Xanxerê and Ouro Verde (Table 1). Climate in the region is temperate humid with warm summer (Cfa) (Koeppen classification), with mean temperatures 18-22 °C and annual mean rainfall of 2000 mm. The region show no marked dry season and rainfalls throughout the year. The soil in the five land use system (LUS) was classified as a Rhodic Hapludox (USDA, 1999).
For this study five land use system (LUS) were chosen representing the western region of Santa Catarina (Table 1), with similar soil conditions (soil type) and slope: conventional tillage with crop rotation (CTCR); no-tillage with crop rotation (NTCR); conventional tillage with crop succession (CTCS); no-tillage with crop succession (NTCS) and minimum tillage with crop succession (MTCS). The counties Chapecó, Xanxerê and Ouro Verde were considered true replicates of the LUS and in each site nine points distant 15 m from each other were sampled on a regular grid (3 x 3) leaving 10 meters from the plot boundaries, totalizing approximately half hectare in
area (adaptation of BARTZ et a l., 2014). Due to lack
of knowledge about the variability of soil properties in the site, the extent of each sample plot was small, in order to avoid effects other than those provided by soil tillage and management (Table 2).
For the evaluation of soil fauna and microbiological variables, samplings were done in two seasons: summer (December 2009) and winter (July 2010). Samplings for the physical and chemical analysis were carried out in summer. All these samplings were carried out at the same evaluation points of soil fauna at a depth of 0-20 cm. The results of the chemical attributes of each LUS (mean of the counties) are presented in Table 2.
Table 1 - Georeferenced points (Latitute, Longitute and Altitute) in land use system (LUS) and slope: conventional tillage with
crop rotation (CTCR); no-tillage with crop rotation (NTCR); conventional tillage with crop succession (CTCS); no-tillage with crop succession (NTCS) and minimum tillage with crop succession (MTCS) in the counties Chapecó, Xanxerê and Ouro Verde, state of Santa Catarina, Brazil
County LUS Latitute (S) Longitute (W) Altitute (m)
Chapecó
CTCR 27°11’37” 52°39’34” 660
NTCR 27°11’36” 52°39’33” 661
CTCS 27°11’34” 52°39’32” 668
NTCS 27°11’33” 52°39’31” 670
MTCS 27°11’38” 52°39’48” 654
Xanxerê
CTCR 26°49’45” 52°28’18” 788
NTCR 26°49’42” 52°28’19” 783
CTCS 26°49’41” 52°27’33” 784
NTCS 26°49’43” 52°28’17” 786
MTCS 26°49’48” 52°27’36” 793
Ouro Verde
CTCR 26°43’08” 52°18’06” 750
NTCR 26°43’09” 52°18’18” 757
CTCS 26°43’07” 52°18’09” 768
NTCS 26°43’04” 52°18’05” 776
MTCS 26°43’06” 52°18’07” 759
Table 2 - Summer and winter crops in the sampled land use systems (LUS) in the last six years in conventional tillage with crop
rotation (CTCR); no-tillage with crop rotation (NTCR); conventional tillage with crop succession (CTCS); no-tillage with crop succession (NTCS) and minimum tillage with crop succession (MTCS)
LUS CROPS
Summer Winter
CTCR Corn (Zea mays), bean (Phaseolus vulgaris) and
soybean (Glycine max)
Annual ryegrass (Lolium multiflorum), vetch (Vicia sativa), black oats (Avena stringosa), rye (Secale
cereale), white lupine (Lupinus albus)
NTCR Corn, bean and soybean Annual ryegrass, vetch, black oast, and white lupine.
CTCS Corn and soybean Annual ryegrass, blackoats, vetch.
NTCS Corn and soybean Annual ryegrass, blackoats, vetch.
MTCS Corn and soybean Annual ryegrass, blackoats, vetch.
The soil chemical attributes analyzed were: pH in
CaCl2, P (Mehlich-1), K (potassium), Ca (calcium), Mg
(magnesium), H + Al (potential acidity), OM (organic matter by Walkley-Black Method) and sum of bases, according to the methods described in Tedescoet al. (1995) (Table 3).
For the microbiological attributes, part of the soil of the chemical samples were taken, identified, placed in plastic bags and transported in coolers with ice to the laboratory. The samples were sieved to 2 mm. The determination of the microbial biomass carbon (MBC) was performed with
the fumigation-extraction method (VANCEet al., 1987).
The basal respiration (CO2-C) was estimated using 50 g of
soil (ALEF; NANNIPIERI, 1995), by quantifying the CO2
released of the microbial respiration process in a period ten days of incubation at 28 °C.
Table 3 - Soil chemical attributes of the land use systems (LUS), sampled at 0 – 20 cm depth, in the west region of Santa Catarina
LUS pH CaCl2 P K Ca Mg H+Al MO SB
mg dm-3 cmol
c dm
- 3 g dm- 3 %
CTCR 5.4 13.8 272 7.3 3.7 4.4 40 72.7
NTCR 5.8 21.6 338 8.2 4.2 3.4 38 79.5
CTCS 6.6 19.2 304 9.3 6.1 1.9 47 89.5
MTCS 5.3 8.2 36 4.6 4.1 7.2 34 55.9
NTCS 5.3 8.0 63 4.9 3.1 6.0 39 58.6
SB: sum of bases
detergent solution and taking off after three days in the field
(BARETTAet al., 2003). After removal, the organisms in
the traps were collected, sifted, sorted, counted, identified and preserved in 80% (v/v) ethyl alcohol solution.
The data of organisms abundance in the traps of each LUS were used to calculate Shannon diversity index (H), Simpson dominance index (Is), Pielou equitability index (e) and taxa richness (total number of taxa) (ODUM, 1983). The Shannon diversity index was obtained by the formula H = - pi. log pi, where: pi = ni/N, ni = density of each group, family or species when identified, N = total number of groups (family or species when identified).
Other ecological parameters (Is, e and group richness)
were calculated as described in Barettaet al. (2003).
Statistical analysis
Microbiological attributes (MBC and CO2-C) were
subjected to analysis of variance (ANOVA) and means
were compared by LSD test (P 0.05), using the SAS
software version 9.2 (SAS INSTITUTE, 2008).
The abundance of each taxonomic group of soil fauna in different LUS was used to obtain the length of the gradient (DCA), however, because this length was less than three, it was decided to apply a principal component analysis (PCA) using the program CANOCO version 4.0 (TER BRAAK; SMILAUER, 1998). The chemical (pH, OM, P, K, Ca, Mg, H + Al), physical (resistance to penetration and soil moisture), microbial
soil attributes (MBC and CO2-C) and chlorophyll
content were used later in the PCA, as explanatory environmental variables of the changes of the fauna attributes (TER BRAAK; SMILAUER, 1998).
In addition, all environmental variables (soil physical, chemical and microbiological attributes) and the main soil fauna data were submitted to canonical discriminant analysis (CDA) to identify the most important ones for the separation of LUS (BARETTA
et al., 2006) discussing in acordance to their indicator
value, as recommended by Barettaet al. (2010).
RESULTS AND DISCUSSION
Microbial Biomass Carbon (MBC)
The values of Microbial Biomass Carbon (MBC)
and basal respiration (C-CO2) were influenced (P 0,05)
by soil management system (Figures 1A and 1B) and were discussed apart because of its importance for the evaluation
of soil quality (PEREIRAet al., 2013). As there was no
effect of the seasons, the data were discussed independent
of the season for MBC and CO2-C.
The LUS no-tillage with crop rotation (NTCR) and minimum tillage with crop succession (MTCS) showed higher MBC compared to no-tillage with crop succession (NTCS) and conventional tillage with crop rotation (CTCR), followed by conventional tillage with crop succession (CTCS), where LUS NTCS did not differ significantly from CTCS not (Figure 1A).
In general, management systems with less soil disturbance such as no-tillage (NTCR) and minimum tillage (MTCS), presented better soil conditions and permanence of the cover on the soil surface. These advantages were attributed to the longer time of adoption of these systems, consequently raising the
MBC values (BALOTAet a l., 2004). Thus, the amount
and composition of MBC are influenced by several factors, including the tillage system and the crop rotation. The increased activity of microorganisms observed may be associated with crop rotation in the NTCR, since the diversification of the remaining soil material constitutes a factor for the effectiveness of
the microorganisms activity (FONSECA et al., 2007;
PEREIRAet al., 2013; VENZKE-FILHOet al., 2008).
For soil microbial activity (CO2-C), the LUS
no-tillage and conventional no-tillage with crop rotation (NTCR and CTCR) and the conventional tillage with crops
succession (CTCS) showed the highest values of CO2
Figure 1 - Microbial biomass carbon [MBC (mg C g-1)] (A)
and microbial basal respiration [(CO2-C, mg g-1 dry soil)] (B)
in different land use systems (CTCR: Conventional plantation with crop rotation; NTCR: No-tillage with crop rotation; CTCS: conventional tillage with crop succession; NTCS: no-tillage with crop succession; MTCS: Minimum tillage with crop succession), independent of the season (winter and summer). Means with same low case letter do not differ by LSD test (P < 0.05); Standard deviation)
excessive soil tillage and management. High levels of CO2 -C released, also indicate large number of microorganisms. The opposite is also true, however, these high values of respiration are not always good indicators because that may mean high microbial activity and rapid release of plant nutrients which in a long term, may reflect in losses of the total organic carbon. Thus, the soil microbial activity is used as an additional assessment to MBC (HUNGRIA
et al., 2009; PEREIRAet al., 2013).
Now, for NTCS and MTCS sites, the release of
CO2-C was lower, due to minimal soil disturbance, with
smaller and slower losses of carbon (Figure 1B).
Principal component analysis (PCA) for soil fauna and explanatory environmental variables
The first principal component (PC1) explained 35.5% and the second (PC2) 22.7% totalizing 58.2% of
the data variability. Throughout the PC1 (Axis 1), in the right lower side, the groups Coleoptera, Isopoda and group richness were strongly associated with no-tillage (NTCR) and conventional no-tillage with crop rotation (CTCR), showing a similarity between these management systems. The highest diversity, dominance and equitability indexes [Shannon (H), Simpson (Is)
Pielou (e)], respectively, were also more associated
with NTCR and CTCS sites, being explained by the better soil chemical conditions, especially potassium (K), calcium (Ca) and organic matter (OM), among others such as pH, Mg and soil moisture (Figure 2). NTCR site also presented a higher amount of OM in the surface layers and greater moisture condition of the soil, promoting the formation of a suitable environment for a greater quantity and diversity of edaphic groups, especially Coleoptera, Isopoda and Others. Crop rotation promoted diversification of the plants residue content and quality of this remaining material. This combination of factors contributes to the understanding of a higher occurrence of taxa in this management system, validating results obtained in soils of Santa Catarina by other
authors (ALVES et al., 2006; BARETTAet al., 2003;
BARETTAet al., 2006).
As reported by several authors, the conserved management systems associated to crop rotation contribute to the optimal development of soil fauna, besides the high relationship with soil fertility due
to increased biological activity (ALVES et a l., 2008;
BARETTAet al., 2003; FONSECAet al., 2007; SILVA
et al., 2006; SILVA et al., 2013). In contrast, the no-till with crop succession (NTCS) showed a lower occurrence and diversity of soil organisms and larger amounts of potential acidity (H + Al), higher than the optimal values (Figure 2). Therefore the crop succession should not be recommended when the objective is to benefit and to preserve soil biodiversity, regardless of the type of soil tillage and management.
The high content of H + Al in the crop succession sites (NTCS and MTCS) may be associated with failures in the implementation of the system and/ or even failures in the management. In this case, the lack of crop rotation and the absence of correction of the soil fertility, which may subsequently weaken the balance of the system may have caused losses in productivity and sustainability, particularly in terms of the soil fauna diversity.
Figure 3 - Relation between the first and second canonical
discriminant function (FCD1 and FCD2) on the mean (centroid, in black) of the standardized canonical coefficients (CCP), for the studied environmental variables, discriminating CTCR: conventional plantation with crop rotation; NTCR: no-tillage with crop rotation; CTCS: conventional tillage with crop succession; NTCS: no-tillage with crop succession and MTCS: minimum tillage with crop succession, independent of the season. (n = 5 LUS x 9 sampling points x 3 true replicates x 2 seasons = 270)
Figure 2 - Relation between Principal Component 1 (PC1)
and 2 (CP2) of the Principal Component Analysis (PCA) for the abundance of the soil fauna groups (in ita lics) and physical, chemical and microbiological attributes (red arrows) (RP020: penetration resistance in the 0 - 20 cm; pH: Potential hydrogenionic in water; OM: organic matter; P: phosphorus; K: potassium; Ca: calcium, Mg: magnesium; H + Al: potential acidity and Moisture: soil moisture; CBM: microbial biomass carbon, C-CO2: basal respiration ) in the different LUS (gray arrows) (CTCR: conventional plantation with crop rotation; NTCR: no-tillage with crop rotation; CTCS: conventional tillage with crop succession; NTCS: no-tillage with crop succession; MTCS: minimum no-tillage with crop succession). (n = 5 LUS x 9 sampling points x 3 true replicates x mean of the 2 seasons = 145)
The resistance to penetration in the depth of 0 -20 cm (RP0-20) on the other hand, was more associated with the MTCS due to the use of heavy equipment in the planting process of crops in recent years (Table 2). Furthermore, during the winter, the sites were exposed to an excessive intake of grazing animals (cattle) and stocking up was recommended for the region, which contributed to a higher soil compaction.
Canonical discriminant analysis (CDA)
The CDA was performed because it is more recommended for discriminating LUS and to know which were the environmental variables that contributed
better to separate them (BARETTAet al., 2006).
The statistical test (Wilks’ Lambda) indicated
significant differences ( 0.0001) between the
management systems as the soil fauna attributes and the explanatory environmental variables, presented as the
canonical discriminant function 1 (FCD1) and 2 (FCD2)
(Table 4 and Figure 3). The attributes that present division relation and there who are strongly correlated were removed from the CDA, increasing the reliability of this analysis, and reducing the effect of data colinearity
(BARETTAet al., 2010).
The FCD1 and FCD2 showed 70.4% and 21.4% of
canonical correlations, respectively (Figure 3). These two functions were adjusted to explain the variations found in the values of environmental and soil fauna variables, and to help evidencing that the CDA is more recommended than the PCA, especially when CDA is significant.
Figure 3 shows the canonical standardized
coefficients (CCP) of FCD1 and FCD2 for the five LUS,
considering all environmental and soil fauna variables studied. The CCP explains the multivariate behavior of the different soil attributes analyzed to promote the separation between the LUS, in response to the study of the independent variables simultaneously analyzed
(BARETTAet a l., 2006). Thus, it is possible to observe
that FCD1 separated the LUS CTCS, with higher values
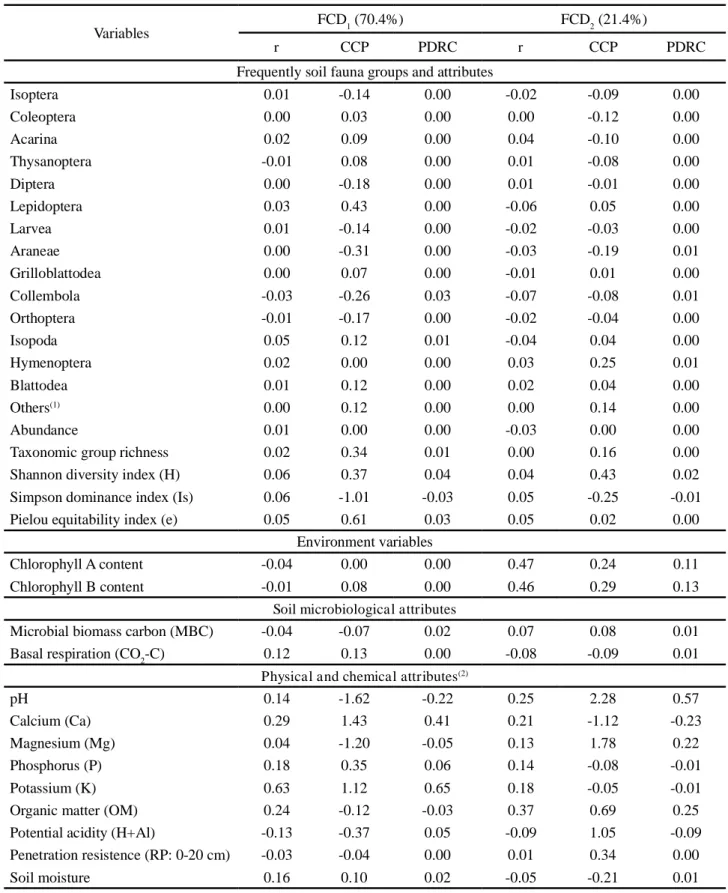
Table 4 - Canonical correlation coefficient (r), standardized canonical coefficient (CCP) and Parallel Discriminating Rate Coefficient (PDRC) as the canonical discriminant functions 1 and 2 (FCD1 and FCD2), regarding the environmental and soil fauna variables, independent of land use system and seasons
Variables FCD1 (70.4%) FCD2 (21.4%)
r CCP PDRC r CCP PDRC
Frequently soil fauna groups and attributes
Isoptera 0.01 -0.14 0.00 -0.02 -0.09 0.00
Coleoptera 0.00 0.03 0.00 0.00 -0.12 0.00
Acarina 0.02 0.09 0.00 0.04 -0.10 0.00
Thysanoptera -0.01 0.08 0.00 0.01 -0.08 0.00
Diptera 0.00 -0.18 0.00 0.01 -0.01 0.00
Lepidoptera 0.03 0.43 0.00 -0.06 0.05 0.00
Larvea 0.01 -0.14 0.00 -0.02 -0.03 0.00
Araneae 0.00 -0.31 0.00 -0.03 -0.19 0.01
Grilloblattodea 0.00 0.07 0.00 -0.01 0.01 0.00
Collembola -0.03 -0.26 0.03 -0.07 -0.08 0.01
Orthoptera -0.01 -0.17 0.00 -0.02 -0.04 0.00
Isopoda 0.05 0.12 0.01 -0.04 0.04 0.00
Hymenoptera 0.02 0.00 0.00 0.03 0.25 0.01
Blattodea 0.01 0.12 0.00 0.02 0.04 0.00
Others(1) 0.00 0.12 0.00 0.00 0.14 0.00
Abundance 0.01 0.00 0.00 -0.03 0.00 0.00
Taxonomic group richness 0.02 0.34 0.01 0.00 0.16 0.00
Shannon diversity index (H) 0.06 0.37 0.04 0.04 0.43 0.02
Simpson dominance index (Is) 0.06 -1.01 -0.03 0.05 -0.25 -0.01
Pielou equitability index (e) 0.05 0.61 0.03 0.05 0.02 0.00
Environment variables
Chlorophyll A content -0.04 0.00 0.00 0.47 0.24 0.11
Chlorophyll B content -0.01 0.08 0.00 0.46 0.29 0.13
Soil microbiological attributes
Microbial biomass carbon (MBC) -0.04 -0.07 0.02 0.07 0.08 0.01
Basal respiration (CO2-C) 0.12 0.13 0.00 -0.08 -0.09 0.01
Physical and chemical attributes(2)
pH 0.14 -1.62 -0.22 0.25 2.28 0.57
Calcium (Ca) 0.29 1.43 0.41 0.21 -1.12 -0.23
Magnesium (Mg) 0.04 -1.20 -0.05 0.13 1.78 0.22
Phosphorus (P) 0.18 0.35 0.06 0.14 -0.08 -0.01
Potassium (K) 0.63 1.12 0.65 0.18 -0.05 -0.01
Organic matter (OM) 0.24 -0.12 -0.03 0.37 0.69 0.25
Potential acidity (H+Al) -0.13 -0.37 0.05 -0.09 1.05 -0.09
Penetration resistence (RP: 0-20 cm) -0.03 -0.04 0.00 0.01 0.34 0.00
Soil moisture 0.16 0.10 0.02 -0.05 -0.21 0.01
for conservation of soil biodiversity, independent of sampling time (winter and summer);
3. The “best” indicators to separate the land use systems are: potassium, pH, calcium, organic matter, phosphorus, potential acidity, Shannon diversity index, Collembola, Pielou equitability index, microbial biomass carbon, respectively;
4. New studies are suggested involving the evaluation of the soil macrofauna using other sampling methods, such as soil monoliths, since the traps assess only the activity of the soil fauna living on the surface of the soil, limiting the sampling of other groups of organisms, such as earthworms.
ACKNOWLEDGMENT
The authors thank Agrisus Foundation for financial support and Dr. Ondino Battaglia for the suggestions in the project. As well, thank the CETREC/ EPAGRI for allowing the use of the experimental sites and help and the farmers who allowed the study in their farms in the counties Chapecó, Xanxerê and Ouro Verde. The authors thank the Department of Animal Science, the official Gilberto François and UDESC/ CEO for the support. We acknowledge Dra. Cintia Carla Niva (Universidade Positivo/UP, Curitiba-PR) and anonymous referees for their critical and helpful comments.
REFERENCES
ALEF, K.; NANNIPIERI, P. (Ed.) Methods in applied soil
microbiology and biochemistry. London: Academic Press,
1995. 576 p.
ALVES, M. V.; BARETTA, D.; CARDOSO, E. J. B. N. Fauna edáfica em diferentes sistemas de cultivo no estado de São Paulo. Revista de Ciências Agroveterinárias, v. 5, n. 1, p. 33-43, 2006.
ALVES, V. et a l. Macrofauna do solo influenciada pelo uso de fertilizantes químicos e dejetos de suínos no Oeste do Estado de Santa Catarina. Revista Brasileira de Ciência do
Solo, v. 32, n. 2, p. 589-598, 2008.
BALOTA, E. L. et a l. Long-term tillage and crop rotation effects on microbial biomass and C and N mineralization in a Brazilian Oxisol. Soil & Tillage Research, v. 77, n. 2, p. 137-145, 2004.
BARETTA, D.; BROWN, G.G.; CARDOSO, E.J.B.N. Potencial da macrofauna e outras variáveis edáficas como indicadores da qualidade do solo em áreas com Ara uca r ia a ngustifolia .Acta Zoológica Mexicana (nueva serie), v. 26,
n. 2, p. 135-150, 2010.
In general, it was possible to observe that the FCD1 separated crop rotation sites, NTCR and CTCR, with higher values of the canonical standardized coefficients (CCP) compared to the other sites with crop succession CTCS, MTCS and NTCS, respectively (Figure 3).
Parallel Discriminating Rate Coefficient (PDRC)
The PDRC value shown in Table 4 is the result of
the product of the CCP and the correlation (r). Ther shows univariate information (individual contribution) of each edaphic attribute studied, independent of the others. Therefore, the best parameter for evaluating the effect of separation generated by the attributes within the soil management systems is thePDRC (BARETTAet al., 2006).
The use of PDRC gives an indicator value for
the studied attributes. From these results of PDRC of
the CDA analysis Baretta et a l. (2010) proposed the
separation of the soil quality indicators in six classes based on the indicator value obtained. This separation is useful in the choice of soil attributes that are most sensitive to promote differences among management systems (Table 4).
And finally, it is possible to note that within the
FCD1, the group Collembola (0.03), Shannon diversity
index (0.04), Pielou equitability index (0.03), soil moisture (0.02), microbial biomass carbon (0.02), calcium (0.41), phosphorus (0.06), potassium (0.65) and potential acidity (0.05) exhibited the highest positive values of PDRC coefficient, indicating that the major effect of separation of the LUS is explained by these variables (Table 3). In
FCD2, the environmental variables with the highest PDRC
were: the Shannon diversity index (0.02), the chlorophyll A content (0.11) and B (0.13), pH (0.57), magnesium (0.22) and organic matter (0.25). According Barettaet al. (2010), the indicator value is: 0.03 (low), 0.04 to 0.09 (medium), 0.10 to 0.20 (good), 0.21 to 0.41 (very good), from 0.42 to 0.80 (optimum) and > 0.81 (excellent).
CONCLUSIONS
1. The soil fauna has the potential to be used in the evaluation of soil quality because some groups were sensitive to changes in environmental variables, to the soil tillage and management, therefore it may help in the monitoring of an ecological management with higher biodiversity;
BARETTA, D. et a l. Análise multivariada da fauna edáfica em diferentes sistemas de preparo e cultivo do solo. Pesquisa
Agropecuária Brasileira,v. 41, n. 11, p. 1675-1679, 2006. BARETTA, D.et a l. Fauna edáfica avaliada por armadilhas de catação manual afetada pelo manejo do solo na região oeste catarinense. Revista de Ciência Agroveterinárias,v. 2, p. 97-106, 2003.
BARTZ, M. L. C.; PASINI, A.; BROWN, G. G. Earthworms as soil quality indicators in Brazilian No-tillage systems. Applied
Soil Ecology, v. 69, n. 7, 39-48, 2013.
BARTZ, M. L. C. et al. Earthworm richness in land-use systems in Santa Catarina, Brazil. Applied Soil Ecology, 2014. http://dx.doi.org/10.1016/j.apsoil.2014.03.003. BROOKES, P.C. The use of microbial parameters in monitoring soil pollution by heavy metals. Biology Fertily
of Soils, v.19, n. 4, p.269-279, 1995.
DUPONT, T. et a l. No-tillage conversion of harvested perennial grassland to annual cropland reduces root biomass, decreases active carbon stocks, and impacts soil biota.
Agriculture, Ecosystems & Environment, v. 137, n. 1-2,
p. 25-32, 2010.
FEBRAPDP (Federação Brasileira de Plantio Direto e Irrigação). Metodologia de Qualificação do Plantio Direto, 2013. Available in: [http://plantio.
h i d r o i n f o r m a t i c a . o r g / i m a g e s / p d f / M e t o d o l o g i a _ d e _ Qualifica%C3%A7%C3%A3o_do_Plantio_Direto.pdf ]. Last access: 24/09/2013.
FONSECA, G. C. et al. Atributos físicos, químicos e biológicos de Latossolo de Cerrado sob duas rotações de cultura. Pesquisa Agropecuária Tropical, v. 37, n. 1, p. 22-30, 2007.
HUNGRIA, M. et a l. Soil microbial activity and crop sustainability in a long-term experiment with three soil-tillage and two crop-rotation systems. Applied Soil Ecology, v. 42, n. 3, p. 288-296, 2009.
LAVELLE, P.et al. Soil invertebrates and ecosystem services.
European Journal on Soil Biology, v. 42, Supplement 1, p.
S3-S15, 2006.
LIMA, A. C. R.et al. A functional evaluation of three indicator sets for assessing soil quality. Applied Soil Ecology, v. 64, n. 2, p. 194-200, 2013.
ODUM, E. P. Ecologia. Rio de Janeiro: Guanabara. 1983. 434 p. PAOLETTI, M. G.; BRESSAN, M. Soil invertebrates as biodicators of human disturbance. Critical Reviews in Plant Sciences,v. 15, n. 1, p. 21-62, 1996.
PEREIRA, J. DE. M.et a l. Relationships between microbial activity and soil physical and chemical properties in native and reforestedAr a uca r ia a ngustifolia forests in the state of São Paulo, Brazil. Revista Brasileira de Ciência do Solo, v. 37, n. 3, p. 572-586, 2013.
SAS INSTITUTE. SAS/STAT: Qualification Tools user’s guide, version 9.2 Cary, 2008.
SILVA, V. R.; REINERT, D. J.; REICHERT. J. M. Densidade do solo, atributos químicos e sistema radicular do milho afetados pelo pastejo e manejo do solo. Revista Brasileira de Ciência do
Solo, 24: n.1, 191-199, 2000.
SILVA, R. F.; AQUINO, A. M.; MERCANTE, F. M.; GUIMARÃES; M. F. Macrofauna invertebrada do solo sob diferentes sistemas de produção em latossolo da região do Cerrado.Pesquisa Agropecuária Brasileira, v. 41, n. 4, p. 697-704, 2006.
SILVA, R. F. et a l. Fauna edáfica influenciada pelo uso de culturas e consórcios de cobertura do solo. Pesquisa
Agropecuária Tropical, v. 43, n. 2, 2013.
TEDESCO, M. J. et al. Análises de solo, plantas e outros
materiais. Porto Alegre, Universidade Federal do Rio Grande
do Sul, 1995. 174 p, (Boletim Técnico 5).
TER BRAAK, C. J. F.; SMILAUER, P. CANOCO reference
manual and user’s guide to Canoco for Windows: software for canonical community ordination (version 4). New York:
Microcomputer Power, 1998.
USDA - Soil Survey Staff. Soil Taxononmy - a basic
system of soil classification for making and interpreting soil survey. 2 ed., Washington: USDA. 1999. 871 p.
VANCE, E. D.; BROOKS, P. C.; JENKINSON, D. S. An extraction method for measuring soil microbial biomass C. Soil
Biology and Biochemystry, v. 19, n. 6, p. 703-707, 1987.
VENZKE-FILHO, S. P. V.; FEIGL, B. J.; PICCOLO, M. C. Biomassa microbiana do solo em sistemas de plantio direto na região de Campos Gerais - Tibagi, PR. Revista Brasileira


![Figure 1 - Microbial biomass carbon [MBC (mg C g -1 )] (A) and microbial basal respiration [(CO 2 -C, mg g -1 dry soil)] (B) in different land use systems (CTCR: Conventional plantation with crop rotation; NTCR: No-tillage with crop rotation; CTCS](https://thumb-eu.123doks.com/thumbv2/123dok_br/15317928.552673/5.892.86.430.541.964/microbial-microbial-respiration-different-conventional-plantation-rotation-rotation.webp)