ISSN 2179-8087 (online)
Original Article
Soil Fauna Communities and Soil Attributes in the
Agroforests of Paraty
Miguel Seabra Corrêa da Silva
1, Maria Elizabeth Fernandes Correia
2,
Eliane Maria Ribeiro da Silva
2, John Edmund Lewis Maddock
3,
Marcos Gervasio Pereira
4, Cristiane Figueira da Silva
41Instituto de Desenvolvimento e Ação Comunitária – IDACO, Rio de Janeiro/RJ, Brasil 2Empresa Brasileira de Pesquisa Agropecuária – Embrapa Agrobiologia, Seropédica/RJ, Brasil
3Departamento de Geoquímica, Universidade Federal Fluminense – UFF, Niterói/RJ, Brasil 4Departamento de Solos, Universidade Federal Rural do Rio de Janeiro – UFRRJ, Seropédica/RJ, Brasil
ABSTRACT
We conducted the present study in Paraty, southeastern Brazil, in areas under different management regimes and plant cover. The study comprised two different agroforestry systems (AFS-1 and AFS-2), a secondary forest, and a cassava monoculture. We aimed at assessing the effects of land use on the soil fauna and its relationship with soil chemical (pH, Al, Ca, Mg, P, K, carbon, and organic matter) and microbiological attributes (soil microbial biomass carbon - SMB-C, soil respiration – SR, metabolic quotient - qCO2, microbial biomass carbon - C-mic). During winter, AFS-2 showed higher abundance of microphagous, saprophagous, and total individuals than the other areas. AFS-1 and the forest showed an increased abundance of Formicidae and phytophagous groups from winter to summer. The soil fauna and community structure showed that the studied agroforests are under regeneration, becoming more similar to the native forest, where ecological processes are considered efficient.
Keywords: soil organisms, organic matter, nutrient cycling.
Comunidades da Fauna do Solo e Atributos Edáficos sob
Agroflorestas em Paraty, RJ
RESUMO
Este estudo foi conduzido no município de Paraty, RJ, em áreas com diferentes manejos e plantas de cobertura, sendo: dois diferentes sistemas agroflorestais (AFS-1 e AFS-2), uma área de floresta secundária e uma área com monocultivo de mandioca. O objetivo foi avaliar os efeitos de diferentes usos da terra na fauna do solo e sua relação com os atributos químicos (pH, Al, Ca, Mg, P, K, carbono e matéria orgânica) e microbiológicos (carbono da biomassa microbiana – C-BMS; respiração do solo – RS; quociente metabólico – qCO2; quociente microbiano – Cmic) do solo. No inverno, o AFS-2 apresentou maior abundância de indivíduos micrófagos, saprófagos e totais, em relação a outras áreas. Do inverno para o verão, o AFS-1 e a área de floresta mostraram um aumento na abundância de formicidae e grupos fitófagos. A avaliação da fauna edáfica e a estrutura da comunidade mostraram que os AFSs estão sob processo de regeneração, aumentando a semelhança com florestas nativas, nas quais os processos ecológicos são considerados eficientes.
1. INTRODUCTION
Agroforestry systems are known as an intercropping practice involving tree species, which improves soil physical and chemical properties by decreased erosion and increased organic matter content in the topsoil (Mendonça et al., 2001). This practice is meant for the recovery of degraded areas and to preserve the surrounding of protected areas. Particularly in the Atlantic forest, agroforestry systems have already been recognized as an alternative to buffer zones around reserves (Cullen et al., 2001).
Agroforestry systems improve soil fertility and the microclimate. They also create more habitats, and so provide greater diversity of food sources than conventional monocultures (Tscharntke al., 2011). This increase in soil quality results from a different input of organic material from tree and crop species. A better soil quality stimulates the reestablishment of soil invertebrate community, which results in decomposition, nutrient cycling, and soil physical structure more similar to forests (Lima et al., 2010; Silva et al., 2012a; Tarrá et al., 2012).
The soil fauna is composed of invertebrates at different proportion and with different functions. These invertebrates interact with each other and with the microbial community, thus regulating decomposition (Lavelle et al., 2006; Resende et al., 2013). The soil fauna acts mainly in the fragmentation of plant debris, which makes them available to microorganisms. Microorganisms have a more suitable enzyme complement to break the litter fall, and, therefore, play an active role in decomposition (Wardle & Lavelle, 1997; Correia & Oliveira, 2000; Resende et al., 2013). According to Correia & Oliveira (2000), the effects of these microorganisms on the microbiota can be either stimulatory or inhibitory (Theenhaus & Scheu, 1996) and are reflected in the soil microbiological attributes (soil microbial biomass carbon - SMB-C, soil respiration – SR, metabolic quotient - qCO2, etc.).
Soil invertebrates are sensitive to changes in plant cover (Barros et al., 2003), management regime (Aquino et al., 2008; Silva et al., 2012a), and microclimate (Vasconcelos et al., 2009). In the conversion of natural ecosystems into productive systems, the structure of the soil fauna is less altered when the structure of the plant cover is kept similar, i.e., when fields are grown
in pastures, and silvopastoral and agrosilvicultural systems are grown in areas originally covered with forests (Lima et al., 2010).
Lima et al. (2010) observed that the implementation of agroforestry systems in the Cerrado (Brazilian savanna) increases the richness and density of the edaphic macrofauna compared to native forests (Lima et al., 2010). However, Silva et al. (2012a) did not observe significant differences in those variables between agroforestry systems and the native forest of Zona da Mata in the state of Minas Gerais, southeastern Brazil. According to some authors (Moço et al., 2009; Lima et al., 2010; Silva et al., 2013), plant diversity in agroforestry and forestry systems improves the diversity of microhabitats, which contributes to higher biodiversity.
Thus, agroforestry systems are models for good soil management, which most resemble a natural forest. Therefore, they are considered an alternative for a sustainable ecosystems use. The present study aimed to assess the effect of two agroforestry management regimes on soil fauna abundance and diversity, as well as their relationship with soil chemical and microbiological attributes.
2. MATERIAL AND METHODS
We carried out the present study in Campinho da Independência, a maroon community (locally known as quilombo) located in Paraty-Mirim, Paraty, state of Rio de Janeiro, southeastern Brazil (44º42’W, 23°17’S, 60 m a.s.l.). The community is located at the center of Cairuçu, a protected area, by the Paraty-Mirim River and the BR101 Highway. The area still has native vegetation: submontane tropical rainforest (Brasil, 1983).
The studied area has a clay soil covered with secondary forests (SF), cassava monocultures, and two different agroforestry systems (AFS-1 and AFS-2). The distance between AFS-1 and AFS-2 and the cassava monoculture is approximately 3 m, and the distance thereof to the SF is approximately 15 m. The SF has approximately 1 ha, and most of its species occur at low density. According to Tavares (2014), it could still be at an early stage of succession, despite being located in a landscape characterized by large forest fragments.
plantain, and cassava), based on intercropping, crop rotation, and fallow. The monoculture had approximately 600 m2 of cultivated area near a forest without tillage
or fertilization, similar to the AFSs.
Agroforestry systems were established in 2003 based on the Agroforestry Systems Regenerative and Analogues (ASRA; Piña-Rodrigues , 2006) model. Each experimental unit consisted of a 20 x 20 m plot, corresponding to treatments of mixed legume (AFS-1) and non-legume species (AFS-2). The main culture of economic interest in both AFSs was peach palm (Bactris gasipaes Kunth.). They also had short-cycle
fruit species such as banana (Musa sp.) and papaya
(Carica papaya L.), subsistence food species such as black beans (Phaseolus vulgaris L.), corn (Zea mays L.), and cassava (Manihot esculenta L.), and green manure species such as jack bean (Canavalia ensiformis (L.) DC.), pigeon pea (Cajanus cajans (L.) Millsp.), and sunnhemp (Crotalaria juncea L.).
AFS-1 and AFS-2 differed in the composition of long-cycle fruit species. Abiu (Pouteria caimito Radlk.)
and jackfruit (Artocarpus heterophyllus Lam) were
cultivated in AFS-1 and graviola (Anona muricata
L.) and starfruit (Averrhoa carambola L.) in AFS-2. They also differed in the composition of fertility renewing species, as Inga sp and Lonchocarpus guilleminianus
(Tul.) Malme) were present in AFS-1, and Bixa orelana
L. and Cytharexyllum myrianthum Cham in AFS-2.
The composition of climax species and species with
potential use of seeds, oils, and hardwood also differed
between AFSs. Schizolobium parahyba (Vell.) Blake,
Centrolobium tomentosum Guill. ex Benth., Hymenaea courbaril L., and Copaifera langsdorffii Desf. were present in AFS-1, whereas, Cedrela fissilis Vell. (Nectrandra lanceolata Nees et Mart. ex Ness., Cariniana legalis
(Mart.) Kuntze and Virola bicuhyba (Schott) Warb
were present in AFS-2.
The spacing between rows was 2 m, alternating planting pupunha (Bactris gasipaes Kunth) with another arborous species, or arborous species intercropped with fruit species. Spacing within the row was 1 m for the pupunha and 1.5 m for arborous and fruiting species. A total of 1561 seedlings were planted, including 462 seedlings of pupunha per treatment. Agricultural and green manure species were planted in the interrows of arborous species.
We collected soil samples 18 (winter) and 24 (summer) months after the AFS implementation. In AFSs and cassava areas, we used the total area for soil collection, whereas, in the SF area, we used a plot of 400 m2. We collected five soil samples at 0-10 cm
depth to measure chemical (EMBRAPA, 1997) and microbiological attributes (Soil microbial biomass carbon – SMB-C (Vance et al., 1987; Bartlett & Ross 1988); soil basal respiration – SR (Jenkinson & Powlson, 1976); and microbial biomass carbon – C-mic and metabolic quotient- qCO2 (Anderson & Domsch, 1985, 1990) (Table 1). We also collected five random samples
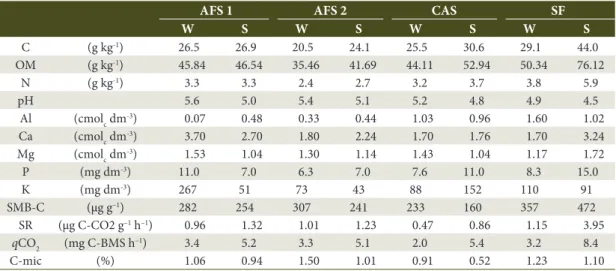
Table 1. Chemical and microbiological characterization* of the soil layer at 0-10 cm under agroforestry systems
(AFS-1 and AFS-2), cassava monoculture (CAS), and secondary forest (SF) during the winter (W) and summer (S). Se= season; C: total organic carbon; OM: organic matter.
AFS 1 AFS 2 CAS SF
W S W S W S W S
C (g kg-1) 26.5 26.9 20.5 24.1 25.5 30.6 29.1 44.0
OM (g kg-1) 45.84 46.54 35.46 41.69 44.11 52.94 50.34 76.12
N (g kg-1) 3.3 3.3 2.4 2.7 3.2 3.7 3.8 5.9
pH 5.6 5.0 5.4 5.1 5.2 4.8 4.9 4.5
Al (cmolc dm-3) 0.07 0.48 0.33 0.44 1.03 0.96 1.60 1.02
Ca (cmolc dm-3) 3.70 2.70 1.80 2.24 1.70 1.76 1.70 3.24
Mg (cmolc dm-3) 1.53 1.04 1.30 1.14 1.43 1.04 1.17 1.72
P (mg dm-3) 11.0 7.0 6.3 7.0 7.6 11.0 8.3 15.0
K (mg dm-3) 267 51 73 43 88 152 110 91
SMB-C (μg g–1) 282 254 307 241 233 160 357 472
SR (μg C-CO2 g–1 h–1) 0.96 1.32 1.01 1.23 0.47 0.86 1.15 3.95
qCO2 (mg C-BMS h–1) 3.4 5.2 3.3 5.1 2.0 5.4 3.2 8.4
C-mic (%) 1.06 0.94 1.50 1.01 0.91 0.52 1.23 1.10
per area per season to assess soil fauna using a 25-cm wide square-shaped metal template. We divided each sample into litter fall and soil (0-5 cm of depth). For the extraction of soil fauna, we used a Berlese-Tullgren extraction funnel for 15 days. After that period, we collected organisms for counting and identification of taxonomic groups using binocular lens.
We estimated the abundance of edaphic fauna by transforming the number of individuals found in each sample into the number of individuals per square meter (individuals.m-2). We made a qualitative analysis of the
soil fauna community by classifying taxonomic groups into nine functional groups according to habitat use and food resources (Seastedt, 1984): microphagous (Acari and Collembola), Formicidae (ants), saprophagous (Blattodea, Diplopoda, Diplura, Enchytraeidae, Gastropoda, Isopoda, Orthoptera, Pauropoda, Psocoptera, Symphyla, and Thysanoptera), phytophagous (Heteroptera and Homoptera), holometabolous (Coleoptera, Diptera, Lepidoptera, and Trichoptera), larvae (Coleoptera, Diptera, Lepidoptera, and Trichoptera), predators (Araneae and Chilopoda), parasitoids (Hymenoptera), and termites (Isoptera).
To describe the structure of the soil fauna community in each area we calculated the Shannon diversity index (H’) (Shannon & Weaver, 1964) and the Pielou evenness index (J) (Pielou, 1975). H’ considers the species (S) richness and their relative abundance (pi), defined by H’ =-Σ pi ln pi. J considers differences in abundance distribution among species, defined as J = H’/ ln S.
The agroforestry systems sampled in the present study were implemented as demonstration units at Quilombo do Campinho and in other communities of Paraty. Therefore, there was no experimental design with randomly distributed blocks, which impairs the analysis of variance and the comparison of means using the Bonferroni t test mandatory (Bailey, 1977). We used the software CANOCO to make a principal component analysis (PCA) of the edaphic fauna and soil chemical (pH, Al, Ca, Mg, K, P, N, C, organic matter) and microbiological variables (soil microbial biomass carbon – SMB-C, soil respiration - SR, metabolic quotient - qCO2 and microbial biomass carbon – C-mic) (Table 1). We calculated the statistical significance of correlations between soil microbiological and chemical variables and fauna variables using a Monte Carlo permutation test (Ter Braak, 1995).
3. RESULTS AND DISCUSSION
We collected a total of 8,206 individuals, 41% during the winter and 59% during the summer. During the winter, AFS-2 had the highest abundance of individuals (4320 ind.m-2), followed by the secondary
forest (3094 ind.m-2), AFS-1 (1878 ind.m-2), and the
cassava monoculture (1450 ind.m-2). AFS-2 also had
the highest abundance of individuals in the litter fall (2864 ind.m-2) (Figure 1a), which represented 33% of the
total abundance, followed by the forest, with 30%, and the AFS-1, with 10%. During the winter, the abundance of individuals in AFS-2 and SF was statistically higher
Figure 1. Abundance of fauna (individuals per m2) in the litter fall and soil under agroforestry systems (AFS-1 and
than in the cassava monoculture, whereas during the summer AFS-1 and SF showed higher abundance of individuals than the cassava. (Figure 1a).
This result shows that the edaphic fauna responds positively to agroforestry management. The management practices used in a productive system can affect directly and indirectly the soil fauna, especially in terms of density and diversity (Nunes et al., 2008). Silva et al. (2012b) found higher amount and better nutritional quality of litter fall in AFSs and SF areas than in cassava monocultures. This fact might explain the higher abundance of individuals in AFSs and SF found in the present study. Some studies show that management systems that promote the maintenance of plant residues on the soil provide a more favorable environment for colonization by most groups of edaphic fauna (Moço et al., 2005).
We observed an increase in the abundance of individuals per square meter in the AFS-1 and forest (Figures 1a and 1b) from winter to summer. Silva et al. (2009) also observed an increase in the abundance of soil fauna from winter to summer in a secondary forest in Ubatuba, state of São Paulo, southeastern Brazil. These authors attributed that pattern to high moisture content in the soil, commonly observed during the summer (rainy season).
We found 24 taxonomic groups, which we divided into nine functional groups (Table 2). Microphagous were the most abundant group in the samples, with 4,277 individuals, which represented 52.12% of the total individuals collected in the study. Ants were the second
most abundant functional group, with 30.55% of the total individuals, followed by saprophagous (5.53%).
During the winter, ants showed higher average abundance in the forest than in all other areas. From winter to summer, there was an increase in the abundance of this group in AFS-1, and also in the forest, which showed a higher abundance of ants compared to AFS-2 and cassava monoculture, but similar to AFS-1 during the summer. Phytophagous also showed an increased abundance in AFS-1 and forest areas during the summer. In the AFS-1 the abundance was higher than in the AFS-2 and cassava monoculture, but not significantly different from the forest (Table 2). This result showed that the increase in abundance of individuals found in those areas during the study corresponded to the same functional groups. This fact corroborates the hypothesis of an intense biological flow between the forest and the AFS-1, which is a symptom of the edge effect (Didhan & Lawton, 1999; Copatti &Gasparetto, 2012). In a study conducted in southern Brazil, there was no difference in functional groups of soil fauna between agroforestry and native forest systems (Albuquerque et al., 2009).
The SF showed the highest abundance of holometabolous species during the winter compared to the AFS-1 and cassava monoculture. From winter to summer, there was a significant increase in microphagous and parasitoids in the SF, in addition to the ants and phytophagous previously mentioned. This pattern may result from a higher moisture content in the soil during summer (rainy season) (Nunes et al., 2012;
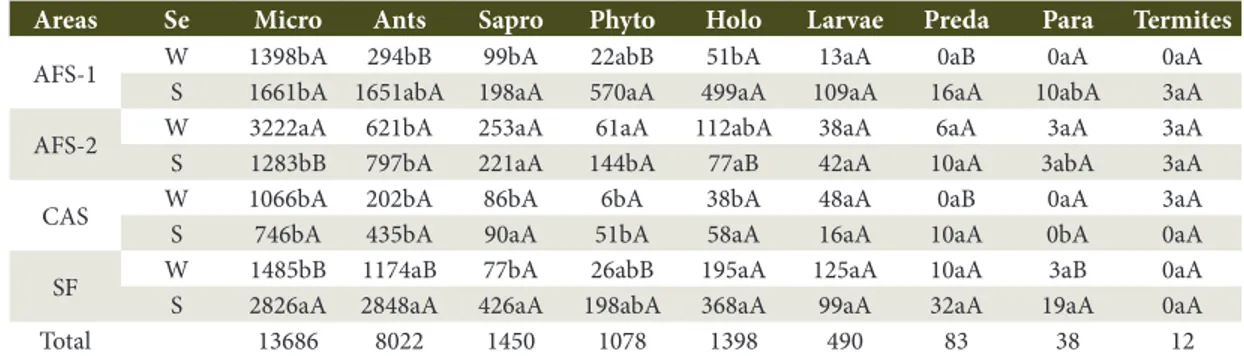
Table 2. Abundance of soil fauna (individuals per m2) classified by functional group under agroforestry systems
(AFS-1 and AFS-2), cassava monoculture (CAS), and secondary forest (FS) in two seasons (summer – S; winter – W).
Areas Se Micro Ants Sapro Phyto Holo Larvae Preda Para Termites
AFS-1 W 1398bA 294bB 99bA 22abB 51bA 13aA 0aB 0aA 0aA
S 1661bA 1651abA 198aA 570aA 499aA 109aA 16aA 10abA 3aA
AFS-2 W 3222aA 621bA 253aA 61aA 112abA 38aA 6aA 3aA 3aA
S 1283bB 797bA 221aA 144bA 77aB 42aA 10aA 3abA 3aA
CAS W 1066bA 202bA 86bA 6bA 38bA 48aA 0aB 0aA 3aA
S 746bA 435bA 90aA 51bA 58aA 16aA 10aA 0bA 0aA
SF W 1485bB 1174aB 77bA 26abB 195aA 125aA 10aA 3aB 0aA
S 2826aA 2848aA 426aA 198abA 368aA 99aA 32aA 19aA 0aA
Total 13686 8022 1450 1078 1398 490 83 38 12
Fernandes et al., 2011), and higher organic matter content (Silva et al., 2013; Tripathi & Sharma, 2006) as shown in Table 1. During the summer, saprophagous showed no significant differences between seasons or areas (Table 2), whereas during the winter, a higher abundance of this group was found in the AFS-2. That result may indicate an increased litter fall decomposition rate during the winter in AFS-2 compared to other areas. Saprophagous feed directly on plant litter (Moço et al., 2005), fragmenting them and contributing to litter fall decomposition, organic matter redistribution, and nutrient cycling in the environment (Correia & Andrade, 1999).
AFSs showed the lowest Shannon diversity (H’) and evenness (J) during the winter, and only the J of AFS-2 was significantly lower than that of cassava monoculture (Table 3). From winter to summer, AFS 1 and 2 showed an increase of approximately 60% in H’, associated with an increase of approximately 25% in richness in AFS-1, and an increase of 56% in J in AFS-2. The cassava monoculture showed high H’ and J in both seasons, but its taxonomic group richness was lower than that of AFS-2 during the winter and all other areas during the summer. The forest and the cassava monoculture showed no significant increase in H’, due to different reasons. In the forest, there was a high increase in richness but not in evenness, which remained unchanged. The cassava monoculture showed a small increase in richness, which did not surpass 15 groups during the summer (Table 3), suggesting a potential for diversity increase in AFSs, both in richness and evenness components.
Motta (2005) found similar results in Atlantic Forest fragments in Rio de Janeiro, with richness ranging from 15 to 22. However, these authors observed that J was below 0.31, resulting in an H’ below 1, which shows a strong dominance in the community.
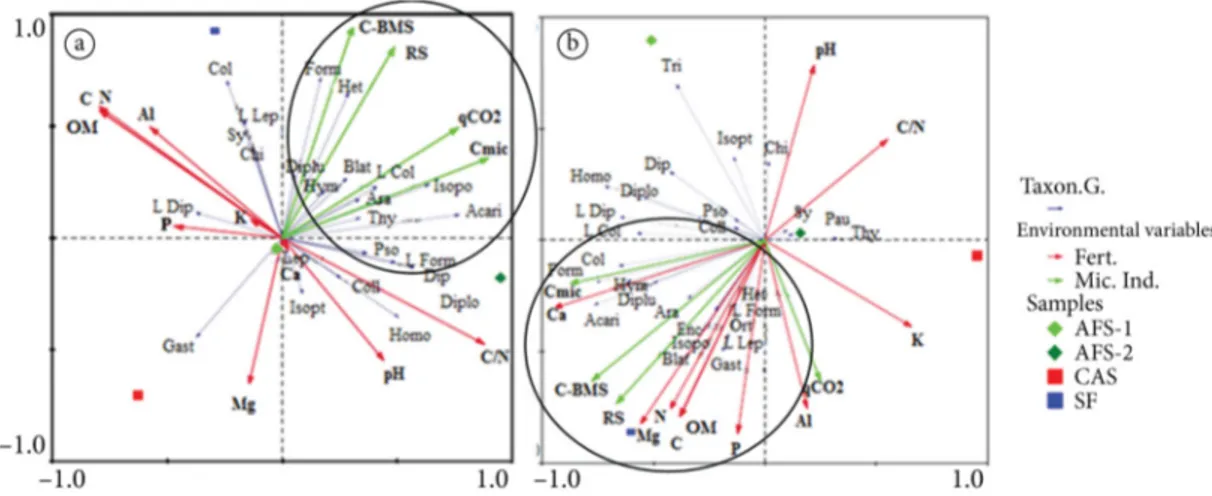
Figures 2a and 2b show the principal component analysis (PCA), where eigenvectors (arrows) represent the taxonomic groups and points represent the samples of each study area. During the winter, the areas were able to explain 30.6% of the fauna data variance (Figure 2a). Axis 1 explained 41.9% of data and axis 2 explained only 3%. Most eigenvectors pointed to the right on axis 1. The AFS-2 showed more samples on the right. This pattern indicates abundant and diverse fauna, which matches the high richness and abundance of individuals per square meter of this area in the winter. The forest showed samples in the central part, with average status. Finally, the cassava monoculture and AFS-1 showed samples on the left; the latter showed also samples in the right quadrant.
According to the PCA, the areas explained 33.5% of the variance during the summer, and of these data, 46% are explained on axis 1, and 9.8% on axis 2. In that season, most eigenvectors pointed to the left, indicating the abundance of most soil fauna groups in this direction. The forest was the only area with all samples in the upper left quadrant, forming the largest polygon. The pattern repeated during the winter, which indicates high variability between samples. The AFS-1 showed an intermediate pattern, with three samples near the center and two in the lower left quadrant, indicating abundance of individuals, but in a composition different from that of the forest.
Table 3. Shannon diversity (H’), species richness, and Pielou evenness (J) calculated for the soil fauna under two
agroforestry systems (AFS-1 and AFS-2), cassava monoculture (CAS), and secondary forest (SF) in two seasons (winter and summer).
Areas Season H’ Richness J
AFS-1 Winter 1.42 aB 16 abB 0.51 abA
Summer 2.30 aA 20 aA 0.77 aA
AFS-2 Winter 1.47 aB 21 aA 0.48 bB
Summer 2.33 aA 22 aA 0.75 aA
CAS Winter 1.58 aA 13 bA 0.62 aA
Summer 1.97 aA 15 bA 0.73 aA
SF Winter 1.82 aA 19 abB 0.62 abA
Summer 1.93 aA 22 aA 0.62 aA
That pattern was also evident when assessing the abundance of functional groups, showing that only some elements of the soil fauna behaved similarly in the AFS-1 and the forest. Considering edge effects (Copatti & Gasparetto, 2012), this pattern may result from group mobility, as in the case of ants or the resource availability in the AFS-1, which would be attracting organisms (e.g., phytophagous) from the forest. AFS-2 showed three samples in the right quadrant, approaching the cassava monoculture, which showed all samples in this quadrant. The decline in soil fauna status in AFS-2 during the summer is associated with a decrease in the abundance of individuals, especially microphagous. However, the AFS-2 maintained high richness of groups and diversity and evenness indexes during the summer.
The patterns found in the PCA can be seen in the principal response curves (PRC), which order the areas according to the fauna, on only one axis and allow comparison of the AFSs and the cassava monoculture with forests throughout the study period. During the winter, AFS-2 showed a higher discriminant coefficient (Cdt) (Figure 3) than the forest, and AFS-1 showed a slightly lower discriminant coefficient than the forest and considerably lower than the cassava monoculture.
During the summer, the discriminant coefficient of the AFS-2 and cassava monoculture decreased, and the forest was the area with the best status, followed by the AFS-1, AFS-2, and cassava monoculture.
The decline in the discriminant coefficient of the AFS-2 and cassava monoculture is partly due to the fact that the forest is the benchmark. The cassava monoculture was the most stable area, remaining low
Figure 2. Principal components analysis of the abundance of taxonomic groups of soil fauna and study areas
(agroforestry systems - AFS-1 and AFS-2, cassava monoculture – CAS and secondary forest -SF) during the winter (a) and summer (b). Formicidae – Form (ants), Blattodea – Blat, Diplopoda – Diplo, Diplura – Diplu, Enchytraeidae – Enc, Gastropoda – Gast, Isopoda – Isopo, Orthoptera – Ort, Pauropoda – Pau, Psocoptera – Pso, Symphyla – Sy, Thysanoptera - Thy, Heteroptera – Het, Homoptera – Homo, Coleoptera - Col, Diptera - Dip, Lepidoptera – Lep, Trichoptera – Tri, larvae (Coleoptera – L Col, Diptera – L Dip, Lepidoptera – L Lep and Trichoptera – L Tri), Araneae – Ara, Chilopoda – Chi, Hymenoptera – Hym, Isoptera – Isopt, Collembola – Coll.
Figure 3. Principal response curves (PRC) of
and constant in both seasons in terms of diversity, evenness, and richness; so that its fall on the graph indicates only that the cassava monoculture did not follow the trend of the forest. The AFS-2 showed a decline in the abundance of individuals, but was able to maintain the group richness and increase the evenness index throughout the study period. This is the expected pattern for a biological community throughout ecological succession (Machado et al., 2015). The AFS-1 remained very close to the forest in both seasons on the principal response curves, indicating that variations in the composition of soil fauna groups in these two areas showed the same trend.
Figures 4a and 4b showed the direct redundancy analysis (DRA), which summarizes the situation of the areas according to the explanatory (chemical and microbiological) and response (edaphic fauna) variables. During the winter, the environmental variables (chemical and microbiological) were able to explain 34.4% of the total variance of soil fauna. Regarding the explained variance, axis 1 explained 15.2%, and axis 2 explained 13.4%, showing that the variance was distributed along both axes (Figure 4a).
Eigenvectors related to soil fauna groups pointed mainly to the right, where AFS-2 occurred under the
influence of the Acari group that was abundant in this area, and upwards, where forest occurred. We also noticed the influence of the group Formicidae. The AFS-1 showed an intermediate pattern, near the center. The cassava monoculture was on the extreme lower left, indicating few fauna individuals. The microbiological indicators were in the upper right quadrant, and in addition to fauna, formed a group of biological components in which the best positioned areas were the AFS-2 and forest, followed by the AFS-1 in an intermediate situation, and the cassava monoculture in the opposite quadrant (Figure 4a). The axis of biological components showed the response of the AFS-2 to the litter deposition provided by agroforestry management, in which the microbial activity was stimulated to obtain a higher abundance of microphagous, saprophagous, and total individuals per square meter during the winter.
The axis formed by fertility variables showed a situation of high organic matter and nitrogen in the upper left quadrant, where the forest occurred, and the lower right quadrant, where the AFS-2 occurred with high pH and C/N ratio. The AFS-1 was in an intermediate situation, as well as the cassava monoculture, which stood out in other nutrients. The order observed on the axis formed by fertility variables matched the spatial pattern of those areas in the field, supporting the hypothesis
Figure 4. Direct redundancy analysis showing the canonical fauna ordering of soil samples from two agroforestry
that the AFS-1 and cassava monoculture were under the influence of the adjacent forest (Figure 4a).
The axis formed by biological components is positioned almost orthogonally to the fertility axis, showing little correlation between them (Figure 4a). This was due to the situation of the AFS-2, which showed positive responses to the agroforestry management on biological components whereas the soil chemical composition (Table 1) was not significantly affected during the winter.
During the summer, the direct redundancy analysis showed that the environmental variables explained 30.3% of the variance of groups in the samples. Most eigenvectors of fauna groups and most fertility and microbiological variables were in the lower left quadrant, where forest samples (Figure 4b), among the fertility variables, calcium (Ca, p = 0.004), magnesium (Mg, p = 0.052, n.s.), and OM (p = 0.408) were selected, and among the microbiological variables, C-mic (p = 0.002), SR (p = 0.042), and SMB-C (p = 0.190, n.s.) were selected. Among all environmental variables, Ca (p = 0.004), Mg (p = 0.052, n.s.), and OM (p = 0.408, n.s.) were selected, and, thus, all the selected variables were positioned in the lower left quadrant.
The forest was the only area with samples in the lower left quadrant, corresponding to the highest fertility, microbial activity, and abundance of edaphic fauna groups. Regarding the fauna, the forest and AFS-1 were positioned closer to the left, where most eigenvectors pointed. This pattern corroborates the principal response curves and agrees with the increase in Homoptera and Formicidae groups. The AFS-2 appeared in the upper left quadrant, near the center, in an intermediate position in relation to the fauna, but similar to the AFS-1 in relation to soil fertility. The cassava monoculture is on the far left, in a position contrary to most fauna arrows, showing low biological activity (Figure 4b).
4. CONCLUSIONS
In general, the studied agroforestry systems have fauna abundance and diversity (richness and Shannon index) similar to those of the forest. The type of agroforestry system is important to determine community composition. Most fauna groups were positively related to microbiological attributes, which indicates that
those invertebrates are probably stimulating the soil microbiota. On the other hand, the correlation of the fauna with chemical attributes was low.
SUBMISSION STATUS
Received: 14 sept., 2013 Accepted: 10 jan., 2016
CORRESPONDENCE TO
Marcos Gervasio Pereira
Departamento de Solos, Universidade Federal Rural do Rio de Janeiro – UFRRJ, Rodovia BR 465, Km 7, Campus Universitário, Zona Rural, CEP 23897-900, Seropédica, RJ, Brasil e-mail: [email protected]
REFERENCES
Albuquerque MP, Machado AMB, Machado AF, Victoria FC, Morselli TBGA. Fauna edáfica em sistema de plantio homogêneo, sistema agroflorestal e em mata nativa em dois municípios do Rio Grande do Sul, Brasil. Biociencias 2009; 17(1): 59-66.
Anderson TH, Domsch KH. Application of ecophysiological quotients (qCO2 and qD) on microbial biomasses from soils of different cropping histories. Soil Biology & Biochemistry 1990; 22(2): 251-255. http://dx.doi.org/10.1016/0038-0717(90)90094-G.
Anderson TH, Domsch KH. Determination of ecophysiological maintenance requirements of soil microorganisms in a dormant stage. Biology and Fertility of Soils 1985; 11: 81-89.
Aquino AM, Silva RF, Mercante FM, Correia MEF, Guimarães MF, Lavelle P. Invertebrate soil macrofauna under different ground cover plants in the no-till system in the Cerrado. European Journal of Soil Biology 2008; 44(2): 191-197. http://dx.doi.org/10.1016/j.ejsobi.2007.05.001.
Bailey BJR. Tables of the Bonferroni t Statistic. Journal of the American Statistical Association 1977; 72(358): 469-477.
Barros E, Neves A, Blanchart E, Fernandes ECM, Wandelli E, Lavelle P. Development of soil macrofauna community under silvopastoral and agrosilvicultural systems in Amazonia. Pedobiologia 2003; 47(3): 272-280. http:// dx.doi.org/10.1078/0031-4056-00190.
Bartlett RJ, Ross DS. Colorimetric determination of oxidizable carbon in acid soil solutions. Soil Science Society of America Journal 1988; 52(4): 1191-1192. http://dx.doi. org/10.2136/sssaj1988.03615995005200040055x.
Vitória: geologia, geomorfologia, pedologia, vegetação, uso potencial da terra. Rio de Janeiro: MME; 1983. Levantamento de recursos naturais v. 32.
Copatti CE, Gasparetto FM. Diversidade de insetos em diferentes tipos de borda em um fragmento de Floresta Ombrófila Mista. Revista Biociências 2012; 18: 32-40.
Correia MEF, Andrade AG. Formação de serapilheira e ciclagem de nutrientes. In: Santos GA, Camargo, FAO, editors. Fundamentos da matéria orgânica do solo: ecossistemas tropicais e subtropicais. Porto Alegre: Gênesis; 1999. p. 197-225.
Correia MEF, Oliveira LC. Fauna de solo: aspectos gerais e metodológicos. Seropédica: Embrapa Agrobiologia; 2000. Documento Técnico n. 112.
Cullen L Jr, Schimink M, Valladares-Pádua CC, Morato I. Agroforestry between zones: a tool for the conservation management of Atlantic Forest fragments. Natural Areas Journal 2001; 21(4): 346-356.
Didhan KK, Lawton JH. Edge structure determines the magnitude of changes in microclimate and vegetation structure in tropical forest fragments. Biotropica 1999; 31(1): 17-30.
Empresa Brasileira de Pesquisa Agropecuária – EMBRAPA. Centro Nacional de Pesquisa de Solos. Manual de métodos de análise de solo. 2nd. ed. Rio de Janeiro: EMBRAPA; 1997. 212 p.
Fernandes MM, Magalhães LMS, Pereira MG, Correia MEF, Brito RJ, Moura MR. Influência de diferentes coberturas florestais na fauna do solo na Flona Mário Xavier, no município de Seropédica, RJ. Floresta 2011; 41(3): 533-540. http://dx.doi.org/10.5380/rf.v41i3.24045.
Jenkinson DS, Powlson DS. The effects of biocidal treatmentes on metabolism in soil. I. Fumigation with chloroform. Soil Biology & Biochemistry 1976; 8: 167-177.
Lavelle P, Decaëns T, Aubert M, Barot S, Blouin M, Bureau F et al. Soil invertebrates and ecosystem services. European Journal of Soil Biology 2006; 42(1): S3-S15. http://dx.doi. org/10.1016/j.ejsobi.2006.10.002.
Lima SS, Aquino AM, Leite LFC, Velásquez E, Lavelle P. Relação entre macrofauna edáfica e atributos químicos do solo em diferentes agroecossistemas. Pesquisa Agropecuária Brasileira 2010; 45(3): 322-331.
Machado DL, Pereira MG, Correia MEF, Diniz AR, Menezes CEG. Fauna edáfica na dinâmica sucessional da mata atlântica em floresta estacional semidecidual na bacia do Rio Paraíba do Sul – RJ. Ciência Florestal 2015; 2: 91-106.
Mendonça ES, Leite LFC, Ferreira PS No. Cultivo de café em sistema agroflorestal: uma opção para a recuperação de solos degradados. Revista Árvore 2001; 25(3): 375-383.
Moço MKS, Gama-Rodrigues EF, Gama-Rodrigues AC, Correia MEF. Caracterização da fauna edáfica em diferentes coberturas vegetais na região norte fluminense. Revista
Brasileira de Ciencia do Solo 2005; 29(4): 555-564. http:// dx.doi.org/10.1590/S0100-06832005000400008.
Moço MKS, Gama-Rodrigues EF, Gama-Rodrigues AC, Machado RCR, Baligar VC. Soil and litter fauna of cacao agroforestry systems in Bahia, Brazil. Agroforestry Systems 2009; 76(1): 127-138. http://dx.doi.org/10.1007/ s10457-008-9178-6.
Motta LOJ. Fitossociologia e indicadores da qualidade do solo em fragmentos de Mata Atlântica, na cidade do Rio de Janeiro [dissertation]. Seropédica: Universidade Federal Rural do Rio de Janeiro; 2005.
Nunes LAPL, Araújo JA Fo, Menezes RIQ. Recolonização da fauna edáfica em áreas de Caatinga submetidas a queimadas. Caatinga 2008; 21(3): 214-220.
Nunes LAPL, Silva DIB, Araújo ASF, Leite LFC, Correia MEF. Caracterização da fauna edáfica em sistemas de manejo para produção de forragens no Estado do Piauí. Revista Ciência Agronômica 2012; 43: 30-37.
Pielou EC. Ecological diversity. New York: John Wiley & Sons; 1975.
Piña-Rodrigues FCM. Desenvolvimento de sistemas alternativos para a recuperação de áreas degradadas e geração de renda em comunidades tradicionais do entorno de unidades de conservação da Mata Atlântica. Seropédica: FAPUR; PRODETAB-Paraty; 2006.
Resende AS, Campello EFC, Silva GTA, Rodrigues KM, Oliveira WRD, Correia MEF. Artropodes do solo durante o processo de decomposição da matéria orgânica. Agronomía Colombiana 2013; 31: 89-94.
Seastedt TR. The role of microarthropods in decomposition and mineralization processes. Annual Review of Entomology 1984; 29(1): 25-46. http://dx.doi.org/10.1146/annurev. en.29.010184.000325.
Shannon CE, Weaver W. The mathematical theory of communication. Urbana: University of Illinois Press; 1964. 125 p.
Silva CF, Martins MA, Silva EMR, Pereira MG, Correia MEF. Influência do sistema de plantio sobre atributos dendrométricos e fauna edáfica, em área degradada pela extração de argila. Revista Brasileira de Ciencia do Solo 2013; 37(6): 1742-1751. http://dx.doi.org/10.1590/ S0100-06832013000600030.
Silva CF, Pereira MG, Correira MEF, Silva EMR. Fauna edáfica em áreas de agricultura tradicional no entorno do Parque Estadual da Serra do Mar em Ubatuba (SP). Revista de Ciências Agrárias (Belém.) 2009; 52: 107-115.
Silva J, Jucksch I, Maia CI, Feres A, Tavares CR. Fauna do solo em sistemas de manejo com café. Journal of Biotechnology and Biodiversity 2012a; 3(2): 59-71.
Tarrá ILC, Luizão FJ, Wandelli EV, Teixeira WG, Morais WJ, Fernandes ECM et al. Grupos funcionais da macrofauna e macroporos do solo em sistemas agroflorestais da amazônia central. Prospectiva 2012; 10: 6-17.
Tavares PD. Qualidade do solo em sistemas agroflorestais na Mata Atlântica [dissertation]. Seropédica: Universidade Federal Rural do Rio de Janeiro; 2014.
Ter Braak CJF. Ordination. In: Jongman RHG, Ter Braak CJF, Tongeren OFR, editors. Data analysis in community and landscape ecology. Cambridge: Cambridge University Press; 1995. p. 91-173.
Theenhaus A, Scheu S. Succecional changes in microbial biomass activity and nutrient status in faecal material of the slug Arion rufus (Gastropoda) deposited after feeding on different plant material. Soil Biology & Biochemistry 1996; 28(4-5): 569-577. http://dx.doi.org/10.1016/0038-0717(95)00161-1.
Tripathi G, Sharma BM. Interaction of above-and below-ground bioresources for improvement of chemical and biological health of soil. Científica 2006; 34: 75-91.
Vance ED, Brookes PC, Jenkinson DS. An extraction method for measuring soil microbial biomass C. Soil Biology & Biochemistry 1987; 19(6): 703-707. http:// dx.doi.org/10.1016/0038-0717(87)90052-6.
Vasconcelos HL, Pacheco R, Silva RC, Vasconcelos PB, Lopes CT, Costa AN et al. Dynamics of the leaf-litter arthropod fauna following fire in a Neotropical Woodland Savanna. PLoS One 2009; 4(11): e7762. http://dx.doi.org/10.1371/ journal.pone.0007762. PMid:19898619.