*Correspondence: R. B. Bazotte. Universidade Estadual de Maringá. Avenida Colombo 5790 - Bloco K68 – sala 101 - 87020-900 – Maringá, PR – Brasil. Tel.: +55-44-3011-5161; Fax: +55-44-3011-5050. E-mail: [email protected]
A
vol. 52, n. 4, oct./dec., 2016 http://dx.doi.org/10.1590/S1984-82502016000400021
Evaluation of the impact of orally administered carbohydrates on
postprandial blood glucose levels in different pre-clinical models
Any de Castro Ruiz Marques, Fabiana Percinoto Monteiro Schiavon, Patricia Batista Travassos,
Vanessa Fontana Eik, Guilherme Godoy, Christiano Rodrigues Schamber, Roberto Barbosa
Bazotte
*State University of Maringá, Department of Pharmacology and Therapeutics, Maringá, PR, Brazil
We developed a pre-clinical model in which toevaluate the impact of orally administered carbohydrates
on postprandial blood glucose levels. For this purpose, we compared the efects of diferent carbohydrates
with well-established glycemic indexes. We orally administered (gavage) increasing amounts (0.2, 0.4, 0.6, 0.8, and 1.0 g/kg) of sucrose and lactose to rats which had been fasted for 6 h or 15 h, respectively.
In part of the experiments we administered frutose (gavagem). Three diferent models were compared
for measuring postprandial blood glucose levels: a) evaluation of interstitial glucose concentrations by using a real time continuous glucose monitoring system; b) evaluation of glucose levels in blood obtained from the rat tail; c) evaluation of serum glucose levels in blood collected after decapitation. Our results showed that blood obtained from the tails of 15-h fasted rats was the best model in which to evaluate
the efect of carbohydrates on postprandial blood glucose levels.
Uniterms: Glycemic index/study. Glycemic index/oral administration. Glycemic load. Interstitial glucose. Real time continuous glucose monitoring system. Carbohydrates/posprandial glucose levels/rats.
INTRODUCTION
It is widely recognized that higher peak postprandial glucose (PPG) levels are associated with type 2 diabetes (Maki, Phillips, 2015), obesity (Thomas, Elliott, Baur, 2007), cardiovascular diseases (Little et al., 2014), liver steatosis (Valtueña et al., 2006), and cancer (Esfahani et al., 2009). Several studies have shown that consuming a diet with a low glycemic index (GI) can reduce insulin resistance (König et al., 2014), blood lipid concentrations (Levitan et al., 2008), body weight (Krebs et al., 2013), and the levels of glycated hemoglobin (Wang et al., 2015a) and pro-inflammatory markers (Feliciano, das Graças, Alfenas, 2014) in blood. Other studies have shown low GI diets to be associated with increased satiety (Pardo-Beutimea et al., 2012) and the incidence of cancer (Truong, Yuet, Hall, 2014).
The GI is a number which reflects how equal quantities of different types of carbohydrates affect
an individual’s PPG level (Png et al., 2014; Wang et al., 2015b), and provides a measure of carbohydrate quality (Hollenbeck, Coulston, 1991). Furthermore, the PPG level can be predicted with reasonable accuracy from the GI, when a standard mixed meal (Wolever, Jenkins, 1986) or carbohydrate is consumed (Hashimoto, Noguchi, Furutani, 2014). Another index, glycemic load (GL), is calculated by multiplying the GI by the amount of carbohydrate, and then dividing that result by 100 (Brand-Miller et al., 2003).
When considering that manufacturers are creating new food products at a much faster rate than GI and GL testing can be performed, the utilization of pre-clinical models to reproduce the results obtained from GI and GL tests conducted in humans has become increasingly necessary.
In this regard, non-diabetic rats can be used to
evaluate the efect of oral carbohydrates on blood glucose
levels (Bassoli et al., 2008). The main advantage of this model is that non-diabetic rats maintain their mechanisms needed to prevent postprandial hyperglycemia, and can be
studied without interference caused by insulin deiciency
(Kabir et al., 1998).
Our current study was conducted to identify a pre-clinical model in which to evaluate the impact of orally administered carbohydrates on PPG levels, and that better simulates results obtained in humans. For this purpose, we
compared the efects of three diferent carbohydrates with
well-established GI values (sucrose, lactose, and fructose), and that represent typical sugars consumedin theWestern
diet. Additionally, we evaluated the efects of fasting time,
the amount of carbohydrate administered, as well as the techniques used to measure glucose concentration.
MATERIAL AND METHODS
Animals
Male Wistar adult rats (Rattus norvegicus) weighing 280-330 g were used in this study. The rats were housed under condictions of constant temperature (23 ± 2 ºC), an automatically controlled photoperiod (12 h light/12 h dark), and free access to food and water. The rats were fed a standard commercial laboratory diet (Nutrilab CR1, Curitiba, PR, Brazil) ad libitum prior to undergoing the experimental procedures.
The rodent chow was composed of the proteins
(22%), ibers (8%), minerals (10%), calcium (1.4%) and
phosphorus (0.8%). Each kilogram of this product was enriched with the metionine (300 mg), lysine (100 mg), antioxidant (100 mg), vitamin A (12.000 IU), vitamin D3 (1.800 IU), vitamin E (30 mg), vitamin C (800 mg), vitamin K3 (3 mg), vitamin B1 (5 mg), vitamin B2 (6 mg), vitamin B6 (7 mg), vitamin B12 (20 µg), niacine (60 mg), pantotenic acid (20 mg), folic acid (1.0 mg), biotine (0.05 mg), coline (600 mg), iron (50 mg), zinc (60 mg), copper (10 mg), iodine (2 mg), manganese (60 mg), selenium (0.05 mg) and cobalt (1.5mg).
The rats were fasted for either 6 h or 15 h prior to starting the experiments. All procedures used in this study were approved by the Ethics Committee of the
State University of Maringá (Brazil), and were performed in accordance with guidelines provided by the Brazilian Council on Animal Experimentation (protocol number: 005/2013).
Experimental Protocol
Each carbohydrate (sucrose, lactose, and fructose) was dissolved in water (2.0 mL) for oral administration (gavage) to the rats.
Increasing amounts (0.2, 0.4, 0.6, 0.8, and 1.0 g/kg)
of either sucrose or lactose were administered. In the inal
set of experiments, sucrose (0.8 g/kg), lactose (0.8 g/kg), fructose (0.8 g/kg) or both sucrose (0.4 g/kg) and fructose (0.4 g/kg) were administered. In all experiments, rats in the control group received the same volume (2.0 mL) of vehicle (water).
In the irst set of experiments, changes in interstitial glucose concentration (IGC) were evaluated with a real-time continuous glucose monitoring system (RT-CGMS). The main advantages of using that system were that it reduced the numbers of animals required for the study, and permitted a greater number of glucose measurements to be obtained from each animal (Sybuia et al., 2014). The RT-CGMS is described in our previously published study (Carrara et al., 2012).
In the second set of experiments, the blood glucose concentrations (BGC) were determined by analyzing blood obtained from the tail of each animal at 0, 5, 15, 30, and 60 min after oral administration of the selected carbohydrate. For this purpose, a drop of blood was obtained after a small incision was made at the tip of the tail, and its glucose level was determined using a home glucometer (Diagnostics Accu-Chek® Active glucometer
- Roche Diagnostics; Jaguaré, Brazil).
In the third set of experiments, the animals were
sacriiced by decapitation; after which, samples of blood
were gathered and examined for their serum glucose concentrations using the glucose oxidase method (Bergmeyer, Bernt, 1974) as previously described (Zubioli et al., 2011). The results relected blood glucose
concentrations at 0, 5, 15, 30, and 60 min after oral administration of the selected carbohydrate.
In the inal set of experiments, blood was obtained from the tails of 15 h-fasted rats at 0, 5, 15, 30 and 60 min after oral administration of either sucrose (0.8 g/kg), lactose (0.8 g/kg), fructose (0.8 g/kg), or sucrose (0.4 g/ kg) plus fructose (0.4 g/kg).
Depending on their assigned group, the rats were
sacriiced by decapitation or euthanized with a high dose
groups), and then injected with a lethal dose of potassium chloride (2 mM into the heart).
Statistical Procedures
All data were analyzed by one way ANOVA (Tukey post hoc test) that was performed using Graph-Pad Prism
Version 5.0 software. Diferences between the glucose
concentration values before (time 0) and after (time 0 up to 60 minutes) an oral dose of carbohydrate were calculated as an area under the curve (AUC).
Individual and AUC results (expressed as mg/dL) are reported as the mean ± standard error of the mean.
P-values < 0.05 were considered statistically signiicant.
RESULTS
There was a signiicant (p<0.05) increase in the
AUC for IGC after oral administration of either sucrose (0.6 or 0.8 g/kg) or lactose (0.6, 0.8 or 1.0 g/kg) to 6-h fasted rats (Table I). There was also a significant (p < 0.05) increase in the AUC for IGC after oral administration of either sucrose (0.4, 0.6, 0.8 or 1.0 g/kg) or lactose (0.6, 0.8 or 1.0 g/kg) to 15-h fasted rats (Table II), when compared with the corresponding changes seen vehicle-dosed control rats. However, we did not observe such increased AUCs for glucose
concentrations in samples of tail blood (Table III) or blood collected after decapitation (Table IV).
We also observed a signiicantly (p<0.05) increased
AUC for glucose levels after analyzing samples of tail blood collected from 15-h fasted rats, which after being fasted, received an oral dose of either sucrose (0.4, 0.6, 0.8 or 1.0 g/kg) or lactose (0.2, 0.4, 0.6, 0.8 or 1.0 g/kg) (Table III). A similar increased AUC for glucose was found after analyzing samples of decapitation blood (p<0.05) collected from 15-h fasted rats, which after being fasted, received an oral dose of sucrose (0.2, 0.4, 0.6, 0.8, 1.0 g/ kg) or lactose (1.0 g/kg). These increases in glucose AUC values were relative to glucose AUC values which were calculated for control rats that were dosed with vehicle (Table IV).
The greatest diferences between sucrose and lactose
in terms of glycemic changes (individual values or AUC) were observed in samples of blood collected from 15-h fasted decapitated rats (Table IV). On the other hand, the AUCs that best reflected the GI values of sucrose and lactose were obtained when analyzing blood collected from 15-h fasted decapitated rats which received a 0.8 g/kg oral dose of those same carbohydrates (Table IV).
As shown in Table V, the results for sucrose (0.8 g/kg) and lactose (0.8 g/kg) were very similar to
those described in Table IV. Moreover, the results conirm
the greater effect of sucrose compared to lactose on
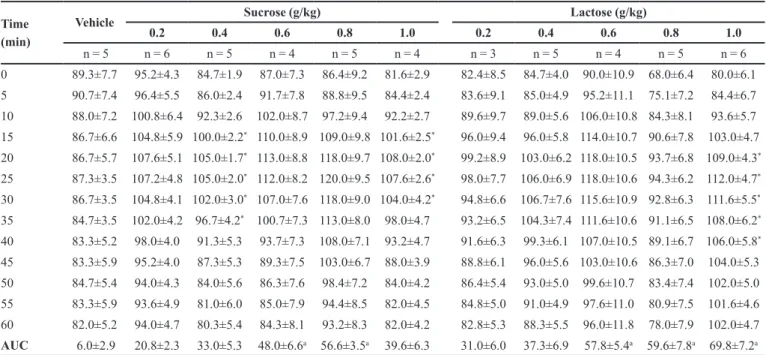
TABLE I - Interstitial glucose concentrations (IGCs) as measured with a continuous glucose monitoring system (mg/dL) in 6-h-fasted
rats which received increasing oral doses of sucrose or lactose. The control group received vehicle. Data are expressed as the mean ± standard error of the mean for results obtained from 3-6 rats. AUC: area under the curve
Time (min)
Vehicle Sucrose (g/kg) Lactose (g/kg)
0.2 0.4 0.6 0.8 1.0 0.2 0.4 0.6 0.8 1.0
n = 5 n = 6 n = 5 n = 4 n = 5 n = 4 n = 3 n = 5 n = 4 n = 5 n = 6 0 89.3±7.7 95.2±4.3 84.7±1.9 87.0±7.3 86.4±9.2 81.6±2.9 82.4±8.5 84.7±4.0 90.0±10.9 68.0±6.4 80.0±6.1 5 90.7±7.4 96.4±5.5 86.0±2.4 91.7±7.8 88.8±9.5 84.4±2.4 83.6±9.1 85.0±4.9 95.2±11.1 75.1±7.2 84.4±6.7 10 88.0±7.2 100.8±6.4 92.3±2.6 102.0±8.7 97.2±9.4 92.2±2.7 89.6±9.7 89.0±5.6 106.0±10.8 84.3±8.1 93.6±5.7 15 86.7±6.6 104.8±5.9 100.0±2.2* 110.0±8.9 109.0±9.8 101.6±2.5* 96.0±9.4 96.0±5.8 114.0±10.7 90.6±7.8 103.0±4.7
20 86.7±5.7 107.6±5.1 105.0±1.7* 113.0±8.8 118.0±9.7 108.0±2.0* 99.2±8.9 103.0±6.2 118.0±10.5 93.7±6.8 109.0±4.3*
25 87.3±3.5 107.2±4.8 105.0±2.0* 112.0±8.2 120.0±9.5 107.6±2.6* 98.0±7.7 106.0±6.9 118.0±10.6 94.3±6.2 112.0±4.7*
30 86.7±3.5 104.8±4.1 102.0±3.0* 107.0±7.6 118.0±9.0 104.0±4.2* 94.8±6.6 106.7±7.6 115.6±10.9 92.8±6.3 111.6±5.5*
35 84.7±3.5 102.0±4.2 96.7±4.2* 100.7±7.3 113.0±8.0 98.0±4.7 93.2±6.5 104.3±7.4 111.6±10.6 91.1±6.5 108.0±6.2*
40 83.3±5.2 98.0±4.0 91.3±5.3 93.7±7.3 108.0±7.1 93.2±4.7 91.6±6.3 99.3±6.1 107.0±10.5 89.1±6.7 106.0±5.8*
45 83.3±5.9 95.2±4.0 87.3±5.3 89.3±7.5 103.0±6.7 88.0±3.9 88.8±6.1 96.0±5.6 103.0±10.6 86.3±7.0 104.0±5.3 50 84.7±5.4 94.0±4.3 84.0±5.6 86.3±7.6 98.4±7.2 84.0±4.2 86.4±5.4 93.0±5.0 99.6±10.7 83.4±7.4 102.0±5.0 55 83.3±5.9 93.6±4.9 81.0±6.0 85.0±7.9 94.4±8.5 82.0±4.5 84.8±5.0 91.0±4.9 97.6±11.0 80.9±7.5 101.6±4.6 60 82.0±5.2 94.0±4.7 80.3±5.4 84.3±8.1 93.2±8.3 82.0±4.2 82.8±5.3 88.3±5.5 96.0±11.8 78.0±7.9 102.0±4.7 AUC 6.0±2.9 20.8±2.3 33.0±5.3 48.0±6.6a 56.6±3.5a 39.6±6.3 31.0±6.0 37.3±6.9 57.8±5.4a 59.6±7.8a 69.8±7.2a
TABLE II - Interstitial glucose concentrations (IGCs) as measured with a continuous glucose monitoring (mg/dL) system in 15-h-fasted rats which received increasing oral doses of sucrose or lactose. The control group received vehicle. Data are expressed as the mean ± standard error of the mean for results obtained from 3-4 rats. AUC: area under the curve
Time (min)
Vehicle Sucrose (g/kg) Lactose (g/kg)
0.2 0.4 0.6 0.8 1.0 0.2 0.4 0.6 0.8 1.0
n = 4 n = 4 n = 4 n = 4 n = 4 n = 3 n = 4 n = 4 n = 4 n = 3 n = 3
0 82.0±6.0 85.0±1.3 69.5±10.0 68.7±7.9 67.0±10.5 75.3±7.0 84.0±7.8 80.0±9.8 82.0±11.6 83.0±4.5 79.3±9.3 5 82.0±6.9 89.0±1.3 71.5±9.3 71.3±8.5 69.0±10.9 80.7±6.7 87.0±9.4 81.0±10.1 82.5±13.0 87.5±5.1 81.3±9.3 10 83.0±7.2 90.0±2.4 76.5±9.3 78.0±8.3 75.5±10.6 91.3±7.7 90.5±9.9 82.5±10.4 87.5±13.6 97.0±6.2 86.0±8.0 15 83.5±8.1 91.5±3.7 84.5±9.5 87.3±7.7 85.5±10.3 106.0±7.2 94.0±9.6 87.5±10.5 93.5±14.1 107.5±6.2 93.3±6.6 20 83.5±8.1 93.0±4.2 91.5±9.7 94.7±7.0 92.5±9.1 118.7±5.7* 95.5±8.8 93.0±9.9 99.0±14.4 114.0±5.8* 100.7±7.0
25 82.5±7.9 94.5±3.1 94.5±10.0 98.0±7.2 95.0±9.0 122.7±7.0* 93.0±7.5 95.5±10.1 100.5±13.6 116.5±5.2* 106.7±9.0
30 80.5±7.9 97.5±0.9 93.0±10.4 96.7±7.7 97.5±8.6 120.0±9.2* 90.0±7.0 95.0±9.2 99.5±11.5 115.0±5.4* 109.3±10.3
35 80.5±7.1 98.5±3.8 88.5±10.9 92.7±7.7 98.5±8.6 112.7±9.2* 87.0±6.2 92.0±8.7 98.0±9.6 111.5±6.3* 107.3±12.4
40 80.0±6.3 95.0±4.2 83.0±11.6 88.0±8.1 95.5±8.4 107.3±8.2 85.0±5.3 87.5±8.3 96.0±8.5 106.5±5.9 104.0±13.3 45 79.0±5.1 91.0±4.4 78.0±12.6 84.0±8.1 93.0±7.5 103.3±7.0 81.0±5.2 83.5±8.3 93.0±7.3 102.0±5.0 101.3±12.7 50 78.5±4.9 88.0±4.5 75.5±12.3 80.0±8.1 90.0±8.0 100.7±5.8 79.5±5.6 80.5±8.9 91.0±7.3 98.5±4.2 99.3±11.6 55 77.0±4.6 84.5±4.7 73.0±11.6 77.3±8.3 86.0±8.5 97.3±5.9 78.0±5.8 78.0±9.5 89.0±7.1 96.0±4.1 98.0±10.1 60 76.0±5.7 82.0±5.0 72.0±11.1 75.3±8.3 82.5±8.6 93.3±6.4 77.5±6.7 76.5±9.9 88.0±7.5 95.0±4.0 94.7±9.7 AUC 10.5±3.7 21.2±2.9 41.2±3.8a 52.6±1.3a 58.7±4.5a 89.7±5.9a 17.0±2.4 17.2±2.8 34.2±2.0a 67.0±4.7a 53.7±3.2a
* In the same column indicate p <0.05 vs. time 0. a In the same line indicate p <0.05 vs. vehicle.
TABLE III - Glucose concentrations in samples of blood collected from the tail as measured with a home glucometer (mg/dL). The
rats were fasted for either 6 h or 15 h, and then received increasing oral doses of sucrose or lactose. The control group received vehicle. Data are expressed as the mean ± standard error of the mean for results obtained from 3-6 rats. AUC: area under the curve
6-h-fasted rats
Time (min)
Vehicle Sucrose (g/kg) Lactose (g/kg)
0.2 0.4 0.6 0.8 1.0 0.2 0.4 0.6 0.8 1.0
n = 4 n = 3 n = 3 n = 3 n = 5 n = 3 n = 3 n = 3 n = 4 n = 5 n = 4
0 92.8±4.5 99.7±6.2 105.3±4.8 99.3±6.5 95.0±6.4 102.6±1.2 102.3±8.5 95.2±4.1 96.7±3.7 102.8±1.4 95.5±3.0 5 105.8±8.5 117.0±6.0 105.3±3.3 118.7±18.2 102.7±9.4 107.8±4.1 117.3±12.4 103.6±8.6 110.7±4.4 121.3±4.8* 98.0±4.3
15 114.5±3.2* 115.0±4.5 129.0±7.8 135.0±10.5 137.3±5.8* 125.2±4.0* 129.0±11.3 121.8±7.4* 110.7±4.7 124.0±2.5* 109.0±7.0
30 117.0±3.2* 116.0±2.6 132.3±8.5 131.0±3.2 128.7±3.8* 128.6±2.5* 130.7±5.4 122.8±1.3* 119.3±3.2* 128.5±1.5* 121.0±1.9*
60 115.8±2.1* 115.0±3.2 115.7±4.3 110.3±2.2 114.0±5.1 125.4±4.1* 115.3±2.7 117.4±1.3 113.3±4.8 123.8±4.7* 109.3±4.2
AUC 74.2±7.9 56.7±10.2 68.0±12.1 92.2±4.7 93.2±6.4 67.1±7.4 73.8±9.9 75.5±5.4 59.0±9.6 76.0±4.1 51.0±4.7 15-h-fasted rats
Time (min)
Vehicle Sucrose (g/kg) Lactose (g/kg)
0.2 0.4 0.6 0.8 1.0 0.2 0.4 0.6 0.8 1.0
n = 5 n = 4 n = 5 n = 4 n = 5 n = 4 n = 5 n = 5 n = 5 n = 3 n = 6
0 76.2±3.9 81.7±3.8 77.5±1.4 75.5±3.0 79.3±5.9 81.0±2.0 75.8±2.6 73.4±1.5 74.2±2.4 78.0±2.0 73.7±3.0 5 78.2±4.5 86.2±2.1 83.5±3.7 77.7±2.1 94.3±5.9 79.6±2.2 85.8±3.4 77.6±4.4 89.0±6.0* 87.4±2.6 87.7±3.4
15 83.0±5.0 108.5±8.9* 114.5±6.0*a 113.0±4.3*a 131.7±5.0*a 110.0±6.5* 103.0±6.3* 96.6±4.7* 103.6±2.8* 112.2±1.1*a 104.8±5.7*
30 96.8±4.0* 119.0±5.5* 127.5±5.7*a 147.0±5.9*a157.7±11.6*a139.7±9.9*a 115.8±4.1* 115.8±3.4* 125.4±3.2*a130.8±4.9*a 131.2±4.8*a
60 88.4±0.8 96.75±3.2 103.8±2.9* 111.3±6.3* 114.7±6.2*a 118.7±4.6*a 101.4±3.6* 106.2±4.1* 119.4±7.0*a 124.4±5.5*a 127.5±5.4*a
TABLE IV - Serum glucose concentrations in blood collected from decapitated rats as measured with standard commercial kits (mg/dL). The rats were fasted for either 6 h or 15 h, and then received increasing oral doses of sucrose or lactose. The control group received vehicle. Data are expressed as mean ± standard error of the mean for results obtained from 2-6 rats. AUC: area under the curve
6-h-fasted rats
Time
(min) Vehicle
Sucrose (g/kg) Lactose (g/kg)
0.2 0.4 0.6 0.8 1.0 0.2 0.4 0.6 0.8 1.0
0 127.7±3.2 (3) 133.6±4.5 (4) 138.0±1.7 (3) 135.0±6.4 (3) 138.0±5.2 (3) 130.4±3.8 (4) 136.6±6.6 (4) 135.7±5.7 (4) 137.4±6.0 (3) 136.4±3.2 (4) 142.4±4.2 (4) 5 158.8±3.4*
(3) 158.3±9.2 (4) 177.6±16.3 (3) 174.3±3.7* (3) 176.2±5.8* (3) 167.9±6.2* (4) 141.5±3.6 (4) 157.5±10.6 (4) 169.7±5.8* (2) 172.8±2.8* (4) 161.9±15.9 (4) 15 154.0±6.5*
(3) 160.2±4.7 (4) 157.0±3.2 (3) 152.0±8.2 (3) 156.7±8.5 (2) 152.0±2.6* (4) 142.2±1.4 (4) 137.0±4.5 (4) 156.0±0.9 (3) 162.0±4.4* (4) 163.7±3.7 (4) 30 139.6±6.4 (3) 130.6±5.2 (4) 130.0±4.2 (3) 133.0±8.3 (3) 130.0±4.0 (2) 150.5±5.4 (4) 133.0±12.5 (4) 137.6±7.2 (4) 141.6±2.3 (3) 141.2±9.5 (4) 144.2±7.2 (4) 60 129.2±4.4 (3) 132.9±6.2 (4) 144.7±11.9 (3) 133.5±6.4 (3) 136.8±2.8 (3) 137.2±4.5 (4) 125.9±7.7 (4) 122.2±4.2 (4) 128.9±5.3 (3) 129.1±2.8 (4) 137.1±5.5 (4) AUC 66.1±1.9 66.9±7.2 74.6±2.7 57.1±8.5 56.5±7.5 78.4±8.2 15.5±6.0a 28.9±7.0 45.8±5.9 58.0±8.5 63.9±13.6
15-h-fasted rats 0 95.0±1.6 (5) 95.2±2.1 (6) 91.4±1.5 (5) 94.3±3.0 (4) 95.7±3.1 (5) 94.0±2.0 (4) 100.0±5.1 (3) 94.3±2.5 (5) 89.4±4.0 (4) 99.2±3.0 (5) 95.4±3.6 (6) 5 102.7±1.9 (5) 126.5±4.2*a (6) 124.1±7.6* (5) 128.9±3.8*a (4) 138.8±7.4*a (5) 138.7±5.1*a (4) 104.7±3.7 (3) 115.2±7.1 (5) 108.6±5.9 (4) 107.7±2.4 (5) 117.4±3.5* (6) 15 111.4±4.7*
(5) 142.4±6.3*a (6) 166.2±7.6*a (5) 164.8±4.2*a (4) 176.6±6.1*a (5) 179.6±7.8*a (4) 129.4±6.1* (3) 136.1±6.3* (5) 113.5±10.3 (4) 131.4±4.5* (5) 139.3±5.8* (6) 30 103.4±4.1 (5) 118.8±5.3* (6) 134.9±3.8*a (5) 140.5±7.0*a (4) 143.0±4.5*a (5) 160.2±6.0*a (4) 112.6±7.2 (3) 114.7±4.5 (5) 115.2±1.9 (4) 134.4±6.9*a (5) 121.7±2.3* (6) 60 89.1±2.7 (5) 102.1±2.5 (6) 101.6±1.8 (5) 111.5±6.1a (4) 111.4±2.1a (5) 119.6±4.7*a (4) 104.5±3.5 (3) 109.2±4.4a (5) 113.9±5.3a (4) 115.5±4.3a (5)
114.2±5.5*a
(6) AUC 37.7±3.0 117.0±9.0a 156.3±11.2a 160.0±15.8a 179.2±15.2a 207.0±16.7a 68.3±10.4 90.7±13.2 81.5±19.9 84.2±5.0 99.7±11.6a
* In the same column indicate p <0.05 vs. time 0. a In the same line indicate p <0.05 vs. vehicle.
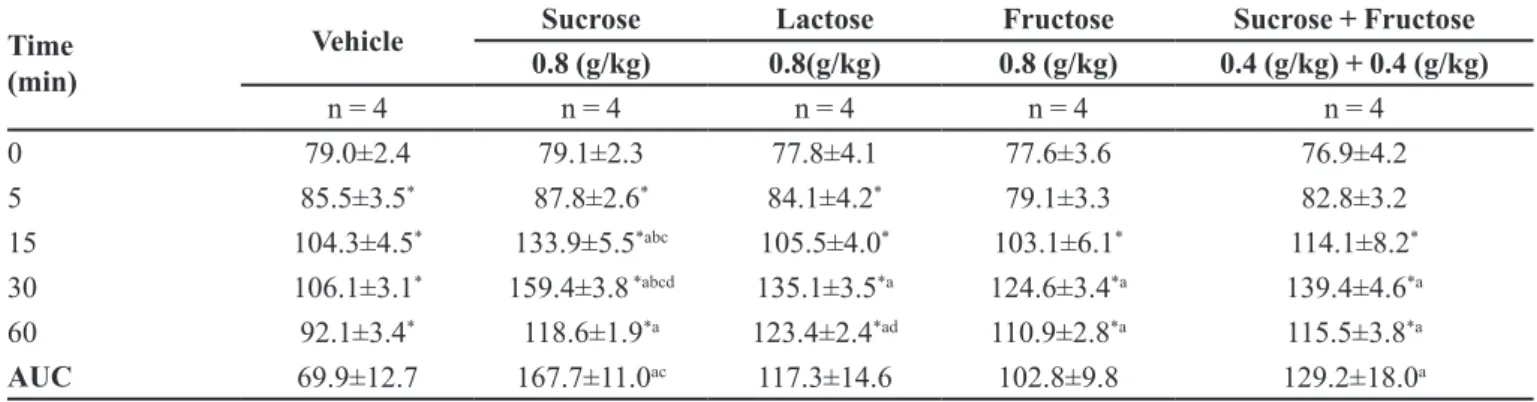
TABLE V - Blood glucose concentrations in samples of tail blood obtained from 15-h fasted rats which received sucrose, lactose,
fructose or sucrose + fructose, as measured with a home glucometer (mg/dL). The control group received vehicle. The individual values (0, 5, 15, 30, 60 min) and the areas under the curve (AUC) are expressed as the mean ± standard error for results obtained from 4 rats
Time (min)
Vehicle Sucrose Lactose Fructose Sucrose + Fructose
0.8 (g/kg) 0.8(g/kg) 0.8 (g/kg) 0.4 (g/kg) + 0.4 (g/kg)
n = 4 n = 4 n = 4 n = 4 n = 4
0 79.0±2.4 79.1±2.3 77.8±4.1 77.6±3.6 76.9±4.2
5 85.5±3.5* 87.8±2.6* 84.1±4.2* 79.1±3.3 82.8±3.2
15 104.3±4.5* 133.9±5.5*abc 105.5±4.0* 103.1±6.1* 114.1±8.2*
30 106.1±3.1* 159.4±3.8 *abcd 135.1±3.5*a 124.6±3.4*a 139.4±4.6*a
60 92.1±3.4* 118.6±1.9*a 123.4±2.4*ad 110.9±2.8*a 115.5±3.8*a
AUC 69.9±12.7 167.7±11.0ac 117.3±14.6 102.8±9.8 129.2±18.0a
* In the same column indicate p<0.05 vs. time 0. Letters in the same line: a p<0.05 vs. vehicle, b p<0.05 vs. lactose, c p<0.05 vs.
post-prandial glucose (PPG) levels Finally, the amount of sucrose or lactose administered (GL) had minimal influence (individual values or AUC) on the glucose concentrations in blood collected from the tail (Table III) or after decapitation (Table IV), not only in 6-h fasted rats, but also in 15-h fasted rats.
DISCUSSION
We found that the period of fasting influenced the PPG response to an oral dose of sucrose or lactose. However, we did not observe an increase in the AUC of PPG in blood obtained from the tail or after capitation of 6-h fasted rats which received an oral dose of sucrose or lactose (Tables III and IV).
In contrast, we observed a significant (p < 0.05) increase in the AUC for IGC (vs. vehicle) after a dose of sucrose (0.6 or 0.8 g/kg) or lactose (0.6, 0.8 or 1.0 g/kg) in 6-h fasted rats (Table I). Taken together, these results suggest that when using a more physiological period of fasting, (i.e., 6-h of food deprivation), IGC
measurements more accurately relect PPG levels after
an oral administration of carbohydrates. However, despite our expectation that a higher GL would result in a higher peak PPG level (Atkinson, Foster-Powell, Brand-Miller, 2008; Brand-Miller et al., 2003; Liu et al., 2000;Venn et al., 2006), we did not observe a clear relationship between the GL and PPG levels, not only for the IGC/6-h fasted rats, but for all of the experimental conditions investigated. On the other hand, increased IGCs (p < 0.05 vs.
vehicle) (Table II), were detected in tail blood (Table III) and decapitation blood (Table IV) obtained from 15-h fasted rats which received an oral dose of sucrose or lactose. The superior accuracy achieved when using a longer fasting period might be attributable to less interference from liver glycogenolysis (Schiavon et al., 2014; Tavoni et al., 2013).
Although the values for interstitial glucose and PPG concentrations in tail blood and decapitation blood obtained from 15-h fasted rats were better correlated with the amount of carbohydrate administered when compared with those values in 6-h fasted rats, the PPG values obtained from tail blood may be preferable to the IGC values obtained from decapitation blood when seeking a reliable test for PPG levels in rats. This notion is based on the fact that the AUC values obtained from tail blood more accurately reflect the GI values of sucrose (GI = 59) and lactose (GI = 46) in humans, and particularly when those carbohydrates are administered at doses of 0.6, 0.8, and 1.0 g/kg. For example, when administered at a dose of 0.8 g/kg, the AUC values obtained for sucrose and lactose in decapitation blood
were 179.2 ± 15.2 mg/dL and 84.2 ± 5.0 mg/dL (Table IV) respectively, i.e., a mathematical proportion of 59 (sucrose) to 28 (lactose). On the other hand, the AUC values for sucrose and lactose in tail blood were 164.8 ± 13.4 mg/ dL and 123.3 ± 10.8 mg/dL (Table III), respectively, i.e., a mathematical proportion of 59 (sucrose) to 44 (lactose).
Thus, the AUC values obtained with tail blood better relect
the GI values of sucrose (Jenkins et al., 1981) and lactose (Foster-Powell, Holt, Brand-Miller, 2002) in humans.
Despite the advantages of using a RT-CGMS to measure IGC values (Sybuia et al., 2014), that technique less often reproduced the results obtained from GI tests in humans.
In the last set of experiments blood was obtained from the tails of 15 h-fasted which received either sucrose (0.8 g/kg), lactose (0.8 g/kg) or fructose (0.8 g/kg), or a mixture of sucrose (0.4 g/kg) plus fructose (0.4 g/kg).
The results (Table V) obtained when using sucrose (0.8 g/kg) or lactose (0.8 g/kg) were very similar to those shown in Table III. When using tail blood, the AUC values for sucrose and lactose were 167.7 ± 11.3 mg/dL and 117.3 ± 14.6 mg/dL (Table V), respectively; i.e., a mathematical proportion of 59 (sucrose) to 41 (lactose), and once again, better reflected the GI values of sucrose (GI = 59) and lactose (GI = 46) in humans. Moreover, as we expected, fructose (GI = 20) showed a lower (p < 0.05) AUC than did sucrose or the 50%/50% mixture of sucrose and fructose, which showed an AUC value intermediate between those of sucrose and fructose.
In contrast to our current results, past investigations concerning the impact of isolated carbohydrates or mixed foods on human blood glucose levels have shown great variability among the tested individuals, which have included healthy subjects, as well as pre-diabetic and diabetic subjects (Atkinson, Foster-Powell, Brand-Miller, 2008). Moreover, inter-individual and intra-individual variations (Vega-López et al., 2007), the placebo effect (Sievenpiperet al., 2007), and several other factors (Foster-Powell, Holt, Brand-Miller, 2002; Woleveret al., 2009) that
can inluence such results must be taken into consideration.
In this context, using rats whose blood had been analyzed using a standardized methodology provides many advantages. For example, it is possible to control several
variables which might inluence the study results, including
age, gender, strain, body weight, feeding schedule, period of fasting, and room temperature (Iannaccone, Jacob, 2009).
CONCLUSION
of carbohydrates on PPG levels, and then extrapolate the results to humans.
ACKNOWLEGEMENTS
This study received funding from the Brazilian government [(National Council for Scientific and Technological Development (CNPq)], the Higher Education Personnel Training Coordination Program (CAPES), and the Program of Support for Excellence Centers (PRONEX)/Araucaria Foundation (RBB received
the inancial support).
REFERENCES
ATKINSON, F.S.; FOSTER-POWELL, K.; BRAND-MILLER, J.C. International tables of glycemic index and glycemic
load values. Diab. Care, v.31, n.12, p.2281–2283, 2008.
BASSOLI, B.K.; CASSOLLA, P.; MURAD, G.R.B.; CONSTANTIN, J.; SALGUEIRO-PAGADIGORRIA, C.L.; BAZOTTE R.B.; SILVA, R.S.; SOUZA H.M. Chlorogenic acid reduces the plasma glucose peak in the oral glucose tolerance test: efects on hepatic glucose
release and glycaemia. Cell. Biochem. Function, v.26, n.3,
p.320-328, 2008.
BERGMEYER, H.U; BERNT, E. Determination of glucose with glucose oxidase and peroxidase. In: BERGMEYER,
H.U. ed. Methods of enzymatic analysis. New York: Verlag
Chemie-Academic Press, 1974. p.1205-1215.
BRAND-MILLER, J.C.; THOMAS, M.; SWAN, V.; AHMAD, Z.I.; PETOCZ, P.; COLAGIURI, S. Physiological validation of the concept of glycemic load in lean young
adults. J. Nutr., v.133, n.9, p.2728-2732, 2003.
CARRARA, M.A.; BATISTA, M.R.; SURUHASHI, T.R.; FELISBERTO-JUNIOR, A.M.; GUILHEMETTI, M.; BAZOTTE R.B. Coexistence of insulin resistance and increased glucose tolerance in pregnant rats: A physiological
mechanism for glucose maintenance. Life Sci., v.90,
n.21-22, p.831-837, 2012.
E S FA H A N I , A . ; W O N G , J . M . ; M I R R A H I M I , A . ; SRICHAIKUL, K.; JENKINS, D.J.; KENDALL, C.W.
The glycemic index: physiological signiicance. J. Am. Coll.
Nutr., v.28, Suppl.439S-445S, 2009.
FELICIANO, P.P.; DAS GRAÇAS, A.C.; ALFENAS, R.C. Glycemic index role on visceral obesity, subclinical
inlammation and associated chronic diseases. Nutr. Hosp.,
v.30, n.2, p.237-243, 2014.
FOSTER-POWELL, K.; HOLT, S.H.; BRAND-MILLER, J.C. International table of glycemic index and glycemic load
values: 2002. Am. J. Clin. Nutr., v.76, n.1, p.55-56, 2002.
FROST, G.; DORNHORST, A. The relevance of the glycaemic
index to our understanding of dietary carbohydrates. Diabet.
Med., v.17, n.5, p.336-345, 2000.
HASHIMOTO, S.; NOGUCHI, C.C.; FURUTANI, E. Postprandial blood glucose control in type 1 diabetes for
carbohydrates with varying glycemic index foods. Conf.
Proc. IEEE Eng. Med. Biol. Soc., v. 2014, p.4835-4838, 2014.
HOLLENBECK, C.B.; COULSTON, A.M. The clinical utility of the glycemic index and its application to mixed meals.
Can. J. Physiol. Pharmacol., v.69, n.1, p.100-107, 1991.
IANNACCONE, P.M.; JACOB, H.J. Rats! Dis. Model Mech.,
v.2, n.5-6, p.206-210, 2009.
JENKINS, D.J.; WOLEVER, T.M.; TAYLOR, R.H.; BARKER, H.; FIELDEN, H.; BALDWIN, J.M.; BOWLING, A.C.; NEWMAN, H.C.; JENKINS, A.L.; GOF, D.V. Glycemic index of foods: a physiological basis for carbohydrate
exchange. Am. J. Clin. Nutr., v.34, n.3, p.362-366, 1981.
KABIR, M.; RIZKALLA, S.W.; QUIGNARD-BOULANGÉ, A.; GUERRE-MILLO, M.; BOILLOT, J.; ARDOUIN, B.; LUO, J.; SLAMA, G. A high glycemic index starch diet afects lipid storage-related enzymes in normal and to a
lesser extent in diabetic rats. J. Nutr., v.128, n.11,
p.1878-1883, 1998.
KREBS, J.D.; BELL, D.; HALL, R.; PARRY-STRONG, A.; DOCHERTY, P.D.; CLARKE K.; CHASE J.G. Improvements in glucose metabolism and insulin sensitivity with a low-carbohydrate diet in obese patients with type 2
diabetes. J. Am. Coll. Nutr., v.32, n.1, p.11-17, 2013.
KÖNIG, D.; KOOKHAN, S.; SCHAFFNER, D.; DEIBERT, P.; BERG, A. A meal replacement regimen improves blood glucose levels in prediabetic healthy individuals with
impaired fasting glucose. Nutrition, v.30, n.11-12,
LEVITAN, E.B.; COOK, N.R.; STAMPFER, M.J.; RIDKER, P.M.; REXRODE, K.M.; BURING, J.E.; MANSON, J.E.; LIU S. Dietary glycemic index, dietary glycemic load,
blood lipids, and C-reactive protein. Metabolism, v.57, n.3,
p.437-443, 2008.
LITTLE, J.P.; JUNG, M.E.; WRIGHT, A.E.; WRIGHT, W.; MANDERS, R.J.F. Effects of high-intensity interval exercise versus continuous-moderate intensity exercise on postprandial glycemic control assessed by continuous
glucose monitoring in obese adults. Appl. Physiol. Nutr.
Metab., v.39, n.7, p.835-841, 2014.
LIU, S.; WILLETT, W.C.; STAMPFER, M.J.; H.U. FB.; FRANZ, M.; SAMPSON, L.; HENNEKENS, CH.; MANSON, JE. A prospective study of dietary glycemic load, carbohydrate intake, and risk of coronary heart disease
in US women. Am. J. Clin. Nutr., v.71, n.6, p.1455–1461,
2000.
LUDWIG, DS. The glycemic index: physiological mechanisms relating to obesity, diabetes, and cardiovascular disease.
JAMA, v.287, n.18, p.2414-2423, 2002.
MAKI, K.C.; PHILLIPS, A.K. Dietary substitutions for reined carbohydrate that show promise for reducing risk of type
2 diabetes in men and women. J. Nutr., v.145, n.1,
p.159S-163S, 2015.
PARDO-BUITIMEA, N.Y.; BACARDÍ-GASCÓN, M.; CASTAÑEDA-GONZÁLEZ L.; JIMÉNEZ-CRUZ, A. Glycaemic index and glycaemic load of three traditional
Mexican dishes. Int. J. Food Sci. Nutr., v.63, n.1,
p.114-116, 2012.
PNG, W.; BHASKARAN, K.; SINCLAIR, AJ.; AZIZ, A.R. Effects of ingesting low glycemic index carbohydrate food for the sahur meal on subjective, metabolic and physiological responses, and endurance performance in
Ramadan fasted men. Int. J. Food Sci. Nutr., n.65, v.5,
p.629-636, 2014.
RECIO-RODRIGUEZ, J.I.; GOMEZ-MARCOS, M.A.; PATINO-ALONSO, M.C.; RODRIGO-DE PABLO, E.; CABREJAS-SÁNCHEZ, A.; ARIETALEANIZBEASKOA, M.S.; REPISO-GENTO, I.; GONZALEZ-VIEJO, N.; MADERUELO-FERNANDEZ, J.A.; AGUDO-CONDE, C.; GARCIA-ORTIZ, L. Glycemic index, glycemic
load, and pulse wave reflection in adults. Nutr. Metab.
Cardiovasc. Dis., v.25, n.1, p.68-74, 2015.
SIEVENPIPER, J.L.; EZATAGHA, A.; DASCALU, A.; VUKSAN, V. When a placebo is not a ‘placebo’: a placebo
efect on postprandial glycaemia. Br. J. Clin. Pharmacol.,
v.64, n.4, p.546-549, 2007.
SCHIAVON, F.P.M.; MARQUES, A.C.R.; CARRARA, M.A.; SOUZA, H.M.; SCHAMBER, C.R.; CURI, R.; BAZOTTE, R.B. Pivotal role of cAMP in the activation of liver glycogen
breakdown in high-fat diet fed mice. Life Sci., v.1, p.1-5,
2014.
SYBUIA, M.F.; GUILHERMETTI, M.; MANGOLIM, C.S.; BAZOTTE, R.B.; MATIOLI, G. Impact of cyclodextrins on postprandial glycemia: evaluation in experimental animal model using the real-time continuous glucose monitoring
system. J. Med. Food, v.18, n.6, p.625-630, 2014.
TAVONI, T.; OBICI, S.; MARQUES, A.C.R.; MINGUETTE-CAMARA, V.C.; CURI, R.; BAZOTTE, R.B. Evaluation of liver glycogen catabolism during hypercortisolism induced
by the administration of dexamethasone in rats. Pharmacol.
Rep., v.65, n.1, p.144-151, 2013.
THOMAS, D.E.; ELLIOTT, E.J.; BAUR, L. Low glycaemic index or low glycaemic load diets for overweight
and obesity. Cochrane Database Syst. Rev., v.18, n.3,
p.CD005105, 2007.
TRUONG, T.H.; YUET, W.C.; HALL, M.D. Glycemic index
of American-grown jasmine rice classiied as high. Int. J.
Food Sci. Nutr., v.65, n.4, p.436-439, 2014.
VALTUEÑA, S.; PELLEGRINI, N.; ARDIGÒ, D, DEL RIO, D.; NUMEROSO, F.; SCAZZINA, F.; MONTI, L.; ZAVARONI, I.; BRIGHENTI, F. Dietary glycemic index
and liver steatosis. Am. J. Clin. Nutr., v.84, n.1, p.136-142,
2006.
VEGA-LÓPEZ, S.; AUSMAN, L.M.; GRIFFITH, J.L.; LICHTENSTEIN, A.H. Interindividual variability and intra-individual reproducibility of glycemic index values
for commercial white bread. Diab. Care, v.30, n.6,
p.1412-1417, 2007.
VENN, B.J.; WALLACE, A.J.; MONRO, J.A.; PERRY, T.; BROWN, R.; FRAMPTON, C.; GREEN, T.J. The glycemic load estimated from the glycemic index does not differ greatly from that measured using a standard curve in healthy
WANG, Q.; XIA, W.; ZHAO, Z.; ZHANG, H. Effects comparison between low glycemic index diets and high glycemic index diets on HbA1c and fructosamine for patients with diabetes: A systematic review and
meta-analysis. Prim. Care Diab., v.9, n.5, p.362-369, 2015a.
WANG, M.L.; GELLAR, L.; NATHANSON, B.H.; PBERT, L.; M.A. Y.; OCKENE, I.; ROSAL, M.C. Decrease in glycemic index associated with improved glycemic control among
latinos with type 2 diabetes. J. Acad. Nutr. Diet, v.115, n.6,
p.898-906, 2015b.
WOLEVER, T.M.; JENKINS, D.J. The use of the glycemic index in predicting the blood glucose response to mixed
meals. Am. J. Clin. Nutr., v.43, n.1, p.167-172, 1986.
WOLEVER, T.M.; JENKINS, A.L.; VUKSAN, V.; CAMPBELL, J. The glycaemic index values of foods containing fructose
are afected by metabolic diferences between subjects. Eur.
J. Clin. Nutr., v.63, n.9, p.1106-1114, 2009.
ZUBIOLI, A.; BATISTA, M.R.; STEFANELLO, T.F.; CARRARA, M.A; BAZOTTE, R.B. Pharmaceutical consultation as a tool to improve health outcomes for
patients with type 2 diabetes. Braz. J. Pharm. Sci. v.47,
p.615-621, 2011.
Received for publication on 02nd December 2015