http://dx.doi.org/10.1590/s2175-97902017000116092
A
r
*Correspondence: B. M. Mendes. Centro de Desenvolvimento da Tecnologia Nuclear (CDTN/CNEN). Av. Antônio Carlos, 6627, Pampulha - 31270-901 Belo Horizonte, MG, Brazil. E-mail: [email protected] or [email protected]
Development of a mouse computational model for MCNPx based
on Digimouse
®images and dosimetric assays
Bruno Melo Mendes
1,2, Iassudara Garcia de Almeida
2, Bruno Machado Trindade
2, Telma Cristina
Ferreira Fonseca
1, Tarcísio Passos Ribeiro de Campos
21Centro de Desenvolvimento da Tecnologia Nuclear (CDTN/CNEN), Belo Horizonte, MG, Brasil, 2Departamento de Engenharia Nuclear, DEN, Programa de Pós-Graduação em Ciências e Técnicas Nucleares, Universidade Federal de Minas
Gerais, UFMG, Belo Horizonte, MG, Brasil
The aim of this study was to create and test a new mice 3D-voxel phantom named DM_BRA for mice and human irst-estimation radiopharmaceutical dosimetry. Previously, the article reviews the state-of-art in animal model development. Images from Digimouse CT database were used in the segmentation and on the generation of the voxelized phantom. Simulations for validation of the DM_BRA model was performed at 0.015, 0.1, 0.5, 1 and 4 MeV photons with heart-source. Speciic Absorbed Fractions (SAF) data were compared with literature data. The organ masses of DM_BRA correlated well with existing models based on the same dataset; however, few small organ masses hold signiicant variations. The SAF data in most simulated cases were statistically equal to a signiicant level of 0.01 to the reference data.
Uniterms: Dosimetry/assay. Mouse phantom/tests. MCNPx Monte Carlo code Computational studies.
INTRODUCTION
Small animals, such as mice, have been widely used in experimental protocols involving ionizing radiation. Biodistribution studies have often been conducted in
murine to obtain a irst estimation of the absorbed doses in
humans (Stabin et al., 2006). The animal absorbed doses estimation, in most cases, do not reach values which can bias the experimental results (Carlson et al., 2007). However, experimental methods have often included extensive image generation (MicroCT and/or PET/SPECT) and radiopharmaceuticals therapeutic doses administration that provide a large absorbed dose in the experimental animals. Previous work has shown that even low absorbed doses (50
to 500 mGy) can induce biological efects in mice (Wang,
Cai, 2000; Yonezawa, 2006). In such cases, the accurate quantification of absorbed doses and the determination of the energy deposition patterns are of fundamental importance to qualify or exclude potential radiobiological
efects that may interfere with in vivo experiments.
The physical measurement of absorbed doses can be performed by TLD or another kind of dosimeter (like
MOSFET) implanted in interest organs or tissues (Stabin
et al., 2006; Carlson et al., 2007; Kolbert et al., 2003,
Flynn et al., 2001). However, the invasiveness of these procedures is the primary limiting factor for their use in preclinical and clinical practices.
An alternative approach that has been successful in dosimetric evaluations is the use of computational models
coupled to radiation transport codes (Snyder, Ford, Warner, 1978; Petoussi-Henss, Zankl, 1998; Xu, Eckerman, 2009; ICRP, 2009). The pioneering mice computational models, namely mouse phantoms, emerged in the 90s. The work of Hui et al. (1994) is usually the irst model referenced. This group created a stylized phantom based on geometric shapes described by simple mathematical equations. Yoriyaz, Stabin (1997) developed another analytical phantom adopting a 30 g mouse as a reference.
data set. In this study, only the kidney, liver, and spleen organs were segmented. Hindorf, Ljungberg, Strand (2004) published a new voxel phantom including more
identiied and segmented organs. Their masses were based
on the mean values of ten dissected animals. It was an interesting approach from Hindorf´s work. On the other hand, although it was a voxel phantom, the anatomy was not segmented from images. Thus, the organs and
the animal itself were still deined as a set of simpliied
geometric shapes.
Segars et al. (2004) developed a 4D animal phantom called “Moby.” The model was based on high-resolution MRI of a C57BL/6 male mouse. Non-uniform rational B-spline surfaces (NURBS) were applied in Moby construction. This has allowed the modeling of internal organs motion due to heartbeat and breathing. The model was applied later in several mice dosimetry studies (Bretin et al., 2013; Taschereau, Chatziioannou, 2007; Larsson et al., 2007; Boutaleb et al., 2009; Keenan et al., 2010; Larsson et al., 2011; Mauxion et al., 2013; Xie, Zaidi, 2013; Lin et al., 2014).
Situ, Hoffman, Hartmann (2005) and Stabin et al. (2006) published voxel phantoms of mice with segmentation process based on MicroCT images. Bitar et al. (2007); Bitar, Lisbona, Bardiès (2007) implemented a mouse phantom of a female athymic “nude” strain. In this work, MicroCT or MicroMRI images were not used. The voxel model was constructed from high-resolution color images generated from 0.1 mm thickness coronal slices of the animal frozen body (Color Cryosections).
Stout et al. (2002) created and made available a set of co-registered images of MicroCT, PET, and Cryosections of a male nude mouse of 28 g (Stout et al., 2002; Dogdas et al., 2007). The project was called “Digimouse.” Three voxel phantoms were produced from Digimouse data set: Boutaleb et al. (2009), Mohammadi, Kinase (2011a, b) and Zhang et al. (2012). Mohammadi, Kinase (2011a)
presented Speciic Absorbed Fractions (SAF) for diverse
energies photons, using EGS4 Monte Carlo code. Several source and target organs were considered. These data allow validation studies of absorbed dose calculation protocols.
The aim of this study was to create a new voxel phantom from “Digimouse” project images to absorbed dose calculation for mice experiments conducted in our institutions. The model was prepared to run in MCNPx Monte Carlo code. The obtained phantom was called DM_BRA. The volume and mass of segmented organs were compared with those presented by Mohammadi, Kinase (2011a,b) and Zhang et al. (2012). Simulations
were performed using MCNPx for exempliication. The
heart was considered the source organ. Photons of diverse
energies were simulated, and SAF values obtained. The
data were compared with those published by Mohammadi, Kinase (2011).
MATERIAL AND METHODS
Model construction
A set of Micro-CT images of Digimouse project, kindly provided, was chosen for the segmentation process (Stout et al., 2002; Dogdas et al., 2007). It represents a male mouse (Mus musculus) of nude strain, weighing 28 g. The images composed a matrix of 380x992x208 elements of 0.1 mm3 voxel size. Forty-two coronal slices, normal to the plane z, spaced by 0.5 mm, were manually segmented. Corel Photopaint® was used for selecting and assigning a
speciic color for each organ/tissue. The computer used for
the segmentation process was a notebook with an Intel core i5® processor and 4 GB memory. The Atlas of Digimouse project was used to help perform the identification procedure.
ImageJ® software was applied to assemble the segmented images in a 3D stack. This software was also used to reduce the data set resolution from 380x992x208 to 152x396x42. The voxel dimensions resulting were 0.25x0.25x0.50 mm3. The set of images was converted to 8bits unassigned and saved in binary format (.raw).
A C++ program developed “in house” was used to
read and convert the binary ile to a voxel model template
format readable on SISCODES software (Trindade, Campos, 2011). The SISCODES software was employed
as an interface for generation of input iles for running in
MCNPx.
The tissue chemical compositions and densities (g/cm3) were based on human data, present in ICRP 110
(ICRP, 2009). The bone tissues were deined from values
given in ICRU (1989).
Monte Carlo simulations
MCNPx (v. 2.7.0) Monte Carlo code was adopted on simulations (Pelowitz, 2011). It was installed on a 120 core cluster at Laboratório de Nêutrons of the Instituto de Radioproteção e Dosimetria-IRD/CNEN. Similar to Mohammadi, Kinase (2011a), 0.015, 0.1, 0.5, 1 and 4 MeV source photons were considered in the simulations. The emissions have a uniform distribution inside the heart. The source organ was also set as target organ.
The absorbed dose in each voxel was calculated
with +F6. This tally returns the energy deposited per unit
requested for each target organ in the simulations. Values
of speciic absorbed fraction (SAF) for each target organ
were calculated from the average absorbed dose. The obtained values were compared with reference values (RV) published by Mohammadi, Kinase (2011a). The number of particle histories simulated (NPS) by MCNPx was set
suiciently high to ensure that the relative errors were less
than 5% in all organs.
3D view of absorbed dose and relative errors
The heart was set as source organ for 3D visualization of absorbed dose patterns and relative errors distribution. A C++ program was developed to extract each voxel absorbed
dose and relative error from MCNPx output iles. Binary iles “.raw” suitable for Amide® software were generated.
Two binary iles were obtained for each simulation: one
containing the 3D absorbed dose deposition pattern and another showing the relative errors distribution pattern. Each organ’s average absorbed dose and relative error
were also evaluated from output iles.
Statistic Evaluation
SAF values obtained through +F6 tally were
compared with the SAF values provided by Mohammadi,
Kinase (2011a). Hypothesis tests were performed to
determine whether the diferences between the averages could be considered statistically signiicant. The relative
errors were found to be 5% for Mohammadi, Kinase
(2011a) values. The signiicance level adopted was 0.01.
RESULTS
The DM_BRA voxel model
In this DM_BRA version, each organ was segmented as a uniform region. The distinction between wall and content for intestine, stomach, heart and bladder segmentations was not taken into account. The kidneys were not sectioned into regions either (i.e. cortex, medulla, and pelvis). The DM_BRA bones were segmented as a single structure, called skeleton. No distinction between cortical and trabecular bone (spongiosa) was made.
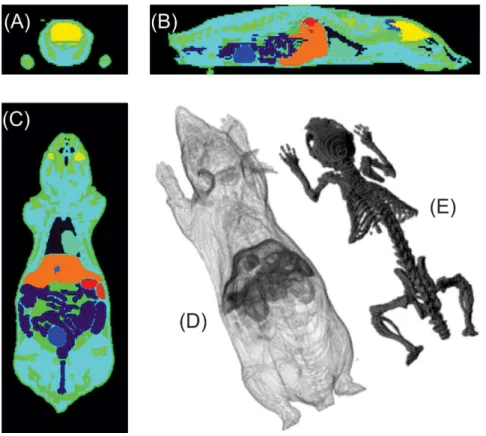
Figure 1 shows coronal (A), sagittal (B) and
transverse (C) slices of DM_BRA model. Amide® software was used to generate the images. The renderization
of the model (Fig.1D) and the skeleton (Fig.1E) were
also included. Specific colors were assigned for each segmented organ. Twenty-two organs/tissues were
FIGURE 1 - Graphical representations of DM_BRA model obtained through the AMIDE® software. Coronal (A) Sagittal (B) and
segmented: lung, intestine, eye, urinary bladder, brain, cerebellum, gall bladder, adrenal gland, Harderian glands, testis, muscle/soft tissue, adipose tissue, heart, spinal cord, skin, pancreas, bone, brown fat, kidney, liver, spleen, and stomach.
DM_BRA characteristics and data of main mice phantoms available in the literature are summarized in Table I, depicting the wide diversity of references elected by the researchers to set the chemical composition and density of the model´s tissues. On the other hand, a
TABLE I - Summary of DM_BRA mouse voxel model characteristics and comparison with the main phantoms available in the literature
Study Animal Weight (g)
Mouse Strain/
sex Voxel Dim. (mm
3) Matrix Segment.
Data
Phantom type
Tissue Composition
and Density
DM_BRAa 28 Nude/♂ 0.25 x 0.25 x 0.50 152 x 396 x 42 CT/Cryos voxel ICRP (2009)
Xie, Zaidi
(2013)a 21 - 35
d C57BL/6/♂ 0.20 x 0.20 x 0.20 200 x 200 x 512 MR voxel
-Mauxion et al.
(2013)b 30 C57BL/6/♂
0.625 x 0.625 x 0.625 0.20 x 0.20 x 0.20
42 x 160 x 41
- MR voxel
Cristy, Eckerman,
(1987) Zhang et al.
(2012)a 28 Nude/♂ 0.20 x 0.20 x 0.20 190 x 496 x 100 CT/Cryos voxel ICRU (1991)
Larsson et al.
(2011)b 22, 28, 34 C57BL/6/♂
0.22 x 0.22 x 0.22 0.23 x 0.23 x 0.23 0.25 x 0.25 x 0.25
160 x 160 x 432 MR voxel ICRP (1974)
Mohammadi,
Kinase (2011b)a 28 Nude/♂
0.10 x 0.10 x 0.10 0.40 x 0.40 x 0.40
380 x 992 x 208
95 x 248 x 52 CT/Cryos voxel
Cristy, Eckerman,
(1987) Keenan et al.
(2010)b 25, 30, 35 C57BL/6/♂ 0.625 x 0.625 x 0.625 - MR voxel
Cristy, Eckerman,
(1987) Boutaleb (2009)a 28 Nude/♂ 0.2 x 0.2 x 0.2 190 x 496 x 104 CT/Cryos voxel ICRU (1989)
Taschereau, Chatziioannou (2007)b
33 C57BL/6/♂ 0.40 x 0.40 x 0.40 80 x 80 x 270 MR voxel ICRU (1991)
Larsson et al.
(2007)b 33 C57BL/6/♂ 0.25 x 0.25 x 0.25 128 x 128 x 432 MR voxel ICRP (1974)
Bitar et al. (2007) 30 Nude/♀ 0.22 x 0.22 x 0.20 - Cryos voxel ICRU (1989) Stabin et al.
(2006) 27 Transgenic/♂ 0.20 x 0.20 x 0.20 256 x 256 x 256 CT voxel
-Segars et al.
(2004)b 33 C57BL/6/♂ variable Variable MR NURBS
-Hindorf, Ljungberg, Strand (2004)c
24 - 0.39 x 0.39 x 0.39 64 x 64 x 166 - voxel
Cristy, Eckerman,
(1987) Kolbert et al.
(2003) 25 Nude/♀ 0.10 x 0.10 x 0.12 256 x 256 x 256 MR voxel
-Yoriyaz, Stabin
(1997) - - - stylized
-Hui (1994)c 25 Nude/? - - - stylized
low number of mice strains were represented as voxel models: C57BL/6 and Nude. A phantom of a transgenic mouse was also built, but the strain was not mentioned. Phantoms of mice weighing 21 g to 35 g were built. The smallest voxel dimension was (0.1x0.1x0.1) mm3 and the largest (0.625x0.625x0.625) mm3. DM_BRA model presented an intermediary (0.25x 0.25x0.50) mm3 voxel size.
Organ´s masses for the DM_BRA model are shown in Table II. Other phantoms data from literature were also included. The voxel model total mass was 25.7g, a value 8% lower than expected since the animal originally weighed 28 g (Stout et al., 2002). Wide variation among organ masses was seen in Table II. Urinary bladder, pancreas, spleen, and stomach had the highest ratios between maximum and minimum masses: 19.8, 10.7, 9.8
and 6.3 respectively. The organ mass ratio was higher than two for the majority of the organs.
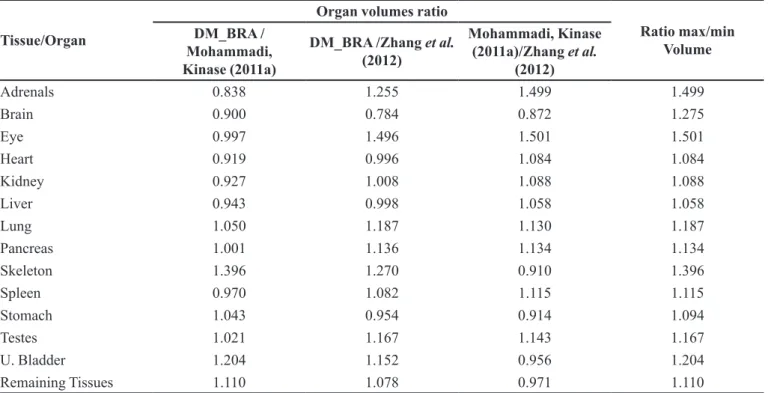
The DM_BRA organ masses generally showed good agreement with those models generated from the same data set (Digimouse®). The analysis of the organs
volumes is relevant to compare diferent segmentations
since it eliminates the influence of different tissues density assigned by the various authors. Table III shows the organ volumes ratio for common organs of the three
diferent Digimouse models. Also, the ratio between the
maximum and minimum volume for each segmented organ was presented. Despite the fact that one of the mouse models of Boutaleb et al. (2009) work was based on Digimouse Atlas, it was not included in the comparison because the total mass of the model was scaled to 27 g and 33 g.
TABLE II - Organ and tissue masses segmented on DM_BRA and other voxel models available in literature
Organ/Tissue
Organ/Tissue mass (g) described in each study
DM_BRAa
Mohammadi, Kinase (2011a)a
Zhang
et al.
(2012)a
Boutaleb (2009)a
Taschereau, Chatziioannou
(2007)b
Keenan
et al.
(2010)b
Mauxion
et al.
(2013)b
Bitar
et al.
(2007)
Hindorf, Ljungberg,
Strand (2004)c
Stabin
et al.
(2006)
Adip. Tissue 2.379 - - - 1.859 -
-Adrenals 0.005 0.006 0.004 - - - - 0.011 -
-Brainf 0.350 0.385 0.442 - 0.635 0.570 0.606 0.516 -
-Brown Fat 0.142 - - -
-Eye 0.006 0.006 0.004 - - -
-Gall Bladder 0.009 - - -
-Hard. Gland 0.032 0.032 - - -
-Heart 0.215 0.232 0.218 0.264 0.120e 0.290 0.283 0.282 0.120 0.143
Intestine 2.311 - - - 1.820 2.830 2.941 2.927 - 0.952
Kidney 0.482 0.515 0.478 0.586 0.415 0.370 0.379 0.377 0.280 0.334
Liver 1.987 2.087 2.010 2.373 2.690 2.150 2.177 1.831 0.890 0.780
Lung 0.167 0.124 0.096 0.121 0.130 0.110 0.098 0.123 0.150 0.125
Muscle/Soft 12.254 - 17.117 - - -
-Pancreas 0.047 0.047 0.041 - 0.440 0.380 0.390 0.090 -
-Skeleton 2.311 1.656 1.820 - 2.573 2.610 3.336 1.074 -
-Skin 2.228 - 3.841 - 6.910 - - - -
-Spinal Cord 0.099 0.048 - - - 0.112 0.190
-Spleen 0.140 0.144 0.132 0.164 0.130 0.140 0.137 0.216 0.090 0.022
Stomach 0.245 0.235 0.254 0.264 0.085d 0.069e 0.070e 0.438 - 0.298
Testes 0.159 0.156 0.136 1.76 0.400 0.200 0.188 - 0.250 0.141
Thyroid - - - - 0.015 0.020 0.017 0.005 0.020
-U. Bladder 0.238 0.197 0.205 - 0.045d 0.080 0.078 0.025 0.060 0.012
Total Body 25.7 23.4 26.9 27.0 32.8 29.8 30.2 30.7 24.0
Table III demonstrates that eyes and adrenal (small organs) segmentation resulted in the largest volumes
diferences among the models (~50%). Large organs or tissues such as skeletal and brain also exhibited signiicant
variations: 40% and 27% respectively. The other organs
showed maximum/minimum volume diferences equal or
less than 20%.
Monte Carlo simulations
Table IV shows the SAF values calculated using DM_BRA model adapted to MCNPx code. The SAF
graphics were included in Supplementary Information. The organs average absorbed doses were obtained
through +F6 tally and then converted into SAF. Values
obtained by Mohammadi, Kinase (2011a) were used as a reference.
The relative errors (RE) were kept below 5% for most organs in the simulations. Only the bladder and
adrenal SAF errors were greater than 5% (but less than
20%). The small size of adrenals makes it difficult to obtain low relative errors when they are relatively far from source organ. The bladder, despite being a medium-sized organ, is one of the most distant organs from heart. Despite this, only cases with 15 keV photons showed RE greater than 5%. The total simulation time varied among
the cases. The shorter simulation time was approximately 8 hours for 15 keV photons, and the greater was about 18 hours for 4 MeV photons. The main reasons for the high computational times were the evaluation of the absorbed dose per voxel and electron transport setup (mode p e and
+ F6 tally).
Diferences between MCNPx +F6 tally (Table IV) and Mohammadi, Kinase (2011a) SAF values were equal
or less than 10% for most cases/organs. The discrepancies
were not statistically signiicant for the heart, spleen,
pancreas, liver, kidneys, and adrenals, considering all simulated cases. Skeleton presented highest deviations:
20% to 33% underestimations. Stomach SAF values, on
the other hand, showed systematic overestimation. Lungs
show diferences statistically signiicant for low energy
photons (0.015 keV and 0.1 keV). Urinary bladder’s
SAF values were statistically diferent only for 15keV
photons.
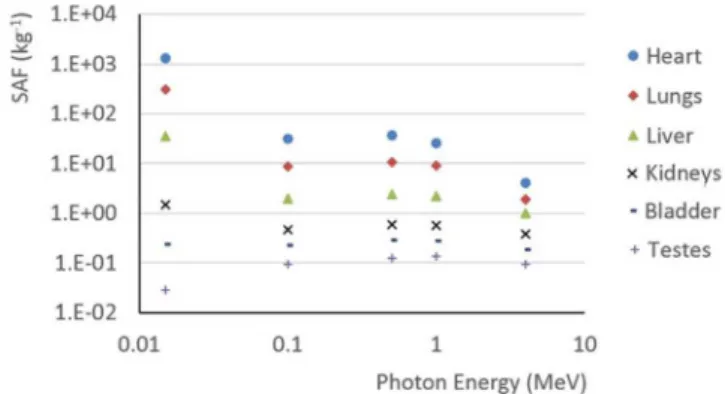
The graphic of Speciic Absorbed Fraction (SAF)
versus energy of emitted photons in the mouse heart for
some DM_BRA phantom organs can be seen in Figure
2. Note that a change in curve shape is observed as the distance between the source organ and the target organ increases, especially at low energy. The local minimum point at 100 keV does not exist for the bladder and testicles (the most distant organs).
TABLE III - Ratio between organ volumes of organs common to Digimouse images based models. Maximum and minimum volumes ratios were also presented
Tissue/Organ
Organ volumes ratio
Ratio max/min Volume DM_BRA /
Mohammadi, Kinase (2011a)
DM_BRA /Zhang et al.
(2012)
Mohammadi, Kinase (2011a)/Zhang et al.
(2012)
Adrenals 0.838 1.255 1.499 1.499
Brain 0.900 0.784 0.872 1.275
Eye 0.997 1.496 1.501 1.501
Heart 0.919 0.996 1.084 1.084
Kidney 0.927 1.008 1.088 1.088
Liver 0.943 0.998 1.058 1.058
Lung 1.050 1.187 1.130 1.187
Pancreas 1.001 1.136 1.134 1.134
Skeleton 1.396 1.270 0.910 1.396
Spleen 0.970 1.082 1.115 1.115
Stomach 1.043 0.954 0.914 1.094
Testes 1.021 1.167 1.143 1.167
U. Bladder 1.204 1.152 0.956 1.204
Spatial distributions of absorbed doses and relative errors
The absorbed dose values were normalized for
the maximum value obtained in the simulation. Figure
3 shows coronal slices exported from Amide® software. NIH table was used to set colors to each voxel according to the normalized absorbed dose. An image of the model was fused to the absorbed dose image to improve the visualization and the organ localization.
Target organs located farther from the source, such as the bladder, showed relative errors per voxel up to
100%, for lower energy photons with +F6 tally as it was shown in Figure 3. When considering the total organ
volume for absorbed dose sampling, relative errors were less than 5% for most organs, as previously mentioned.
Cases with 15 keV photons source showed that
higher absorbed dose values were observed in ribs and
sternum inner surfaces (Figure 4). Skeleton average
absorbed dose in these simulations were more than ten times lower than the heart, however, there are hot spots on
thorax bones with highest absorbed doses. Figure 4 also
shows that 100 keV photon deposited higher absorbed dose in rib cage bones than in the soft tissues near these
bones. Energy deposition pattern was not inluenced by
bone tissues in simulations with 500 keV or greater energy photons. In these cases hard tissue near the heart shows the same behavior than their adjacent soft tissues.
DISCUSSION
This version of DM_BRA presents the segmentation of the organs as homogeneous tissues, with few internal details. Human phantom evolution shows that TABLE IV - Speciic Absorbed Fraction (SAF) for diferent organs calculated using MCNPx +F6 tally. Comparison with reference
values published by Mohammadi, Kinase (2011a)
Photon Speciic Absorbed Fractions - SAF (1/kg) – Source Organ = Heart
Energy
(MeV) Study Skeleton Heart Bladder Stomach Spleen Pancreas Liver Kidneys Adrenal Lungs
0.015
Mohammadi,
Kinase (2011a) 6.8E+01 1.2E+03 1.9E-01 8.4E+00 2.8E+00 2.5E+00 3.8E+01 1.6E+00 4.8E+00 2.7E+02 DM_BRA 4.6E+01 1.3E+03 2.4E-01 1.1E+01 3.1E+00 2.9E+00 3.5E+01 1.5E+00 4.5E+00 3.1E+02
Ratio 0.67* 1.10 1.24* 1.33* 1.11 1.17 0.91 0.95 0.93 1.14*
0.1
Mohammadi,
Kinase (2011a) 1.7E+00 3.1E+01 2.3E-01 1.0E+00 6.1E-01 5.7E-01 2.0E+00 4.6E-01 7.8E-01 7.5E+00 DM_BRA 1.3E+00 3.1E+01 2.3E-01 1.3E+00 6.4E-01 6.3E-01 2.0E+00 4.8E-01 6.4E-01 8.5E+00
Ratio 0.76* 1.01 0.99 1.25* 1.05 1.10 0.98 1.03 0.82 1.14*
0.5
Mohammadi,
Kinase (2011a) 1.5E+00 3.6E+01 2.9E-01 1.3E+00 7.3E-01 6.9E-01 2.5E+00 5.9E-01 9.7E-01 9.5E+00 DM_BRA 1.1E+00 3.6E+01 2.9E-01 1,50E+00 8,1E-01 7.2E-01 2.4E+00 6.0E-01 9.8E-01 1.1E+01
Ratio 0.75* 1.00 1.00 1.15* 1.11 1.04 0.95 1.02 1.01 1.11
1
Mohammadi,
Kinase (2011a) 1.4E+00 2.7E+01 2.9E-01 1.2E+00 7.2E-01 6.7E-01 2.4E+00 5.6E-01 8.1E-01 8.3E+00 DM_BRA 1.0E+00 2.6E+01 2.8E-01 1.4E+00 7.9E-01 7.3E-01 2.2E+00 5.8E-01 8.3E-01 9.2E+00
Ratio 0.74* 0.96 0.95 1.17* 1.10 1.08 0.93 1.03 1.03 1.10
4
Mohammadi,
Kinase (2011a) 5.3E-01 4.4E+00 1.8E-01 7.7E-01 4.9E-01 4.9E-01 1.0E+00 3.9E-01 6.2E-01 1.8E+00 DM_BRA 4.3E-01 4.1E+00 1.9E-01 8.2E-01 5.1E-01 4.9E-01 9.8E-01 3.8E-01 6.8E-01 1.9E+00
Ratio 0.80* 0.94 1.03 1.07 1.05 1.01 0.98 0.99 1.10 1.03
Currently, ICRP reference phantoms (ICRP, 2009) present refined segmentation. Various organs show wall and content distinction at the ICRP phantoms. The assumption of segmentation of the distinct organ’s wall and its content, as well as the kidney sectioning, will provide a model representation closer to the real animal than only considering the organ as a uniform mass. However, the
magnitude of the diferences in simulations when either
approach is adopted was not demonstrated for mice yet.
Future DM_BRA versions will incorporate distinctions
between organ’s wall and its content as well as the kidneys sectioning in the marrow, cortex, and pelvis. As an example, DM_BRA bones were segmented as a single structure called skeleton. Optimal Bone marrow dosimetry for mice appears to be still a challenge. The chemical composition and density of the main bones or bones sets, as well as red bone marrow (RBM), yellow bone marrow FIGURE 2 - Graphic of Specific Absorbed Fractions versus
photon energy for some of DM_BRA organs. The photon source was positioned at the heart. The relative errors were below 5%.
FIGURE 3 - Coronal slices from Amide® software presenting the absorbed doses (left side) and relative errors (right side) distribution
pattern for 15 keV, 100 keV, 500 keV, 1 MeV or 4 MeV photon emitted at heart. The values were evaluated with +F6 tally. NPS
was set to 1E+06.
(YBM) and mineralized bone (bone mineral) percentages were established for humans (ICRP, 2002). These data do not exist or are not easily accessible for mice. ICRP 110 human reference phantoms present distinctions between cortical and trabecular region (spongiosa). Long bones also show medullary cavity and are divided into proximal and
distal regions (ICRP, 2009). For bone marrow absorbed
dose evaluation, the simple transposition of human data and calculation methods to murine models does not seem adequate. These procedures will drive the future work on DM_BRA phantom.
The wide diversity of references to set the chemical composition and density of the model´s tissues was
observed in Table I. Such occurrence makes it diicult for the intercomparison´s procedure. Furthermore, there
is no easy method to identify the best data from references that should be adopted, while a more modern set of data from human reference is not necessarily closer to mice values. The generation of reference values for chemical composition, density, and mass of mice organs shall be a good contribution to small animal dosimetry. Also, DM_
BRA whole body mass (25.7 g) was 8% lower than the expected (28 g). Mohammadi, Kinase (2011b) and Zhang et al. (2012) also reported models with smaller masses than the real: 23.4 g and 26.9 g respectively. Segmentation errors can be a cause of the mass differences. Another explanation may be the adopted tissue density. Zhang et al. (2012) corroborates this statement. Chemical composition and density data from human organs have been adopted in these three studies. It is possible that such practice may generate errors on computational absorbed dose calculations. Mass of mouse models found in literature ranged from 21 to 35 grams. Much of the mice used in ionizing radiation experiments are within this weight. However, they were based only on segmentations of a few animals (Hindorf, Ljungberg, Strand, 2004; Kolbert et al., 2003; Stabin et al., 2006; Stout et al., 2002; Bitar et al., 2007; Segars et al., 2004). Indeed, a large group of mouse models, including DM_BRA, were based on images of only two animals: the Digimouse project data (Nude-male) or phantom Moby (C57BL/6-male). Indeed, the existing mouse phantoms show low representativeness regarding FIGURE 4 - Transversal and coronal slices of absorbed doses distribution pattern fused with model representation image. The
maximum absorbed doses per emitted particle were spotted on ribs inner surfaces for a 15 keV photons at heart source. For 100 keV
the morphological diversity of strains used in ionizing radiation experiments. Some important strains (BALB/c, SCID, Swiss, etc.) have not been segmented until now.
Table II shows a large diference between maximum and minimum organ masses. For most organs, it was higher
than 100%. The following factors may have contributed to the observed discrepancies: i) organ condition at the image
acquisition (e.g. bladder - full or empty); ii) diferences in organ assigned material (e.g. stomach - illed with air in some cases); iii) diferent densities assigned to the same
tissue (e.g. lung - 0.26 to 0.38 g/cm3); iv) distinct model
voxels dimensions (especially afects small organs such as
the thyroid and adrenal); v) subjectivity and errors during segmentation; and vi) the inherent variability of organ
mass of diferent mice strains.
Tally +F6 SAF values agreed with Mohammadi,
Kinase (2011a) results for most organs and photon energies. Main deviations were observed for the skeleton, stomach, and lungs. DM_BRA skeleton mass is 40% higher than Mohammadi, Kinase (2011a) model one.
It is possible that this mass variation explains the SAF
underestimations observed for this organ. The ratio between lung volumes of these models is only 1.05. Thus the adoption of different lung densities for the models
should have led to DM_BRA SAF value overestimation.
DM_BRA has a lung density of 0.382 g/cm3 while Mohammadi, Kinase (2011a) model adopted 0.296 g/ cm3. That makes DM_BRA lung mass ~36% larger than Kinase’s model. Stomach´s mass presents little variation
between the two models (4%). Possibly, diferences in
organ shape and distance from the source can explain deviations observed for this organ. On the other hand,
adrenals and urinary bladder show substantial diferences
between the models referring to organ mass and volume. However, statistically significant differences were not
observed in SAF values calculated for these organs. The exception is bladder’s SAF for 15keV photons. The most important restriction to +F6 tally utilization was the high
computational time required for calculations.
The 3D view of the absorbed dose deposition patterns complements the information addressed by the
absorbed dose average at organs. We show in this work
that 15 keV photons emitted on the heart produce hot spots of absorbed dose in ribs and sternum inner surfaces. Dosimetry restricted only to average absorbed doses
evaluation does not allow the identiication of particular
situations as the one described. Relative error distribution visualization shows that even for small models, such as mice, the uncertainties grow very large for organs located far from the source. Since the target organ with the highest relative error determines the NPS needed to maintain
ER lower than the deined threshold. When the highest
relative error organ reaches the acceptable error level (e.g. 5%), organs closer to the source generally have RE lower than 1%. Variance reduction methods can enhance errors distribution. Application of such techniques can greatly reduce the computational time maintaining the results reliability.
CONCLUSIONS
DM_BRA mouse voxel model was developed holding all suitable features of a mice phantom model.
The SAF data in most simulated cases were statistically
equal to those present in Mohammadi, Kinase (2011a), which provide a validation to the DM_BRA The current
coniguration allows absorbed dose evaluations on multiple
radioactive procedures involving radiopharmaceutical uses. The models created up to date are from a few mice image datasets. Thus, it exhibits low representativeness regarding mice morphological diversity. Studies should be conducted to determine intra-strain morphological variability. If low variability is observed for individuals with similar characteristics (age, sex, strain), the
construction of speciic reference mice phantoms could be justiied (Mauxion et al., 2013).
The visualization of absorbed dose spatial distribution brought improvements in the dosimetric analysis, complementing the information of the organ average absorbed dose. High absorbed dose spots in
organs/tissues regions could be identiied quantiied and correlated with possible deterministic biological efects.
Similarly, the depicting of relative errors per voxel can be useful in the evaluation of the variance reduction
techniques efectiveness. In future studies, better patterns
of errors distributions should be pursued.
ACKNOWLEDGMENTS
We would like to thank Dr. David Stout and
Digimouse® project of the University of Southern California for having kindly provided the mouse images.
We also thank the Laboratório de Metrologia de Nêutrons
of the Instituto de Radioproteção e Dosimetria (IRD/ CNEN) for consenting the use of high-performance cluster for the calculations. This research project is supported by the following Brazilian institutions: Departamento
de Engenharia Nuclear (DEN) of Universidade Federal de Minas Gerais (UFMG), Centro de Desenvolvimento
da Tecnologia Nuclear (CDTN), Comissão Nacional de
Conselho Nacional de Desenvolvimento Científico e Tecnológico (CNPq-REBRAT-SUS).
REFERENCES
BOUTALEB, S.; POUGET, J.-P.; HINDORF, C.; PÈLEGRIN, A.; BARBET, J.; KOTZKI, P.-O.; BARDIÈS, M. Impact of mouse model on preclinical dosimetry in targeted
radionuclide therapy. Proc. IEEE, v.97, p.2076-2085, 2009.
BITAR, A.; LISBONA, A.; THEDREZ, P.; SAI MAUREL,
C.; LE FORESTIER, D.; BARBET, J.; BARDIÈS, M.
A voxel-based mouse for internal dose calculations using
Monte Carlo simulations (MCNP). Phys. Med. Biol., v.52,
p.1013-1025, 2007.
BITAR, A.; LISBONA, A.; BARDIÈS, M. S-factor
calculations for mouse models using Monte-Carlo
simulations. Q. J. Nucl. Med. Mol. Imaging, v.51, n.4,
p.343-351, 2007.
BRETIN, F.; MAUXION, T.; BAHRI, M.A.; LUXEN, A.; PLENEVAUX, A.; BARDIÈS, M.; SERET,
A. Absorbed doses to mice for three [18F]-tracers calculated from experimental kinetic data and Monte Carlo simulations. 2013. Available from: http://orbi.ulg.ac.be/ bitstream/2268/156160/1/EANM13_PosterAbstract.pdf. Access on: Aug. 18, 2015.
CARLSON, S.K.; CLASSIC, K.L.; BENDER, C.E.; RUSSEL, S.J. Small animal absorbed radiation dose from serial
micro-computed tomography imaging. Mol. Imaging Biol., v.9,
p.78-82, 2007.
CRISTY, M.; ECKERMAN, K.F. Speciic absorbed fractions
of energy at various ages from internal photon sources. I. Methods. Oak Ridge: Oak Ridge National Laboratory, 1987. 100 p.
DOGDAS, B.; STOUT, D.; CHATZIIOANNOU, A.; LEAHY, R.M. Digimouse: A 3D whole body mouse atlas from CT
and cryosection data. Phys. Med. Biol., v.52, p.577-587,
2007.
FLYNN, A.A.; GREEN, A.J.; PEDLEY, R.B.; BOXER,
G.M.; BODEN, R.; BEGENT, R.H.J. A mouse model for
calculating the absorbed beta-particle dose from 131I- and
90Y-labeled immunoconjugates, including a method for
dealing with heterogeneity in kidney and tumor. Radiat.
Res., v.156, p.28-35, 2001.
HINDORF, C.; LJUNGBERG, M.; STRAND, S.E. Evaluation
of parameters inluencing S values in mouse dosimetry. J. Nucl. Med., v.45, p.1960-1965, 2004.
HUI, T.E.; FISHER, D.R.; KUHN, J.A.; WILLIAMS, L.E.; NOURIGAT, C.; HUTCHINSON, F.; BADGER, C.C. A mouse model for calculating cross-organ beta doses from
yttrium-90-labeled immunoconjugates. Cancer, v.73, n.3,
suppl., p.951-957, 1994.
INTERNATIONAL COMISSION ON RADIOLOGICAL
PROTECTION. ICRP. Report of the task group on reference
man. Oxford: Pergamon Press, 1974. (ICRP Publication,
23).
INTERNATIONAL COMISSION ON RADIOLOGICAL
PROTECTION. ICRP. Basic anatomical and physiological
data for use in radiological protection: reference values. Oxford: Pergamon Press, 2002. (ICRP Publication, 89).
INTERNATIONAL COMISSION ON RADIOLOGICAL
PROTECTION. ICRP. Adult reference computational
phantoms. Oxford: Pergamon Press, 2009. (ICRP Publication, 110).
INTERNATIONAL COMISSION ON RADIATION UNITS
& MEASUREMENTS. ICRU. Tissue substitutes in
radiation dosimetry and measurement (Report 44). Bethesda: International Commission on Radiation Units & Measurements, 1989.
INTERNATIONAL COMISSION ON RADIATION UNITS
& MEASUREMENTS. ICRU. Photon, electron, proton,
and neutron interaction data for body tissues (Report 46). Bethesda: International Commission on Radiation Units & Measurements, 1991.
KEENAN, M.A.; STABIN, M.G.; SEGARS, W.P.; FERNALD, M.J. RADAR realistic animal model series for
dose assessment. J. Nucl. Med., v.51, n.3, p.471-476, 2010.
KOLBERT, K.S.; WATSON, T.; MATEI, C.; XU, S.;
KOUTCHER, J.A.; SGOUROS, G. Murine S factors for
liver, spleen, and kidney. J. Nucl. Med., v.44, n.5,
p.784-791, 2003.
L A R S S O N , E .; L J U N G B E R G , M .; S T R A N D , S . E .; JÖNSSON, B.A. Monte Carlo calculations of absorbed
doses in tumors using a modiied MOBY mouse phantom
for pre-clinical dosimetry studies. Acta Oncol., v.50, n.6,
L A R S S O N , E .; S T R A N D , S . E .; L J U N G B E R G , M .; JÖNSSON, B.A. Mouse S-factors based on Monte Carlo simulations in the anatomical realistic moby phantom for
internal dosimetry. Cancer Biother. Radio, v.22, n.3,
p.38-442, 2007.
LIN, H.H.; CHUANG, K.S.; LIN, Y.H.; NI, Y.C.; WU, J.;
JAN, M.L. Eicient simulation of voxelized phantom in
GATE with embedded SimSET multiple photon history
generator. Phys. Med. Biol., v.59, p.6231-6250, 2014.
MAUXION, T.; BARBET, J.; SUHARD, J.; POUGET, J.P.;
POIROT, M.; BARDIÈS, M. Improved realism of hybrid
mouse models may not be suicient to generate reference
dosimetric data. Med. Phys., v.40, n.5, p.1-13, 2013.
MOHAMMADI, A.; KINASE, S. Monte Carlo simulations of photon specific absorbed fractions in a mouse voxel
phantom. Prog. Nucl. Sci. Technol., v.1, p.126-129, 2011a.
MOHAMMADI, A.; KINASE, S. Inluence of voxel size on
speciic absorbed fractions and S-values in a mouse voxel
phantom. Radiat. Prot. Dosim., v.143, n.2/4, p.258-263,
2011b.
PELOWITZ, D.B.MCNPx user’s manual. Version 2.7.0. Los Alamos, USA, 2011. p.645.
PETOUSSI-HENSS, N.; ZANKL, M. Voxel anthropomorphic
models as a tool for internal dosimetry. Radiat. Prot.
Dosim., v.79, n.1/4, p.415-418, 1998.
SEGARS, W.P.; TSUI, B.M.W.; FREY, E.C.; JOHNSON,
G.A.; BERR, S.S. Development of a 4D digital mouse
phantom for molecular imaging research. Mol. Imaging
Biol., v.6, p.149-159, 2004.
SITU, P.D.; HOFFMAN, T.J.; HARTMANN, S.C.L. Voxel based absorbed fractions in mouse digestive organs for
therapeutic beta emitters. J. Nucl. Med., v.46, n.2, Suppl.,
p.2278, 2005.
SNYDER, W.S.; FORD, M.R.; WARNER, G.G. Estimates of speciic absorbed fractions for photons sources uniformly distributed in various organs of a heterogeneous phantom. Oak Ridge: Ridge National Laboratory, 1978. 67p. (MIRD Pamphlet n.5). Revised). Available from: http://interactive. snm.org/docs/MIRD%20Pamphlet%205.pdf. Access on: Jan. 20, 2016.
STABIN, M.G.; PETERSON, T.E.; HOLBURN, G.E.; EMMONS, M.A. Voxel-based mouse and rat models for
internal dose calculations. J. Nucl. Med., v.47, n.4,
p.655-659, 2006.
STOUT, D.; CHOW, P.; SILVERMAN, R.; LEAHY, R.M.;
LEWIS, X.; GAMBHIR, S.; CHATZIIOANNOU, A.
Creating a whole body digital mouse atlas with PET, CT
and cryosection images. Mol. Imaging Biol., v.4, n.4, p.S27,
2002.
TASCHEREAU, R.; CHATZIIOANNOU, A.F. Monte Carlo simulations of absorbed dose in a mouse phantom from
18-fluorine compounds. Med. Phys., v.34, n.3,
p.1026-1036, 2007.
TRINDADE, B.M.; CAMPOS, T.P.R. Sistema computacional para dosimetria de nêutrons e fótons baseado em métodos
estocásticos aplicado a radioterapia e radiologia. Radiol.
Braz., v.44, n.2, p.109-116, 2011.
WANG, G.J.; CAI, L. Induction of cell-proliferation hormesis and cell-survival adaptive response in mouse hematopoietic
cells by whole-body low-dose radiation. Toxicol. Sci., v.53,
p.369-376, 2000.
XIE, T.; ZAIDI, H. Monte Carlo-based evaluation of S-values
in mouse models for positron-emitting radionuclides. Phys.
Med. Biol., v.58, p.169-182, 2013.
XU, G.X.; ECKERMAN, K.F. Handbook of anatomical models for radiation dosimetry. Boca Raton: CRC Press, 2009. 757p.
YONEZAWA, M. Induction of radio-resistance by low dose
X-irradiation. Yakugaku Zasshi, v.126, n.10, p.833-840,
2006.
YORIYAZ, H.; STABIN, M. Electron and photon transport
in a model of a 30 g mouse. J. Nucl. Med., v.38, Suppl.,
p.228, 1997.
ZHANG, X; XIE, X; CHENG, J; NING, J; YUAN, Y; PAN, J;
YANG, G. Organ dose conversion coeicients based on a
voxel mouse model and MCNP code for external photon
irradiation. Radiat. Prot. Dosim., v.148, n.1, p.9-19, 2012.
Received for publication on 13rd May 2016