http://dx.doi.org/10.1590/s2175-97902017000215250
A
r
*Correspondence: P. C. Ferrari. Departamento de Ciências Farmacêuticas. Universidade Estadual de Ponta Grossa. Av. General Carlos Cavalcanti, 4748 – Uvaranas - 84030-900 - Ponta Grossa, PR, Brazil. Phone: 55-42-3220 3122. E-mail: [email protected] / [email protected]
A simple HPLC method for the determination of halcinonide in lipid
nanoparticles: development, validation, encapsulation efficiency,
and
in vitro
drug permeation
Clarissa Elize Lopes, Gisele Langoski, Traudi Klein, Priscileila Colerato Ferrari
*,
Paulo Vitor Farago
Department of Pharmaceutical Sciences, State University of Ponta Grossa, Ponta Grossa, Paraná, Brazil
Halcinonide is a high-potency topical glucocorticoid used for skin inlammation treatments that presents toxic systemic efects. A simple and quick analytical method to quantify the amount of halcinonide encapsulated into lipid nanoparticles, such as polymeric lipid-core nanoparticles and solid lipid nanoparticles, was developed and validated regarding the drug’s encapsulation eiciency and in vitro permeation. The development and validation of the analytical method were carried out using the high performance liquid chromatography with the UV detection at 239 nm. The validation parameters were speciicity, linearity, precision and accuracy, limits of detection and quantitation, and robustness. The method presented an isocratic low rate of 1.0 mL.min-1, a mobile phase methanol:water (85:15 v/v), and a
retention time of 4.21 min. The method was validated according to international and national regulations. The halcinonide encapsulation eiciency in nanoparticles was greater than 99% and the in vitro drug permeation study showed that less than 9% of the drug permeated through the membrane, indicating a nanoparticle reservoir efect, which can reduce the halcinonide’s toxic systemic efects. These studies demonstrated the applicability of the developed and validated analytical method to quantify halcinonide in lipid nanoparticles.
Uniterms: Halcinonide/encapsulation eiciency. Halcinonide/quantiication. Polymeric lipid-core nanoparticles. Solid lipid nanoparticles. Topical administration. Toxicity. High performance liquid chromatography/method validation.
INTRODUCTION
Topical corticosteroids or glucocorticoids are widely employed in dermatosis treatments due to their potent anti-inlammatory and anti-proliferative efects (Hengee et al., 2006; Guichard et al., 2015). However, the use of topical glucocorticoids can result in several local and adverse systemic efects, such as epidermis, dermis, or even subcutaneous tissue atrophy, resulting in irreversible stretch marks and in disorder of the wound-healing processes. Adverse systemic efects include body weight increase, Cushing’s syndrome, hypertension, diabetes mellitus, growth retardation, osteoporosis, peptic ulcer, and gastritis (Schacke, Docke, Asadullah, 2002; Senyigit, Ozer, 2012).
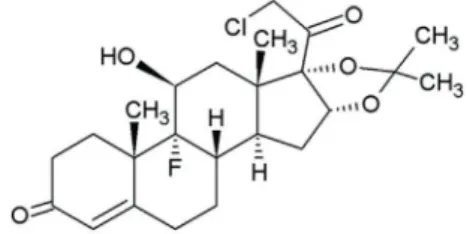
Halcinonide (C24H32ClFO5; MW: 454.96 Da) or (11β,16α)-21-chloro-9-fluoro-11-hydroxy-16, 17-[(1-methylethylidene)bis(oxy)]pregn-4-ene-3, 2 0 - d i o n e ( F i g u r e 1 ) i s a h i g h - p o t e n c y t o p i c a l corticosteroid, which is a hydrocortisone derivative and whose modifications alter its absorption, potency, and adverse effects. Halcinonide is classified as a Class II potency corticosteroid (Taheri, Feldman, 2012), whose characteristics include being a white crystalline powder, soluble in acetone and in chloroform, slightly soluble
in alcohol and in ethyl ether, insoluble in water and in hexanes.
Halcinonide is administered by topical via. However, due to its high potency, it displays dose-dependent toxicity and local and systemic adverse efects. In order to reduce the drug toxicity and to improve its action, halcinonide can be encapsulated into nanostructured systems, such as nanoparticles, which promote a controlled release of the drug in speciic sites (Schafazick, Guterres, 2003; Senyigit, Ozer, 2012). Nanostructured systems, such as nanoparticles, are submicron size ranged-usually spherical-drug carriers. Lipid nanoparticles are widely used to carry lipophilic drugs and they are constituted by biocompatible and non-toxic lipids and may to be associated with polymers (Kelidari et al., 2015). They present advantages in the drug delivery control, such as good local tolerability, high encapsulation rate for lipophilic substances, and small particle size, which provide close contact with the stratum corneum. Moreover, they can create a film on the skin surface (Maia et al., 2000).
In order to reduce the halcinonide toxicity in topical use, lipid nanoparticles, such as solid lipid nanoparticles (SLN) and polymeric lipid-core nanoparticles (LCN), were developed. SLNs are a colloidal carrier system for targeting drugs and are appropriate for use in cases of inflamed and damaged skin. They can favor drug penetration in the skin, maintaining a sustained release to avoid systemic absorption. They also reduce skin irritation due to their skin-targeting efect (Chen et al., 2006; Madan et al., 2014; Shah et al., 2015). LCNs are nanostructured devices in which a polymer wall surrounds the lipid core. They can stabilize the encapsulated substances and control the release of the drug to improve its efectiveness, acting as reservoir systems at the epidermis, and retaining themselves at the outermost layers of the skin (Jäger et al., 2007; Venturini et al., 2011; Coradini et al., 2014; Fiel et al., 2014; Brum et al., 2015).
The literature reports just one high performance liquid chromatography (HPLC) method that determines halcinonide from diferent sample types (Kirschbaum et al., 1980). However, no study involving the quantiication of halcinonide entrapped in lipid nanoparticles was submitted for the mandatory validation process. We developed and validated a simple, sensitive, and specific HPLC-UV method to determine the presence of halcinonide in lipid nanoparticles. Subsequently, this validated method was successfully used to quantify the amount of halcinonide encapsulated in these lipid nanostructured systems and to evaluate the in vitro drug permeation.
MATERIAL AND METHODS
Chemicals and reagents
Halcinonide 99,2% (Fagron, Anápolis, GO, Brazil), poly(ε-caprolactone) (Mw =10000-14000 g/mol, Sigma-Aldrich, St. Louis, MO, USA), Span 60® (sorbitan
stearate; Sigma Aldrich,St. Louis, MO, USA), Tween 80® (polysorbate 80; Deleware, Porto Alegre, Brazil),
capric/caprylic acid triglycerides (Focus Química, São Paulo, Brazil), stearic acid (Fagron, Anápolis, GO, Brazil) and acetone (Vetec, Rio de Janeiro, Brazil) were used to prepare the solid lipid nanoparticles (SLN) and polymeric lipid-core nanoparticles (LCN). HPLC-grade methanol was provided by Sigma-Aldrich (St. Louis, MO, USA). Water was puriied in a Milli-Q Plus water puriication system (Millipore, Bedford, MA, USA). All other reagents and solvents were of analytical grade.
Apparatus and chromatographic conditions
A Merck-Hitachi Lachrom HPLC (Tokyo, Japan) system, equipped with a D-7000 Interface, an L-7400 UV detector module, a L-7100 quaternary pump, and an integral degasser, was used in the method development. A manual injector (Rheodyne) system, equipped with a 20-μL injector loop and a 100-μL syringe (Hamilton, Microliter 710), was used. Data acquisition, analysis, and reporting were performed using ChromQuest 5.0 (Thermo Fisher Scientiic, San Jose, CA, USA).
Experiments were performed in the HPLC system described above using a GL Sciences C18 Inertsil® ODS3
column (Torrance, CA, USA) of a 5-µm particle size, 4.6-mm internal diameter, and 150-mm length and a GL Sciences C18 Inertsil® ODS3 guard cartridge system (10 mm×4 mm, 5 μm) at 25±2 °C. The mobile phase, previously iltrated using a 0.45-µm PTFE membrane and degassed by sonication for 30 min, consisted of methanol and water (85:15 v/v) at an isocratic low rate of 1.0 mL.min-1.The
sample injection volume was of 20 µL. The halcinonide was monitored at 239 nm. The method run time was of 10 minutes and all experiments were carried out in triplicate.
Sample, standard solution, and system suitability preparation
Halcinonide-loaded LCNs (LCN-HAL; 3.0 mg.mL-1) were prepared with the interfacial deposition
dissolved in acetone at 40 °C and injected into an aqueous phase containing Tween 80 under magnetic stirring. The suspension was submitted to vacuum and to acetone evaporation. All formulations were obtained in triplicate. Unloaded-LCN was also prepared as a negative control.
Halcinonide-loaded SLNs (SLN-HAL; 3.0 mg.mL-1)
were obtained by hot homogenization. A lipid phase, constituted by stearic acid and halcinonide, was heated at 70 °C. The aqueous phase, containing Tween 80, was heated at the same temperature and was added to the melted lipid under stirring. The emulsion was kept in the high shear homogenizer Ultra Turrax at 18,000 rpm for 10 min. Then, the nanoemulsion was immediately dispersed into cold distilled water (2–5 °C) stirred for 1 minute at 3,400 rpm to solidify the nanoparticles (Ghadiri et al., 2012). All solid lipid nanoparticles were obtained in triplicate and the unloaded-SLN was also prepared as a negative control.
Method development
The detection wavelength for the HPLC study was set at 239 nm after a spectrometric scanning. The chromatographic conditions were optimized for the halcinonide peak’s resolution, varying the mobile phase’s composition and proportion. Samples of diferent formulations were used to optimize the chromatographic conditions to resolve the halcinonide. These samples were iltered with a polytetraluoroethylene (PTFE) membrane filter (Cromafil® Xtra, 0.45 μm × 25 mm,
Macherey-Nagel, Düren, Germany) before their injection into the HPLC system. An appropriate blank was injected before the analysis of every sample. The method was validated and used to determine halcinonide in the LCN and SLN nanoparticles, and to evaluate the in vitro drug permeation.
Method validation
To validate the analytical method, the guidelines established by the ICH, International Conference on the Harmonization of Technical Requirements for the Registration of Pharmaceuticals for Human Use (2005) and the Brazilian regulation (ANVISA, 2003) were employed (Gomes et al., 2015; Klein, Longhini, Mello, 2012). The method was validated for speciicity, linearity, limit of detection (LOD), limit of quantitation (LOQ), accuracy, precision, and robustness.
Specificity
The specificity was determined by analyzing the chromatograms of unloaded nanoparticles in comparison with those obtained for both halcinonide-containing
formulation nanoparticles (LCN-HAL and SLN-HAL), expecting the confirmation of no interference in the retention time and in the drug quantification due to formulation constituents (Gomes et al., 2015).
The nanoparticles were added in the mobile phase and kept under magnetic stirring during 24 h. Samples was assayed in the supernatant after a suitable dilution and iltration through a 0.45-µm PTFE membrane and injected into the HPLC system.
Linearity
The linearity was determined by the calculation of a regression line from the peak area’s plot versus the concentration of the working standard solutions prepared at ive concentration levels (10.0; 15.0; 20.0; 30.0 and 40.0 μg.mL-1) and it was evaluated by the
least-square regression analysis. A stock standard solution (500 μg.mL-1) was prepared daily by dissolving 5.0 mg
of halcinonide in a 10-mL volumetric flask using the mobile phase (metanol:water 85:15, v/v). This solution was further diluted in the mobile phase to prepare the ive diferent working standard solutions (ranging from 10 to 40 μg.mL-1). The solutions were injected in the
HPLC column in triplicate, keeping the injection volume constant (20 µL) and chromatograms were recorded. The standard deviation value for the slope, �-intercept, and other statistics of the calibration curve were calculated by linear regression and analysis of variance (ANOVA).
Limit of detection and limit of quantification
The limit of detection (LOD) and limit of quantification (LOQ) were calculated based on the standard deviation (SD) and on the slope (S) of the calibration curve according to the ICH (2005) and Fuster et al. (2015) by 3.3 SD/S and 10 DS/S to LOD and to LOQ respectively.
Precision
The precision of the method was determined following the ICH requirements. It was evaluated at three levels: repeatability, intermediate precision, and reproducibility. The repeatability was investigated by testing six sample solutions at 25 μg.mL-1, evaluated
in other two different days (reproducibility) and also prepared by two operators (intermediate precision). All analyzes were performed in sextuplicate. The results were reported in terms of relative standard deviation (RSD).
Accuracy
at different levels: low, intermediate, and high (17.5; 25.0 and 35.0 μg.mL-1, respectively). To determine the
recovery known concentration of the stock solution, it was prepared to achieve the final and theoretical drug concentrations. The accuracy value was determined by calculating the percent of halcinonide recovery for these three concentration levels and then determining the RSD (Klein, Longhini, Mello, 2012; Gomes et al., 2015).
Recovery
The recovery was determined in triplicate by the preparation of a halcinonide solution of 200 µg.mL-1,
followed by the addition of a new halcinonide solution (500 µg.mL-1), obtaining a final concentration of 700
µg.mL-1. The samples were diluted into 25 µg.mL-1 and
the results were evaluated by the RSD.
Robustness
In order to determine the robustness, experimental conditions were deliberately changed to verify the method’s reproducibility. It was evaluated by analyzing a halcinonide solution at a 25-μg.mL-1 varying low rate
(0.995 and 1.005 mL.min-1) and the composition of the
mobile phase methanol:water (84:16 and 86:14 v/v). The samples were evaluated in triplicate for each variation. The chromatograms were recorded and compared with the previously reported chromatographic conditions.
Evaluation of encapsulation efficiency
To assess the halcinonide’s encapsulation eiciency (EE) in lipid nanoparticles, 500 µl of samples were iltered using an Amicon® Ultra-0.5 mL 10 kDa filter device
and centrifuged for 30 min at 40,000 rpm, according to Vijayakumar et al. (2016) and Zhang et al. (2016). The encapsulation eiciency was determined after the reading of the iltered samples in the HPLC, performed in triplicate and calculated using the equation (1):
In vitro drug permeation
In order to demonstrate the applicability of the validated method and the controlled drug delivery, the in vitro drug permeation of free halcinonide and of halcinonide encapsulated into LCN and SLN were evaluated. The skin permeation study was conducted
in vertical difusion cells, with a receiver compartment containing 12 ml and an available area of 1.77 cm2.
Strat® M (Merck Millipore) synthetic membranes were
used in the study due to their high similarity to human skin. The samples were individually incorporated into a 0.5% Natrosol gel to increase the nanosuspension’s viscosity, keeping the drug concentration at 0.1 % in all samples. The membrane was placed between the donor and receiver compartment of the vertical difusion cells. 1.0 g of sample-containing gel was added into the donor compartment and the system was kept under constant agitation at 37 °C. Considering the lipophilic nature of the sample, the receiver compartment was filled with isopropyl alcohol, ensuring the sink condition. Aliquots of 3.0 mL were withdrawn from the receiver luid at 1, 2, 4, 6, 8, 12, and 24 hours and the volume was replenished. The cumulative drug that permeated was quantiied using the developed and validated HPLC analytical method. The study was performed in triplicate.
RESULTS AND DISCUSSION
Method development and validation
Previous tests were carried out in order to provide a quick and efective method to analyze halcinonide using the HPLC. The investigated chromatographic conditions were mainly related to the mobile phase composition. Initial runs included 60-minute exploratory runs using a mixture of methanol and water as a mobile phase, varying the proportion of methanol from % to 95%.
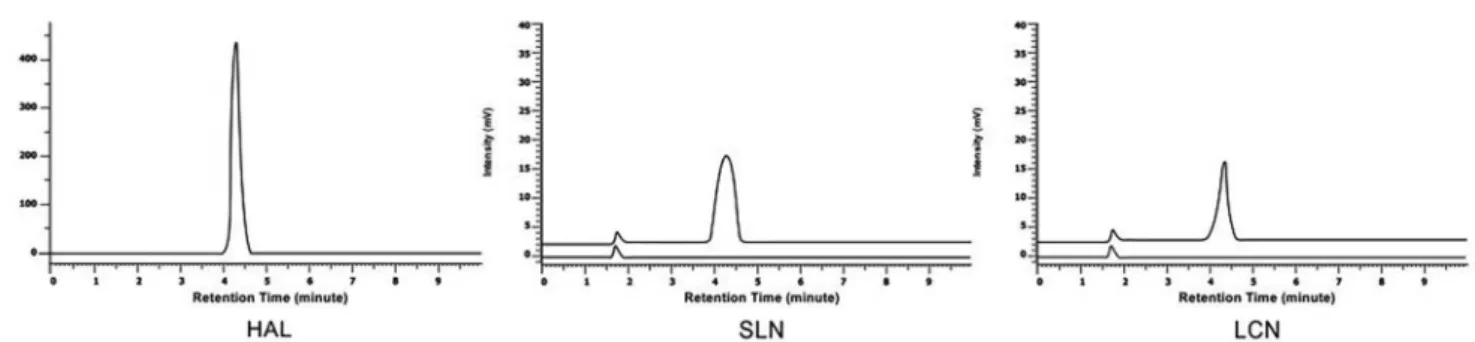
The mobile phase, composed by methanol:water 85:15 (v/v), provided a symmetric peak for halcinonide with low retention time. The peak was detected at 4.21 min (Figure 2), which is very suitable for routine analyses. In summary, methanol:water (85:15 v/v), a column temperature at 25 ± 2 °C, a sample injection volume of 20 µL, an isocratic low rate of 1.0 mL.min-1, a detector
set at 239 nm, and a run time of 10 minutes were chosen as suitable chromatographic conditions for further procedures, including the method validation.
The developed method proved itself specific for halcinonide quantiication from LCN and SLN (Figure 2), i.e. the peak related to the drug (tR = 4.21 min) did not appear in the inert nanoparticles, indicating no interference due to nanoparticle constituents in the halcinonide quantiication.
A linear relationship between the peak area and the halcinonide concentration from 10.0 to 40.0 �g.mL-1
where y is the peak area and x is concentration at μg.mL-1. A suitable correlation coeicient (r=0.9994)
that demonstrates that the method is linear with an r value of nearly 1.0 at the purposed range was recorded. According to the Analytical Methods Committee (AMC), a regression coeicient value near to 1.0 is not necessarily the outcome of a linear relationship and, consequently, the lack-of-fit test should be applied. This test evaluates the variance of the residual values. The ANOVA test to evaluate halcinonide linearity is presented in Table I. The F value for lack of it was less than the tabulated F value for the 95% conidence level (α=0.05), and therefore, according to the ANOVA test, the linear regression showed no lack of it (Gomes et al., 2015; Klein, Longhini, Mello, 2012).
The lowest halcinonide concentration detected (LOD) and quantiied (LOQ) with acceptable precision and accuracy was 0.04 and 0.14 μg.mL-1, respectively.
These results prove that the chromatographic method is suitable enough to detect and quantify halcinonide at a concentration range of 10.0 to 40.0 µg.mL-1.
Precision, expressed as the RSD percentage of replicates, measures the relative errors of the method, as presented in Table II. The method developed for halcinonide quantiication showed precision, because the RSD (%) values of all parameters were less than 5.0 %, as established by RE 899/2003 (ANVISA).
The accuracy of the method refers to the proximity between the mean of the measured values and their real concentrations values (ICH, 2005). The results (Table III) agree with Fuster et al. (2015) because the mean recovery values were near to 100 % and the RSD was at less than 2 %, thereby indicating a low variability and a strong agreement between the experimental and theoretical concentration values.
FIGURE 2 - Representative HPLC chromatograms obtained from halcinonide standard solution (25.0 μg.mL-1) in methanol:water
and halcinonide-loaded and unloaded nanoparticles: LCN and SLN. Mobile phase: methanol:water (85:15 v/v); flow rate: 1.0 mL/min; detection wavelength: 239 nm; column temperature: 25±2 °C; and injection volume: 20 µL. HAL: halcinonide.
Retention time: 4.21 minutes.
TABLE I – ANOVA linearity results
SS DF MS F Ftab
Model 1.8581 x 10⁸ 1 1.8581 x 10⁸ 0.60 3.04
Residual 4.0503 x 10⁹ 13 3.1156 x 10⁸ Linear
Lack of Fit 2.2397 x 10⁸ 3 0.7465 x 10⁸ 0.195117 2.72
Pure Error 3.8263 x 10⁹ 10 3.8263 x 10⁸ No Lack of Fit
SS: sums of squares; DF: degrees of freedom; MS: mean squares; F: F value of the test; Ftab: ixed F value.
FIGURE 3 - Mean calibration curve obtained to halcinonide using working standard solutions at the concentration range
Results of recovery are shown in Table IV. The development method presented a recovery less than 5.0 % of RSD, with a recovery percentage near to 100 %, in accordance to what was established by RE 899/2003 (ANVISA).
The robustness of an analytical procedure measures its capacity to remain unafected by small, but deliberate, variations in the method parameters, and provides an indication of its reliability during normal usage (ICH, 2005). The method was considered robust because the RSD values were less than 1.54% for the drug content, as summarized in Table V, indicating that the deliberate variation of the method conditions had no significant efect on assay data or on chromatographic performance (Fontana, Bastos, Beck,2010), not afecting the analysis of halcinonide in lipid nanoparticles.
Encapsulation efficiency
The drug content and encapsulation eiciency (EE) of halcinonide in lipid nanoparticles was carried out by the previously validated HPLC method and the results obtained are presented in Table VI. High percentages of entrapped drug were obtained for lipid nanoparticles in both types. All formulations presented suitable EE values greater than 99%. These values are mainly based on the poor aqueous solubility of halcinonide and on its high partition coefficient (log P=3.31), which leads to high drug load quantities in lipid nanoparticles. The current results are similar to the ones previously reported by Silva et al. (2015) on the EE of betamethasone (topical glucocorticoid) in nanoparticles using a similar method for quantiication.
TABLE II - Repeatability, reproducibility and intermediate precision data of halcinonide analysis
Sample solution (25.0 µg.mL-1)
Experimental concentration
(µg.mL-1 ± SD*)
Recovered (%)
RSD** (%)
Repetability (n=6) 25.90 ± 0.75 103.60 ± 2.99 2.88
Reproducibility (n=6)
Day 1 (morning) 25.61± 0.28 102.45 ± 1.14 1.09
Day 2 (morning) 25.10 ± 0.52 102.09 ± 4.46 4.37
Day 1 (afternoon) 25.23 ± 0.34 100.93 ± 1.36 1.35
Intermediate precision (n=6)
Analyst 1 25.87 ± 0.83 103.48 ± 3.33 3.21
Analyst 2 25.72 ± 0.33 102.90 ± 1.33 1.29
*SD: standard deviation; **RSD: relative standard deviation.
TABLE III - Accuracy assays for halcinonide analysis
Level of concentration
Theoretical concentration
(µg.mL-1)
Experimental concentration (µg.mL-1 ± SD*)
Recovered (%)
RSD** (%)
Low 17.5 16.68 ± 0.25 95.31 ± 1.44 1.51
Medium 25.0 24.52 ± 0.18 98.06 ± 0.72 0.73
High 35.0 34.35 ± 0.30 98.14 ± 0.89 0.90
*SD: standard deviation; **RSD: relative standard deviation.
TABLE IV - Recovery assays for halcinonide analysis
Theoretical concentration (µg.mL-1)
Experimental concentration
(µg.mL-1 ± SD*)
Recovered (%)
RSD** (%)
200 198.48 ± 6.18 99.24 ± 3.09 3.11
700 704.60 ± 22.69 100.65 ± 3.24 3.22
In vitro permeation study
The permeation profile of pure halcinonide and halcinonide-loaded LCN and SLN are shown in Figure 4. An increase of pure halcinonide percentage in the receptor chambers with time was observed until 12 h. The permeation rates of pure halcinonide from Natrosol gel were about 18% and 50% during 6 and 24 hours,
respectively. Since the synthetic membrane used has similarities to the human skin, halcinonide can permeate through the stratum corneum barrier due to its lipophilic character, reaching the dermis and being absorbed.
The halcinonide-loaded lipid nanoparticle proile presented no more than 9 % of permeated halcinonide and there was no skin permeation diference between the LCN and the SLN during 24 h (p>0.05, t-test). This result indicates that despite the nature of the lipid nanoparticles, which could promote the permeation of the drug, the reservoir efect promoted by the LCN and the SLN was essential to control the halcinonide release.
With the purpose of obtaining drug quantiication, both for EE and in vitro drug permeation, the validated method was successfully applied in the determination of halcinonide in lipid nanoparticles-LCN and SLN-and it can be considered an important tool for the quality control of these promising formulations.
CONCLUSION
A simple and efective HPLC method was developed and validated for the quantitative determination of halcinonide in lipid nanoparticles-LCN and SLN. This method was considered speciic, linear, accurate, precise, and robust for a quick determination of halcinonide in lipid nanoparticles according to the ICH guideline and the Brazilian regulation (RE 899/2003). Furthermore, the
TABLE V - Robustness for halcinonide analysis
Conditions Experimental concentration
(µg.mL-1 ± SD*)
Recovered (%)
RSD** (%)
Flow rate
0.995 mL.min-1 25.89 ± 0.26 103.56 ± 1.05 1.00
1.005 mL.min-1 26.00 ± 0.41 104.03 ± 1.64 1.54 Mobile phase
84:16 26.25 ± 0.24 105.00 ± 0.95 0.90
86:14 26.48 ± 0.19 105.93 ± 0.75 0.70
*SD: standard deviation; **RSD: relative standard deviation.
TABLE VI - Halcinonide-loaded and encapsulation eiciency (EE) for polymeric lipid-core nanoparticles (LCN) and solid lipid
nanoparticles (SLN)
Lipid nanoparticle sample Theoretical concentration (µg.mL-1 ± SD*)
Experimental concentration
(µg.mL-1 ± SD)
EE
(% ± SD)
LCN-HAL 3000 2997.09 ± 1.14 99.90 ± 0.04
SLN-HAL 3000 2999.01 ± 0.10 99.96 ± 0.01
*SD: standard deviation. HAL: halcinonide.
FIGURE 4 -In vitro cumulative permeation-time profile of
halcinonide and halcinonide-loaded lipid nanoparticles. HAL: halcinonide. *represent statistical diferent result; Student’s
drug content and the encapsulation eiciency were quickly and suitably determined, as well as the halcinonide in vitro permeation proile, displaying a controlled drug release and indicating a possible reduction of halcinonide toxicity due to its nanoencapsulation.
ACKNOWLEDGMENTS
This work was supported by CNPq and UEPG (State University of Ponta Grossa).
REFERENCES
AGÊNCIA NACIONAL DE VIGILÂNCIA SANITÁRIA. ANVISA. Resoluçao n° 899, de 29 de maio de 2003. Diário
Oicial [da] República Federativa do Brasil, Brasília, DF, 02 de julho de 2003.
BRUM, T.L.; FIEL, L.A.L.; CONTRI, R.V.; GUTERRES, S.S.; POHLMANN, A.R. Polymeric nanocapsules and lipid-core
nanocapsules have diverse skin penetration. J. Nanosci. Nanotechnol., v.15, n.1, p.773-780, 2015.
CHEN, H.; CHANG, X.; DU, D.; LIU, W.; LIU, J.; WENG,
T.; YANG, Y.; XU, H.; YANG, X. Podophyllotoxin-loaded solid lipid nanoparticles for epidermal targeting. J. Control.
Release, v.110, n.2, p.296-306, 2006.
CORADINI, K.; LIMA, F.O.; OLIVEIRA, C.M.; CHAVES, P. S.; ATHAYDE, M.L.; CARVALHO, L.M.; BECK, R.C.R.
Co-encapsulation of resveratrol and curcumin in lipid-core
nanocapsules improves their in vitro antioxidant efects.
Eur. J. Pharm. Biopharm., v.88, n.1, p.178-185, 2014.
FIEL, L.A.; PAESE, K.; RIZZI, M.; GUTERRES, S.S.; POHLMANN, A.R. A strategy to estimate the intrinsic lux
of a poorly water soluble substance for comparison with its release from lipid-corenanocapsules. Colloid Surf. A, v.441, p.716-724, 2014.
F O N TA N A , M . C . ; B A S TO S , M . O . ; B E C K , R . C . R .
Development and validation of a fast RP-HPLC method
for the determination of clobetasol propionate in topical nanocapsule suspensions. J. Chromatogr. Sci., v.48, n.8, p.637-40, 2010.
FUSTER, J.; NEGRO, S.; SALAMA, A.; FERNÁNDEZ-CARBALLIDO, A.; MARCIANES, P.; BOEVA, L.; BARCIA, E. HPLC-UV method development and validation for the quantiication of ropinirole in new PLGA
multiparticulate systems: Microspheres and nanoparticles.
Int. J. Pharm., v.491, n.1, p.310-317, 2015.
GHADIRI, M.; FATEMI, S.; VATANARA, A.; DOROUD,
D.; NAJAFABADI, A.R.; DARABI, M.; RAHIMI,
A.A. Loading hydrophilic drug in solid lipid media as nanoparticles: statistical modeling of entrapment eiciency
and particle size. Int. J. Pharm., v.424, n.1, p.128-137, 2012.
GOMES, M.L.S.; KLEIN, T.; SIMIONATTO, M.; NADAL,
J.M.; ZANIN, S.M.W.; BORSATO, D.M.; FARAGO,
P.V. A simple RP-HPLC/UV method for determination
of cilostazol in polymeric nanoparticles suspensions: development and validation. Lat. Am. J. Pharm., v.34, n.4, p.803-809, 2015.
GUICHARD, A.; HUMBERT, P.; TISSOT, M.; MURET, P.;
COUDEROT-MASUYER, C.; VIENNET, C. Effects of
topical corticosteroids on cell proliferation, cell cycle progression and apoptosis: In vitro comparison on HaCaT.
Int. J. Pharm., v.479, n.2, p.422-429, 2015.
HENGEE, U.R.; RUZICKA, T.; SCHWARTZ, R.A.; CORK,
M.J. Adverse efects of topical glucocorticosteroids. J. Am. Acad. Dermatol., v.54, n.1, p.1-15, 2006.
INTERNATIONAL CONFERENCE ON HARMONISATION. ICH. Technical requirements for registration of
pharmaceuticals for human use. Quality Guideline: view
all quality guidelines. analytical validation Q2. Q2 (R1) -
validation of analytical procedures: text and methodology. Geneva: ICH, 2005.
JÄGER, A.; STEFANI, V.; GUTERRES, S.S.; POHLMANN,
A.R. Physicochemical characterization of nanocapsule
polymeric wall using luorescent benzazole probes. Int. J. Pharm.,v.338, n.1-2, p.297-305, 2007.
KELIDARI, H.R.; SAEEDI, M.; AKBARI, J.; MORTEZA-S E M N A N I , K . ; G I L L , P. ; VA L I Z A D E H , H . ;
KIRSCHBAUM, J.; POET, R.; BUSH, K.; PETRIE, G.
High-performance liquid chromoatography of the topical anti-inlammatory steroid halcinonide. J. Chromatogr., v.190, n.2, p.481-485, 1980.
KLEIN, T.; LONGHINI, R.; MELLO, J.C.P. Development of an analytical method using reversed-phase HPLC-PDA for a semipuriied extract of Paullinia cupana var. sorbilis
(guaraná). Talanta, v.88, p.502-506, 2012.
MADAM, J.R.; KHUDE, P.A.; DUA, K. Development and evaluation of solid lipid nanoparticles of mometasone furoate for topical delivery. Int. J. Pharm. Invest., v.4, n.2, p.60-64, 2014.
MAIA, C.S.; MEHNERT, W.; SCHAFER-KORTING, M. Solid lipid nanoparticles as drug carriers for topical glucocorticoids. Int. J. Pharm., v.196, n.2, p.165-167, 2000.
SCHACKE, H.; DOCKE, W.-D.; ASADULLAH, K. Mechanisms involved in the side efects of glucocorticoids.
Pharmacol. Ther., v.96, n.1, p.23-43, 2002.
SCHAFFAZICK, S.R.; GUTERRES, S.S. Caracterização
e estabilidade físico-química de sistemas poliméricos nanoparticulados para administração de fármacos. Quim. Nova, v.26, n.5, p.726-737, 2003.
SENYIGIT, T.; OZER, O. Corticosteroids for skin delivery: challenges and new formulation opportunities. In: QIAN, X. Glucocorticoids: new recognition of our familiar friend. Rijeka, Croatia: InTech, 2012. Chap. 24.
SHAH, B.; KHUNT, D.; BHATT, H.; MISRA, M.; PADH, H.
Application of quality by design approach for intranasal
delivery of rivastigmine loaded solid lipid nanoparticles:
efect on formulation and characterization parameters. Eur. J. Pharm. Sci., v.78, p.54-66, 2015.
SILVA, C.O.; RIJO, P.; MOLPECERES, J.; FIGUEIREDO, I.V.; ASCENSÃO, L.; FERNANDES, A.S.; ROBERTO, A.; REIS, C.P. Polymeric nanoparticles modiied with fatty acids encapsulating betamethasone for anti-inlammatory
treatment. Int. J. Pharm., v.493, n.1, p.271-284, 2015.
TAHERI, A.; FELDMAN, S.R. Halcinonide: a review of its
clinical merits. Curr. Clin. Solutions, p.1-5, Dec. 2012.
VENTURINI, C.G.; JÄGER, E.; OLIVEIRA, C.P.;
BERNARDI, A.; BATTASTINI, A. M.O.; GUTERRES,
S.S.; POHLMANN, A.R. Formulation of lipid core
nanocapsules. Colloid Surf. A,v.375, n.1-3, p.200-208, 2011.
VIJAYAKUMAR, A.; BASKARAN, R.; JANG, Y.S; OH,
S.H.; YOO, B.K. Quercetin-loaded solid lipid nanoparticle dispersion with improved physicochemical properties and cellular uptake. AAPS PharmSciTech., 2016. [Ahead of print]. DOI:10.1208/s12249-016-0573-4.
ZHANG, Y.; LI, Z.; ZHANG, K.; YANG, G.; WANG, Z.;
ZHAO, J.; HU, R.; FENG, N. Ethyl oleate-containing nanostructured lipid carriers improve oral bioavailability of trans-ferulic acid as compared with conventional solid lipid nanoparticles. Int. J. Pharm., v.511, n.1, p.57-64, 2016.
Received for publication on 22nd December 2015