http://dx.doi.org/10.1590/s2175-97902017000216047
A
r
*Correspondence: M. Yasir. Department of Pharmaceutics. I.T.S College of Pharmacy. Delhi- Meerut Road, 201206 (UP), Murad Nagar, Ghaziabad, India. E- mail: [email protected]
Development of a new HPLC method for
in vitro
and
in vivo
studies
of haloperidol in solid lipid nanoparticles
Mohd Yasir
1,2,*, Udai Vir Singh Sara
3, Iti Som
21
Department of Pharmacy, Uttarakhand Technical University, Dehradun, (Uttarakhand), India, 2Department of Pharmaceutics, I.T.S College of Pharmacy, Delhi-Meerut Road, Murad Nagar, Ghaziabad (UP), India, 3
Department of Pharmaceutics, Dr. M. C. Saxena College of Pharmacy, Lucknow, (UP), India
A simple and sensitive HPLC method was developed and validated for the quantiication of haloperidol in solid lipid nanoparticles (SLNs). The developed method was used for detection of shelf life of haloperidol in SLNs. Calibration curve of haloperidol was also constructed in rat plasma using loratidine as internal standard. In vivo studies were performed on rats and concentration of haloperidol in brain and blood was measured for the determination of various pharmacokinetic and hence brain targeting parameters. Chromatogram separation was achieved using C18 column as stationary phase. The mobile phase consisted of 100 mM/L potassium dihydrogen phosphate–acetonitrile–TEA (10:90:0.1, v/v/v) and the pH was adjusted with o-phosphoric acid to 3.5. Flow rate of mobile phase was 2 mL/minute and eluents were monitored at 230 nm using UV/VIS detector. The method was validated for linearity, precision, accuracy, reproducibility, limit of detection (LOD) and limit of quantiication (LOQ). Linearity for haloperidol was in the range of 1-16 µg/mL. The value of LOD and LOQ was found to be 0.045 and 0.135 μg/mL respectively. The shelf life of SLNs formulation was found to be 2.31 years at 4 oC. Various parameters like drug targeting index (DTI), drug targeting eiciency (DTE) and nose-to-brain direct transport (DTP) were determined for HP-SLNs & HP-Sol administered intranasally to evaluate the extent of nose-to-brain delivery. The value of DTI, DTE and DTP for HP-SLNs was found to be 23.62, 2362.43 % and 95.77% while for HP-Sol, values were 11.28, 1128.61 % and 91.14 % respectively.
Uniterms: Haloperidol/quantification. Haloperidol/pharmacokinetic. Haloperidol/in vitro study. Haloperidol/in vivo study. High performance liquid chromatography/solid lipid nanoparticles. Plasma. Validation. Brain targeting.
INTRODUCTION
Haloperidol is an orally administered dopamine inverse agonist of the typical antipsychotic class of medication that chemically belongs to butyrophenone
group (Gajski, Geri, Garaj-Vrhovac, 2014). Its mechanism
of action is mediated by blockade of D2 dopamine receptors in brain (Benvegnú et al., 2011). Haloperidol is used to treat certain psychiatric conditions including schizophrenia, maniac states, medicament induced psychosis and neurological disorders with hyperkinesias (Forsman,
1976). Haloperidol is chemically 4-[4-(4-chlorophenyl)-4-hydroxypiperidino] 4’- luorobutyrophenone (Figure 1).
The molecular formula of haloperidol is C21H23ClFNO2 and
molecular weight is 375.86 g/mol.
Various analytical techniques have been used for determination of haloperidol in pharmaceutical formulations. These include high performance liquid chromatography (HPLC) (Wate, Borkar, 2009), high performance thin-layer chromatography (HPTLC) (Sigrid
et al., 2007), 19F NMR spectroscopy (Mojtaba et al., 2007), square-wave adsorptive stripping voltammetry
at a mercury electrode (El-Desoky, Ghoneim, 2005), square-wave and cyclic voltammetry at hanging mercury drop electrode (Ribeiro et al., 2011), cyclic voltammetry at multi-walled carbon nanotubes-modified glassy carbon electrode (Huang et al., 2008). Non-aqueous titrimetric method has also been developed for haloperidol determination in pharmaceutical preparations (European Pharmacopoeia, 2002). UV spectrophotometric assay
procedures have been developed and described in oicial
compendia (Janicki, Ko, 1991;Chinese Pharmacopoeia,
2005; Yasir, Sara, 2014a). The analytical procedures
like HPLC technique are still being frequently used and published.
The aim of present study was to develop and validate a new HPLC method for the quantitative analysis of
haloperidol in SLNs. The diferent analytical performance
parameters such as linearity, precision, accuracy, reproducibility, limit of detection (LOD) and limit of
quantiication (LOQ) were determined according to ICH Q2 (R1) guidelines (ICH, 2005; Dalila et al., 2012). For the determination of pharmacokinetic and brain targeting parameters after intranasal administration of haloperidol loaded solid lipid nanoparticles (HP-SLNs) and plain drug solution (HP-Sol), the calibration curve of haloperidol in rat plasma was prepared by the reported RP-HPLC method (Jain et al., 2011).
MATERIAL AND METHODS
Chemicals
Haloperidol was received as a gift sample from Vamsi Labs Ltd Solapur, Maharashtra, India. Potassium
dihydrogen phosphate was purchased from Qualigens ine
chemicals, Mumbai, India. Sodium hydroxide was procured from Fisher scientific, Mumbai, India. Acetonitrile (ACN), Triethylamine (TEA) and o-phosphoric acid were purchased from Sigma-Aldrich, New Delhi, India. All
reagents were of HPLC grade. Milli-Q grade (Millipore,
Molsheim, France) water was used to prepare solutions
wherever required and it was iltered before use through a 0.22 µm membrane ilter.
Instruments
Bath sonicator (Multitech Pvt. Ltd., N. Delhi), Balance (AUX 220, Shimadzu Corporation, Kyoto, Japan), Magnetic stirrer (Remi Instruments Pvt. Ltd.,
Mumbai, India), pH meter (Hicon Scientiic Instruments,
Delhi, India), Centrifuge (Remi Instruments Pvt. Ltd., India), Micro pipettes (Labnet, USA), Vortex mixer
(S.M. Scientiic instruments Pvt. Ltd, Delhi) were used
for the study.
HPLC System:Jasco HPLC system was used with
following speciications
Column: C-18 Cosmosil packed column
(5 C18- MS-II, 250 mm x 4.6 mm x 5.0 μm)
Pump: Jasco PU- 2080 plus
Type of Pump: Isocratic type
Detector: UV/VIS detector (Jasco UV 2075 plus) Software: Jasco Borwin version (1.5, LC-Net II/ADC system)
Injector: Syringe type manual injector
Injection Vol.: 20µL
Other accessories for HPLC embodies HiMedia
Syringe-driven ilters of 0.22 μm pore size
HPLC method
S e v e r a l m e t h o d s h a v e b e e n d e v e l o p e d f o r the determination of haloperidol in pharmaceutical preparation.
The concentration of haloperidol had been earlier determined by HPLC method using methanol-water
(63:37, v/v) containing 0.2 M ammoniumacetate as mobile phase and diphenylamine as internal standard (IS) (Miyazaki et al., 1981). The method used here was
slightly modiied in the terms of mobile phase.100 mM/L
potassium dihydrogen phosphate–acetonitrile–TEA (10:90:0.1, v/v/v) was used as mobile phase and the pH was adjusted with o-phosphoric acid to 3.5. It was sonicated
for 15 minutes and iltered through 0.22 μm membrane ilter. Flow rate of mobile phase was maintained at 2 mL/
min and eluents were monitored at 230 nm. The samples
(20 μL ) were injected using manual type HPLC injector.
All determinations were performed at ambient temperature for a run time of 5 min.
Preparation of calibration curve
A stock solution of 1.0 mg/mL of haloperidol was prepared in mobile phase. An appropriate volume of stock solution was further diluted with mobile phase to obtain
a standard solution having a inal concentration 100 μg/ mL. Diferent concentrations (1-16 μg/mL) were made
for the preparation of calibration curve from the prepared standard solution. The prepared dilutions were injected
serially (20 μL) and area under peak was recorded for
plotting the concentration of haloperidol on X -axis and peak area on Y-axis.
Method validation
HPLC method for Haloperidol was validated as
per the ICH guidelines Q2 (R1) for linearity, precision, accuracy, reproducibility , LOD and LOQ.
Linearity
The linearity of response for haloperidol was assessed in the range of 1-16 µg/mL for standard drug.
Accuracy as recovery
Accuracy was determined using standard addition method. The pre-analyzed samples were spiked with
extra 50, 100 and 150 % of the standard haloperidol and
the mixtures were analyzed by the proposed method. The
experiment was performed in triplicate. The % recovery, % relative standard deviation (RSD), and standard error
of mean (SEM) were calculated at each concentration level.
Precision
The precision was determined at two levels as per
ICH, Q2 (R1) guidelines i.e. repeatability and intermediate
precision.
a. Repeatability: Repeatability of drug sample was determined as intraday variation. Three replicates for each of the three concentrations were analyzed three times a day. Hence a minimum of 9 determinations were
performed covering the speciied range for the procedure. The % relative standard deviation was calculated for area
to obtain the intraday variation
b. Intermediate precision: It was determined by interday variation (for three different days) for the determination of haloperidol at three different
concentration levels of 4, 8 and 12 µg/mL in triplicate. The % relative standard deviation was calculated for area
to obtain the interday variation.
Reproducibility
Reproducibility of the method was investigated by obtaining precision of the method in another laboratory
using the diferent instrument and analyzed by another
person. Both intraday & interday precision were calculated
at three diferent concentration levels of 4,8,12 μg/ mL.
LOD and LOQ determination
LOD and LOQ of the drug were calculated as per ICH Q2 (R1) guidelines (ICH, 2005) using the standard
deviation method with the help of equations 1 and 2 respectively.
LOD = 3.3 × σ/S (1)
LOQ = 10 × σ/S (2)
where σ = standard deviation of the response; S= slope of
the regression line.
Application of developed HPLC method for In vitro studies i.e. in determination of shelf life
Haloperidol loaded solid lipid nanoparticles
(HP-SLNs) were prepared by modiied solvent emulsiication– difusion technique (Kumar et al., 2013) and optimised by Boxbehken design (Yasir, Sara, 2013). The shelf life of optimized HP-SLNs was determined by conventional method using Arrhenius equation. Optimized SLN
formulations were kept at 25 ± 2 ºC; 30 ±2 ºC and 40 ±
2 ºC at ambient RH (Shakeel et al., 2007). Samples were withdrawn after speciied time intervals (0, 30, 90, and
180 days) and the drug content was determined using HPLC. Amount of drug remaining was determined at each interval. Logarithm of percent drug remaining versus time
(days) was plotted. The degradation rate constant ‘K’ was
determined from the slope of the lines at each elevated temperature using the following equation (3).
(3)
Arrhenius Plot was constructed between log K and 1/T to determine the shelf life of optimized SLNs. K value
at 4 oC was determined using extrapolation method. The
shelf life (T0.9) at 4 oC was calculated with the help of
following equation (4).
(4)
HPLC method in rat plasma for in vivo studies
For in vivo studies, the calibration curve of
haloperidol in rat plasma was prepared by the reported RP-HPLC method (Jain et al., 2011).
Preparation of stock solution
A stock solution (1.0 mg/mL) of drug was prepared in mobile phase. Aliquots from stock solution were further diluted with mobile phase to yield a standard
Different concentrations (20 -90 ng/mL) were made for
the preparation of calibration curve from the inal standard
solution.
Preparation of calibration curve for determination of haloperidol in rat plasma
Calibration curve was prepared by adding known
amount of haloperidol (20, 30, 40, 50, 60, 70, 80 and 90
ng/mL) to 1 ml of blank plasma in test tube separately.
An aliquot (500 μL) of loratidine solution (internal
standard, concentration 100 ng/mL) was added in each test tube separately. Each test tube was vortexed by adding 5 mL isopropyl alcohol for 5 min on a vortex
mixer (S.M. Scientiic instruments Pvt. Ltd, Delhi) and then centrifuged at 4000 rpm for 10 min until a clear
organic layer was separated. Organic layer was evaporated to dryness at room temperature. Subsequently dried sample was reconstituted with 0.3 ml mobile phase and evaluated by HPLC for the presence of haloperidol. The calibration curve was constructed between concentration of haloperidol (X-axis) and peak area ratio of haloperidol and loratidine (Y-axis).
In vivo studies for the determination of
pharmacokinetic and Brain targeting parameters
Comparative in vivo studies were performed for both haloperidol solution (positive control) (Sol) and HP-loaded SLNs administered intranasally (i.n.) and HP-Sol (positive control) administered intravenously (i.v.).
Animals for in vivo study
In vivo studies were performed on male albino
wistar rats (Adult/weighing 200-250 g). A protocol for animal studies was approved by Institutional animal ethical committee and project number was ITS/03/ IACE/2013. The animals were kept under standard laboratory conditions i.e. temperature of 22 ± 3 °C and
relative humidity of 30%-70%. The animals were housed
in polypropylene cages, (6 animals per cage) with free access to standard laboratory diet and water ad libitum.
Calculation of dose for rats
Dose for the rats was calculated taking into consideration ratio of surface area of a rat to that of a
human being (Yasir, Sara, 2014b). Surface area ratio for a rat (200 g) to a human (70 kg) is 56. Dose for 200 g rat can
be calculated by following equation (5).
(5)
where x is the dose of rat per 200 g. The dose of haloperidol
for human is 10 mg. Hence x =0.179 mg per 200 g of rat
i.e. 0.893 mg/kg.
In vivo study
For in vivo study, Rats were divided in three diferent
groups:
Group A, positive control for intravenous (i.v.) drug ad-ministration (HP-Sol);
Group B, positive control for intranasal (i.n.) drug admin-istration (HP-Sol); and
Group C, intranasal (i.n.) formulation administration (HP-SLNs).
Each group was divided into 8 subgroups (containing 6 animals) on time basis as given below:
Subgroup 1: drug was administered at time 0 and sacriice was done after 0.167 h
Subgroup 2: drug was administered at time 0 and sacriice
was done after 0.5 h
Subgroup 3: drug was administered at time 0 and sacriice
was done after 1 h
Subgroup 4: drug was administered at time 0 and sacriice
was done after 2 h
Subgroup 5: drug was administered at time 0 and sacriice was done after 4 h
Subgroup 6: drug was administered at time 0 and sacriice
was done after 6 h
Subgroup 7: drug was administered at time 0 and sacriice was done after 8 h
Subgroup 8: drug was administered at time 0 and sacriice
was done after 24 h
Procedure of drug administration
Drug solution (positive control), containing
0.179 mg (for rat weighing 200 g) of haloperidol
(equivalent to 0.89 mg/kg body weight), was injected through the tail vein (10 µL) in one group of rats. Similarly, drug solution and drug formulation (HP-SLNs)
containing 0.179 mg of haloperidol were administered
in each nostril in the other two groups with the help of micropipette (10-100 µL) with 0.1 mm internal diameter at the delivery site. The rats were anaesthetized prior to nasal administration by pentobarbital sodium (35-50 mg/kg, i.p.) and held firmly from the back in a slanted position during nasal administration.
Procedure for blood sampling
The rats were killed humanely by overdose of
pentobarbital sodium at diferent time intervals (0.167, 0.5, 1, 2, 4, 6, 8 and 24 h) and the blood was collected using
blood was centrifuged at 4000 rpm for 20 min and aliquots
of the supernatant separated and stored at -21 °C until drug analysis was carried out using HPLC (Kumar et al., 2008). At the same interval of blood collection, the rats were sacrificed to separate the brain. Brain was rinsed twice with normal saline, made free from adhering tissue/ fluid and weighed. Cold normal saline solution was added (brain weight: normal saline, 1:5) to the brain and homogenized on ice. The homogenate was centrifuged
at 4000 rpm for 20 min at 4 °C, and aliquots of the
supernatant were separated and stored at –21 °C until drug analysis was carried out using HPLC (Haque et al.,
2014).
Procedure of drug extraction from plasma by liquid- liquid extraction method
Chromatographic separation was achieved with a
Cosmosil C18 column (250 mm × 4.6 mm, particle size 5
µm). The mobile phase consisted of 100 mmol/L potassium dihydrogen phosphate–acetonitrile–TEA (10:90:0.1, v/v/v) and the pH was adjusted with o-phosphoric acid to 3.5.
The mobile phase was sonicated for 15 min and iltered through 0.22 μm membrane ilter before using. Flow rate
of mobile phase was maintained at 2 mL/min and eluents
were monitored at 230 nm. Twenty μL of sample was
injected using a HPLC injector. All determinations were performed at ambient temperature for a run time of 5 min.
The extraction of haloperidol from plasma and brain samples was carried out using the liquid–liquid extraction (LLE) technique. Plasma sample and homogenized brain tissue (0.5 mL) was mixed with 100 µL loratidine (100 ng/mL) as internal standard solution (Jainet al.,
2011; Rahman, Khatoon, Rahman, 2012).The mixture was shaken with 2 mL isopropyl alcohol for 2 min on a
vortex mixer and then centrifuged at 4000 rpm for 10 min
until a clear organic layer was separated. Organic layer was evaporated to dryness under nitrogen gas at room temperature. Dried sample was then reconstituted with 0.3 mL mobile phase and evaluated by HPLC for the presence of drug.
Analysis of pharmacokinetic and brain targeting parameters
P l a s m a c o n c e n t r a t i o n – t i m e p r o f i l e s o f haloperidol after i.n. and i.v. delivery were evaluated by pharmacokinetic software (PK Functions for Microsoft Excel, Pharsight Corporation, Mountain View, CA, USA). Various pharmacokinetic parameters as Cmax, Tmax, AUC
0-∞ and elimination rate constant (Ke) were calculated.
Statistical analysis was performed using Graph pad prism 5.0 (Graph pad software San Diego, CA). All results were
expressed as mean ± SD. Diference among the groups
was compared with the analysis of variance (ANOVA) followed by Tukey-Kramer multiple comparison test. P-
Value < 0.05 was considered statistically signiicant. The extent of nose-to-brain delivery could be evaluated by many parameters (Abdelbeary, Tadros, 2013):
(i) The brain/blood ratio, at 0.5 h, following intrana-sal and intravenous administration (Vyas et al., 2005).
(ii) The relative bioavailability (RB) percentages fol-lowing the intranasal administration in the blood and brain (MD et al., 2012).
(iii) The drug targeting index (DTI) (Wang, Jiang, Lu, 2003).
(iv) The drug targeting efficiency (DTE) percentage (Chow, Chen, Matsuura, 1999).
(v) The nose-to-brain direct transport percentage (DTP) (Zhang et al., 2004, Wang, Chi, Tang, 2008).
The relative bioavailability (%) of the intranasal
HP-SLNs formulation to intranasal HP-Sol was determined according to following equation (6).
(6)
The DTI can be described as the ratio of the AUC brain/AUC blood following i.n. administration to that
following i.v. administration. Following equation (7) was
used for the determination of DTI.
(7)
The percent brain targeting eiciency (DTE %) and nose to brain direct transport percentage (DTP %) were
calculated with the help of given equation (8 & 9) (Wang, Jiang, Lu, 2003; Abdelbary, Tadros, 2013).
(8)
(9)
where F = (AUC0–24, brain, i.v. / AUC0–24, blood, i.v.) × AUC0–24,
blood, i.n., AUC0–24,brain, i.n. is the area under the curve of brain
following i.n. administration, AUC0–24,brain, i.v. is the area
under the curve of brain following i.v. administration,
following i.v. administration, AUC0–24 blood, i.n. is the area under the curve of blood following i.n. administration.
RESULTS AND DISCUSSION
Preparation of calibration curve
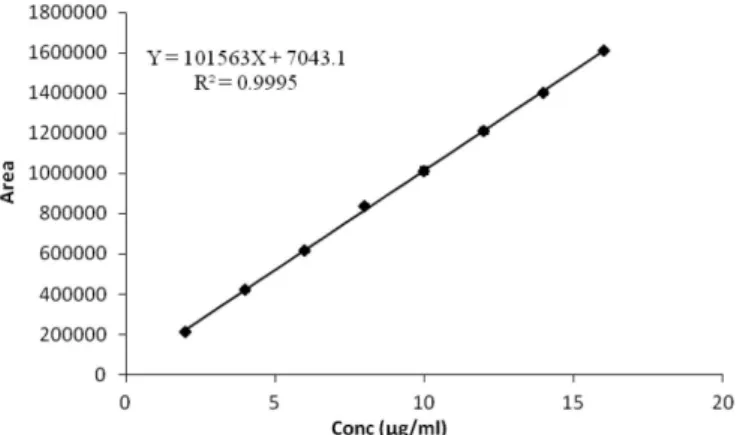
Calibration curve was constructed and a linear relationship was observed between peak area and concentration. The regression data for calibration curve showed a good linear relationship over concentration range of 1-16 µg/mL with respect to the peak area (Figure 2). The retention time of haloperidol was found
to be 2.758±0.12 min as shown in Figure 3.
Method validation
Using the optimized chromatographic conditions, the developed HPLC method was validated with respect to linearity, precision, accuracy, reproducibility, LOD and
LOQ as per the ICH guidelines.
Linearity
The linearity range of haloperidol solution was
obtained as 1-16 µg/mL. The linear regression equation
was found to be Y = 101563X + 7043.1 with correlation coeicient (R2) of 0.9995.
Accuracy as recovery studies
The proposed method aforded recovery of 99.55-100.42% after spiking the additional standard drug
solution to the previously analyzed test solution. The value
of % recovery, % RSDs and SE are shown in Table I, which
indicated the accuracy of the proposed method.
Precision
The precision was assessed by analyzing haloperidol
in three diferent concentration levels as 4, 8 and 12 μg/
ml of in triplicate. The results of repeatability(intraday precision) and intermediate (interday) precision were
expressed in the terms of % RSD. The intraday and
interday precision study of the developed method confirmed the adequate sample stability and method
reliability where all RSDs were below 2% as shown in
Table II.
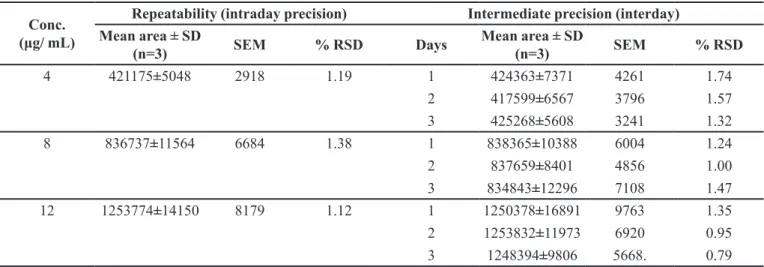
Reproducibility
Reproducibility of the method was investigated by obtaining precision of the method in another laboratory using the different instrumentation and analysis being performed by another person. Both intraday & interday
precision were calculated and no signiicant diferences were observed (P< 0.05) in the % RSD values of intraday
and interday precision, which indicated the reproducibility of the method. The results of intraday and interday precision are shown in Table III.
LOD and LOQ determination
LOD and LOQ of this method were determined by
the standard deviation method. The value of LOD and
LOQ were found to be 0.045 and 0.135 μg/ml respectively, which signiies that proposed method can be used for the detection and quantiication of haloperidol even in very
low concentration.
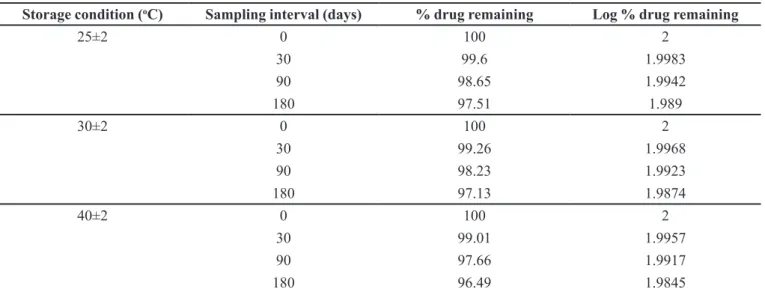
Application of Developed HPLC method for in vitro studies i.e. in determination of shelf life
The percentage drug remaining in the optimized formulation (HP-SLNs) when stored for 180 days at
elevated temperatures of 25±2 ºC; 30 ± 2 ºC; and 40±2 ºC
at ambient RH was determined by HPLC method
(Table IV). Figure 4a depicts the graph obtained by
plotting Logarithm of percent drug remaining versus time
(days). The degradation rate constant ‘K’ was determined
FIGURE 2 - Calibration curve of haloperidol by HPLC method.
from the slope of the lines at each elevated temperature using the equation (3).
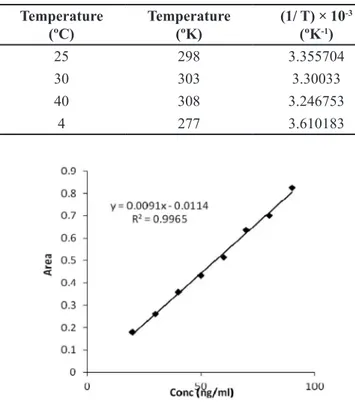
Arrhenius plot was constructed between log K and
1/T (Table V and Figure 4b). From the plot, the value of degradation rate constant (K4) at 4ºC (refrigerator
temperature) was determined. Shelf life was calculated by
placing the value of K4 in equation (4). The shelf life of HP in SLNs at 4ºC was found to be 2.31 years. The degradation
kinetics of HP in SLNs was also determined and it was
found to be irst order kinetics as shown in Figure 4a.
TABLE I - Accuracy as recovery of proposed method
% of standard spiked to the
sample
Concentration
% drug
recovered % RSD SE
Sample
(μg /mL)
Total including spiked sample
(μg /mL)
Spiked sample determined
(μg /mL) ± SD (n = 3)
50 10 15 15.03±0.29 99.55 1.93 0.17
100 10 20 19.97±0.21 99.86 1.03 0.12
150 10 25 25.11±0.35 100.42 1.39 0.20
TABLE II - Precision of proposed method
Conc.
(μg/ mL)
Repeatability (intraday precision) Intermediate precision (interday)
Mean area ± SD
(n=3) SEM % RSD Days Mean area ± SD (n=3) SEM % RSD
4 424842± 2410 1393 0.56 1 425363±3293 1903 0.77
2 422999±5335 3084 1.26
3 420934±3868 2236 0.91
8 835070±9054 5234 1.08 1 840698±5981 3457 0.71
2 839759±4031 2330 0.48
3 836843±3414 1973 0.41
12 1256774±11926 6894 0.95 1 1249711±12335 7130 0.99
2 1251832±13451 7775 1.1
3 1246394±13045 7540 1.05
TABLE III - Reproducibility of proposed method
Conc.
(μg/ mL)
Repeatability (intraday precision) Intermediate precision (interday)
Mean area ± SD
(n=3) SEM % RSD Days Mean area ± SD (n=3) SEM % RSD
4 421175±5048 2918 1.19 1 424363±7371 4261 1.74
2 417599±6567 3796 1.57
3 425268±5608 3241 1.32
8 836737±11564 6684 1.38 1 838365±10388 6004 1.24
2 837659±8401 4856 1.00
3 834843±12296 7108 1.47
12 1253774±14150 8179 1.12 1 1250378±16891 9763 1.35
2 1253832±11973 6920 0.95
HPLC method in rat plasma for in vivo studies
For in vivo studies, the calibration curve of
haloperidol in rat plasma was prepared by the reported RP-HPLC method (Jain et al., 2011).
Preparation of calibration curve for determination of haloperidol in rat plasma
Calibration curve was prepared in rat plasma by the reported RP-HPLC method (Jain et al., 2011).Calibration curve was obtained by plotting the peak area ratio of haloperidol to internal standard against the respective concentration (Figure 5). The linearity was observed in concentration range of 20-90 ng/ml. The HPLC chromatogram of plasma spiked with haloperidol and blank plasma are shown in Figure 6a and 6b respectively. The approximate retention time of haloperidol and IS was found to be 2.536 and 3.59 min respectively.
Drug extraction from plasma by liquid- liquid extraction method
Liquid- liquid extraction method as described above was used for the drug extraction from rat plasma. Isopropyl alcohol was used as extraction solvent to obtain better recovery and good separation from the plasma impurities. The mobile phase was a mixture of 100 mM potassium dihydrogen phosphate, acetonitrile and TEA (10:90:0.1,
v/v/v) and the pH was adjusted with o-phosphoric acid to 3.5. Loratidine was chosen as internal standard because it showed similar chromatographic behaviour to haloperidol with no interference. A satisfactory peak resolution and reasonable retention of the drug and internal standard were obtained.
In vivo studies for the determination of
pharmacokinetic & brain targeting parameters
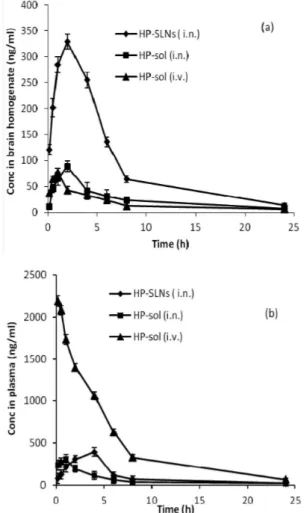
The haloperidol concentrations in brain following
TABLE IV - Degradation of optimized HP- SLNs kept at 25±2 ºC; 30±2 ºC and 40±2 ºC at ambient RH
Storage condition (oC) Sampling interval (days) % drug remaining Log % drug remaining
25±2 0 100 2
30 99.6 1.9983
90 98.65 1.9942
180 97.51 1.989
30±2 0 100 2
30 99.26 1.9968
90 98.23 1.9923
180 97.13 1.9874
40±2 0 100 2
30 99.01 1.9957
90 97.66 1.9917
180 96.49 1.9845
FIGURE 4 - (a) Log % drug remaining vs. time plot (b) Arrhenius
the i.n. administration of HP-SLNs were found to be
signiicantly (P<0.05) higher at all the time points as
compared to both HP-Sol i.n. and HP-Sol i.v. (Figure 7a).
The HP concentration in plasma following the i.n. of HP-SLNs were found to be significantly (P<0.05) lower at all the time points compared to HP-Sol i.v.
administration (Figure 7b). Various pharmacokinetic
parameters of haloperidol were determined as shown in Table VI. The lower value of Tmax for brain (2 h) as
compared to blood (4 h) may attribute to the preferential
nose to brain transport following i.n. administration.
The value of Cmax (329.17±20.89 ng/mL) for brain
after intranasal administration of HP-SLNs was
signiicantly (P<0.05) higher than HP-Sol administered
intranasally and intravenously. Similarly, the value of AUC0-∞ (2389.17±78.82 ng.h/mL) of HP-SLNs i.n. was found to be significantly (P<0.05) higher than HP-Sol (i.n. and i.v.). This might be due to the direct transport of drug through olfactory route by bypassing the BBB.
As reported by Dhuria, Hanson and Frey (2010), the drug uptake by brain from the nasal mucosa can be achieved via three major pathways (i) a systemic pathway of drug absorption into the blood circulation which subsequently reaches to the brain across the
BBB, (ii) lymphatic pathway (Abdelbary, Tadros, 2013) (iii) a direct pathway from nasal mucosa epithelium into brain mainly along olfactory or trigeminal nerves by passing the BBB (MD et al., 2012). The extent of nose-to-brain delivery could be evaluated by the following parameters.
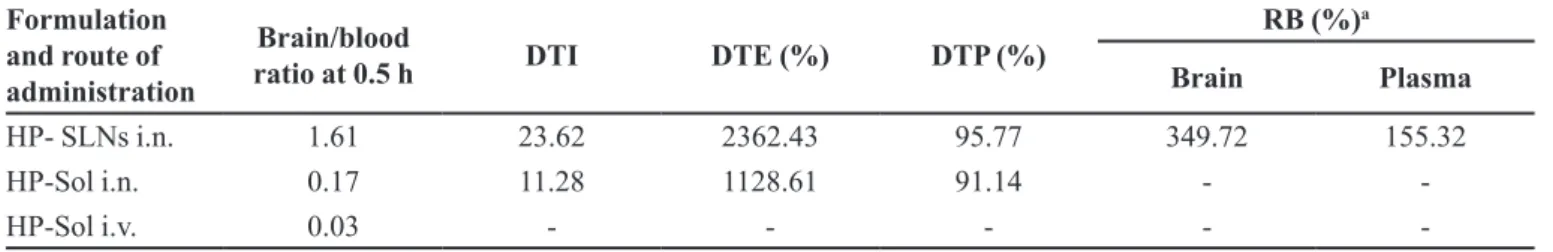
a) The brain/blood ratio, at 0.5 h, following intra
-nasal and intravenous administration: This value
was found to be 1.61, 0.17 and 0.03 for HP-SLNs
i.n., HP-Sol i.n. and HP-Sol i.v. respectively (Table
TABLE V - Various parameters for calculation of shelf life
Temperature
(ºC) Temperature (ºK) (1/ T) × 10
-3
(ºK-1) Slope × 10
-5 K × 10-4 Log K
25 298 3.355704 -7.1667 1.6505 -3.78239
30 303 3.30033 -7.5 1.7273 -3.76264
40 308 3.246753 -6.6667 1.5353 -3.8138
4 277 3.610183 --- 1.2496 -3.9032
FIGURE 5 - Calibration curve of HP in rat plasma by HPLC
method.
VII). A noteworthy high brain/blood ratio of HP-SLNs could indicate the brain targeting potential of developed SLNs. The HP-Sol also reached directly
in brain to some extent but signiicantly less than
HP-SLNs and it could be due to lipophilic nature of
haloperidol (log p approximately 4). Similar indings
were observed by Kumar et al. (2008).
b) Compared to HP-Sol administered intranasally, the percent relative bioavailability of intranasal HP-SLNs, were found to be 155.32±11.83 and
349.72±26.13 in blood and brain respectively (Table VI). The results revealed a signiicant (P<0.05) en -hancement in the bioavailability of haloperidol in the brain following the intranasal administration of
HP-SLNs. These indings are in line with Abdelbary and
Tadrosd (2013) who found that micellar nanocarriers increase the relatively bioavailability of olanzapine administered intranasally.
c) The DTI, DTE (%) and DTP (%) values were esti -mated to represent the percentage of drug directly transported to the brain via the olfactory or trigemi-nal pathway. The value of DTI, DTE & DTP for HP-SLNs administered intranasally was found to
be 23.62, 2362.43 % & 95.77%. While the value
of DTI, DTE and DTP for HP-Sol administered
intranasally was found to be 11.28, 1128.61% and 91.14% respectively (Table VII). The DTI values >1 could conirm the direct pathway from nose to brain
(Wang, Jiang, Lu, 2003). These indings are in line
with Jain et al. (2010), Kanazawa et al. (2011) who found that micellar nanocarriers of zolmitriptan and coumarin increase the nose-to-brain uptake, via the olfactory region of the nasal cavity. Finally, the
high-er value of DTI, DTE (%) and DTP (%) suggested
that HP-SLNs have better brain targeting potential as compared to HP-Sol administered intranasally.
Similar indings have also been reported previously
by Zhang et al. (2004).
CONCLUSION
A new and simple HPLC method for haloperidol was developed and validated over the concentration range from 1-16 µg/mL. The method was successfully applied for the determination of haloperidol content in SLNs. Calibration curve was also prepared in rat plasma
TABLE VI - Pharmacokinetic parameters of haloperidol in brain and plasma
P’kinetic parameters
Type of formulation/route of administration
HP-SLN i.n.* HP-Sol i.n.# HP-Sol i.v.
Brain Plasma Brain Plasma Brain Plasma
Cmax(ng/mL) 329.17 ± 20.89 393.5 ± 24.63 90.13 ± 6.28 306.96 ± 13.47 76.95 ± 7.62 2190 ± 60.67
Tmax (h) 2 4 2 1 1 0.167
Ke (h
-1) 0.079 ± 0.0065 0.097 ± 0.003 0.077 ± 0.005 0.11 ± 0.003 0.095 ± 0.003 0.15 ± 0.007
AUC0-24 h (ng∙h/mL) 2172.33 ± 60.41 2433.05 ± 18.54 623.16 ± 8.51 1460.71 ± 15.67 433.65 ± 15.46 11464.59 ± 150.45 AUC0-∞ (ng∙h/mL) 2389.17 ± 78.82 2612.31 ± 40.67 683.15 ± 30.17 1681.82 ± 32.83 500.82 ± 12.78 12017.5 ±180.87 Values are mean ± SD, n=6 *� ˂ 0.05 versus HP-Sol i.n., *� ˂ 0.05 versus HP-Sol i.v., #P< 0.05 versus HP-Sol i.v., P< 0.05 results are signiicant
for determination of drug quantitatively. Satisfactory
results were obtained, which signiies the reproducibility,
sensitivity and reliability of method.
ACKNOWLEDGEMENTS
Authors are highly thankful to Management of I.T.S College of Pharmacy, Murad Nagar, Ghaziabad, India for providing research facilities. Authors gratefully acknowledge the name of Prof. S. Sadish Kumar (Principal, I.T.S College of Pharmacy, Murad Nagar, Ghaziabad, India) and Mr. D.S. Jolly (Administrator, I.T.S College of Pharmacy, Murad Nagar, Ghaziabad, India) for their co-operation during the preparation of this research article.
CONFLICT OF INTEREST
All authors have none to declare.
LIST OF ABBREVIATIONS
AUC0-∞ Area under the curve from time 0 to time ininity
AUC0-t Area under the curve from time 0 to time t BBB Blood brain barrier
Cmax Peak of maximum concentration
DTE Drug targeting eiciency
DTI Drug targeting index DTP Direct transport percentage HP Haloperidol
HP-SLNs Haloperidol loaded solid lipid nanoparticles i.n. Intranasal
i.v. Intravenous
RB Relative bioavailability SD Standard deviation SLNs Solid lipid nanoparticles
REFERENCES
ABDELBARY, G.A.; TADROS, M.I. Brain targeting of olanzapine via intranasal delivery of core–shell difunctional block copolymer mixed nanomicellar carriers: In vitro characterization, ex vivo estimation of nasal toxicity and in vivo biodistribution studies. Int. J. Pharm., v.452, n.1, p.300- 310, 2013.
BENVEGNÚ, D.M.; BARCELOS, R.C.; BOUFLEUR, N.; RECKZIEGEL, P.; PASE, C.S.; OURIQUE, A.F. Haloperidol-loaded polysorbate-coated polymeric nanocapsules increase its efficacy in the antipsychotic treatment in rats. Eur. J. Pharm. Biopharm., v.77, n.2, p.332-336, 2011.
CHINESE PHARMACOPOEIA. Chinese Pharmacopoeia Commission. Beijing: Chemical Industry Press, 2005. p.469.
CHOW, H.H.S.; CHEN, Z.; MATSUURA, G.T. Direct transport of cocaine from the nasal cavity to the brain following intranasal cocaine administration in rats. J. Pharm. Sci., v.88, n.8, p.754-758, 1999.
DALILA, M.B.; RAQUEL, C.S.B.; NARDELI, B.; CAMILA, S.P.; PATRÍCIA, R.; FERNANDA, C.F.; ALINE, F.O.; MAGALI, D.N.; CRISTIANE, B.S.; RUY, C.R.B.; MARILISE, E.B. Haloperidol-loaded polysorbate-coated polymeric nanocapsules decrease its adverse motor side efects and oxidative stress markers in rats. Neurochem. Int., v.61, n.5, p.623-631, 2012.
DHURIA, S.V.; HANSON, L.R.; FREY, W.H. Intranasal delivery to the central nervous system: mechanism and experimental considerations. J. Pharm. Sci., v.99, n.99, p.654-1673, 2010.
TABLE VII - Results of brain/blood ratio at 0.5 h, DTI, DTE (%)and DTP (%)
Formulation and route of administration
Brain/blood
ratio at 0.5 h DTI DTE (%) DTP (%)
RB (%)a
Brain Plasma
HP- SLNs i.n. 1.61 23.62 2362.43 95.77 349.72 155.32
HP-Sol i.n. 0.17 11.28 1128.61 91.14 -
-HP-Sol i.v. 0.03 - - - -
EL-DESOKY, H.S.; GHONEIM, M.M. Assay of the anti-psychotic drug haloperidol in bulk form, pharmaceutical formulation and biological fluids using square-wave adsorptive stripping voltammetry at a mercury electrode. J. Pharm. Biomed. Anal., v.38, n.3, p.543-550, 2005.
EUROPEAN PHARMACOPOEIA. Strasbourg: Council of Europe, 2002. p.1288-1289.
FORSMAN, A.O.; Individual variability in response to haloperidol. J. R. Soc. Med., v.69 n.1, p.9-13, 1976.
GAJSKI, G.; GERIĆ, M.; GARAJ-VRHOVAC, V. Evaluation of the in vitro cytogenotoxicity proile of antipsychotic drug haloperidol using human peripheral blood lymphocytes. Environ. Toxicol. Pharmacol., v.38, n.1, p.316-24, 2014.
HAQUE, S.; M.D., S.; SAHNI, J.K.; ALI, J.; BABOOTA, S. Development and evaluation of brain targeted intranasal alginate nanoparticles for treatment of depression. J. Psychiatr. Res., v.48, n.1, p.1-12, 2014.
HUANG, F.; PENG, Y.; JIN, G.; ZHANG, S.; KONG, J. Sensitive detection of haloperidol and hydroxyzine at multi-walled carbon nanotubes-modiied glassy carbon electrodes. Sensors, v.8, n.3, p.1879-1889, 2008.
INTERNATIONAL CONFERENCE ON HARMONIZATION. ICH. Harmonized Tripartite Guideline, validation of analytical procedures: text and methodology Q2 (R1). Geneva: ICH, 2005.
JAIN, R.; NABAR, S.; DANDEKAR, P.; PATRAVALE, V. Micellar nanocarriers: potentialnose-to-brain delivery of zolmitriptan as novel migraine therapy. Pharm. Res., v.27, n.2, p.655-664, 2010.
JAIN, T.; BHANDARI, A.; RAM, V.; SHARMA, S.; CHAUDHARY, R.K.; PARAKH, M. High-performance liquid chromatographic method with diode array detection for quantiication of haloperidol levels in schizophrenic patients during routine clinical practice. J. Bioanal. Biomed., v.3, n.1, p.8-12, 2011.
JANICKI, C.A.; KO, C.T. Haperidol. In: FLOREY, K. (ed.).
Analytical proile of drug substances. New York: Academic Press, 1991. v.9. p.346-356.
KANAZAWA, T.; TAKI, H.; TANAKA, K.; TAKASHIMA, Y.; OKADA, H. Cell-penetratingpeptide-modiied block copolymer micelles promote direct brain delivery via intranasal administration. Pharm. Res., v.28, n.9, p.2130-2139, 2011.
KUMAR, M.; MISRA, A.; BABBAR, A.K.; MISHRA, A.K.; MISHRA, P.; PATHAK, K. Intranasal nanoemulsion based brain targeting drug delivery system of risperidone. Int. J. Pharm., v.358, n.2, p.285-291, 2008.
KUMAR, R.; YASIR, M.; SARAF, S.A.; GAUR, P.K.; KUMAR. Y.; SINGH, A.P. Glyceryl monostearate based nanoparticles of mefenamic acid: Fabrication and in vitro characterization. Drug. Invent. Today., v.5, n.3, p.246-50, 2013.
MD, S.; KHAN, R.A.; MUSTAFA, G.; CHUTTANI, K.; BABOOTA, S.; SAHNI, J.K. Bromocriptine loaded chitosan nanoparticles intended for direct nose to brain delivery: pharmacodynamic, pharmacokinetic and scintigraphy study in mice model. Eur. J. Pharm. Sci., v.48, n.3, p.393-405, 2012.
MIYAZAKI, K.; ARITA, T.; OKA, I.; KOYAMA, T.; YAMASHITA, I. High performance liquid chromatographic determination of haloperidol in plasma. J. Chromatogr., v.223, n.1, p. 449-453, 1981.
MOJTABA, S.; LEILA, S.D.; ZAHRA, T.; SOHEILA, H. 19F
NMR as a powerful technique for the assay of anti-psychotic drug haloperidol in human serum and pharmaceutical formulations. J. Pharm. Biomed. Anal., v.43, n.3, p.1116-1121, 2007.
RAHMAN, N.; KHATOON, A.; RAHMAN, H. Studies on the development of spectrophotometric method for the determination of haloperidol in pharmaceutical preparation. Quím. Nova., v.35, n.2, p.392-397, 2012.
RIBEIRO, F.W.P.; SOARES, J.E.S.; BECKER, H.; SOUZA, D.; LIMA-NETO, P.; CORREIA, A.N. Electrochemical mechanism and kinetics studies of haloperidol and its assay in commercial formulations. Electrochim. Acta., v.56, n.5, p.2036-2044, 2011.
SHAKEEL, F.; BABOOTA, S.; AHUJA, A.; ALI, J.; AQIL, M.;
SHAFIQ, S. Nanoemulsions as vehicles for transdermal
SIGRID, M.; LORETO, P.; MARIO, V.; CARMEN, G.G.; MARTA, D.D. Quantitative determination of haloperidol in tablets by high performance thin-layer chromatography. J. Sep. Sci., v.30, n.5, p.772-777, 2007.
VYAS, T.K.; SHAHIWALA, A.; MARATHE, S.; MISRA, A. Intranasal drug delivery forbrain targeting. Curr. Drug Deliv., v.2, n.1, p.165-175, 2005.
WANG, F.; JIANG, X.; LU, W. Profiles of methotrexate in blood and CSF following intranasal and intravenous administration to rats. Int. J. Pharm., v.263, n.1, p.1-7, 2003.
WANG, X.; CHI, N.; TANG, X. Preparation of estradiol chitosan nanoparticles for improving nasal absorption and brain targeting. Eur. J. Pharm. Biopharm., v.70, n.3, p.735-740, 2008.
WATE, S.P.; BORKAR, A.A. RP-HPLC estimation of haloperidol and trihexyphenidyl in tablets. Int. J. Chem. Tech. Res., v.1, n.6, p.675-676, 2009.
YASIR, M.; SARA, U.V.S. Preparation and optimization of haloperidol loaded solid lipid nanoparticles by Box- Behnken design. J. Pharm. Res., v.7, n.3, p. 551-558, 2013.
YASIR, M.; SARA, U.V.S. Development and validation of UV spectrophotometric method for the estimation of haloperidol.British J. Pharm. Res., v.4, n.11, p.1407-1415, 2014a.
YASIR, M.; SARA, U.V.S. Solid lipid nanoparticles for nose to brain delivery of haloperidol: in vitro drug release and pharmacokinetics evaluation. Acta. Pharm. Sin. B., v.4, n.6, p. 454-463, 2014b.
ZHANG, Q.Z.; JIANG, X.G.; JIANG, W.M.; LU, W.; SU, L.N.; SHI, Z.Q. Preparation of nimodipine-loaded microemulsion for intranasal delivery and evaluation on the targetingeiciency to the brain. Int. J. Pharm., v.275, n.2, p.85-96, 2004.
Received for publication on 21st March 2016