M
ASTER OF
B
USINESS
A
DMINISTRATION
M
AJOR IN
F
INANCE
Master Thesis
MEASURING DRUG RISKS WITH
VaR
–
A CONTRIBUTION FOR THE PORTUGUESE
PUBLIC PRIVATE PARTNERSHIPS
HOSPITALS
Wafa Arif
Dissertation submitted in partial fulfillment of requirements for
the degree of MSc in Business Administration, at Católica Lisbon,
June 2012
Supervisors:
Ph.D. Ricardo Reis
Assistant Professor
Católica Lisbon
MSc. Joaquim Sarmento
Invited Teaching Assistance and Researcher
Católica Lisbon School
ii
ACKNOWLEDGEMENTS
It is a pleasure to thank the many people who made this thesis possible.
I would like to thank my supervisors Professor Ricardo Reis and Professor Joaquim Sarmento for availing this topic, for their time and guidance at the all phases of the thesis.
I would like to express my deepest gratitude to PhD. Professor, Dr. Miguel Gouveia, for his support, patience in explaining things clearly and simply, availability, and providing me with his excellent guidance and atmosphere for completing my dissertation.
I would also like to thank all my friends for their help and support in various manners.
Most importantly, I would like to thank my parents Nyla Bano and Arif Rashid for all their support and love. To them I dedicate this thesis.
Last but not the least, I would like to thank my friend Helena Forte for helping me get through the difficult times, and for all the emotional support, entertainment, care and accompanying me till the last moment. I would also like to thank her for all her help in searching for articles.
iii
ABSTRACT
The aim of this work is to forecast the aggregate expenditure on medicines at the hospital level under the National Health Service (NHS) and thereby, compute the risk (expenditure on medicine consumption to the hospital) through a Value at Risk (VaR) analysis. The expenditure on medicines at the hospital level has been forecasted, by using the data available about the public hospitals under the NHS to get estimates of the variance in the expenditure on medicines used by hospitals. From the results obtained for the risk involved in the public hospitals under the NHS, an insight to the 1st wave hospitals under Public Private Partnerships has been provided in order to tackle the technological risk on medicine consumption. We call this expenditure on consumption of medicines as drugs risk.
An ordinary least square regression has been used to forecast the expenditure on medicines in the hospitals under the NHS. For the purpose of forecasting, three models have been tested. The residuals then obtained from the regressions have been used to compute risk through VaR analysis. This work concludes that public hospitals, regarding drug risks, do not suffer from very high VaR. To what extent do the hospitals under the 1st wave Public Private Partnerships model suffer from technological risk is still a question to answer, to compute the risk for such hospitals more information about the medicine consumption is necessary.
As the hospitals under Public Private Partnerships in Portugal are very recent, no information or data about such hospitals is available. Only data for the public hospitals under the NHS are available, therefore the conclusions pertaining to the Public Private Partnerships are limited.
iv
TABLE OF CONTENTS
1. INTRODUCTION ... 1
1.1 Literature Review ... 2
2. PUBLIC PRIVATE PARTNERSHIPS ... 6
2.1- PPP’s in the Health Sector ... 8
2.1.1 - Overview of PPP/health models over the globe ... 8
2.1.2 - Overview of PPP/health in Portugal ... 8
2.1.3 – Risk sharing structure ... 12
2.1.4 - Criticisms of the 1st wave PPP/health model ... 13
3. DATA AND METHODOLOGY ... 15
3.1 Data ... 15 3.1.1 Infarmed I.P ... 15 3.1.2 Data Collection ... 15 3.2 Methodology ... 16 3.2.1 Variables... 16 3.2.1.1 Dependent Variable ... 16 3.2.1.2 Explanatory Variable ... 17 3.2.1.3 The Model ... 19 3.2.1.4 Tests ... 20 3.3 Volatility Analysis ... 22 4. RESULTS ... 23 5. CONCLUSIONS ... 31 BIBLIOGRAPHY ... 33
v
LIST OF TABLES
Table 1: Investment in construction & expropriation /original hospital equipment (adapted from
dgtf, august 2011) ... 10
Table 2: Payment mechanism under the 1st wave model (adapted from Tribunal de Contas, 2009) . 11 Table 3: Expected vs. Actual duration of phases in the tender process (adapted from Tribunal de Contas, 2009) ... 14
Table 4: Hospitals contribution to Infarmed ... 16
Table 5: Values assumed by variable T in the regression ... 18
Table 6: Summary Statistics of aggregate consumption of medicines in hospitals by month ... 19
Table 7: Descriptive statistics of the model ... 19
Table 8: Estimates of the regression model... 20
Table 9: Results of Heteroskedasticity ... 21
Table 10: Variance of the error ... 21
Table 11: Results of Auto-correlation ... 21
Table 12: Normality test of Errors... 21
Table 13: Test for Arch effects ... 22
Table 14: Statistical Significance of the independent variables ... 23
Table 15: Estimates of regression model with 3m & 12m lag ... 27
vi
LIST OF FIGURES
Figure 1: PSC and value for money (adapted from Grimsey, Lewis 2004)... 7
Figure 2 : Sectoral breakdown of total investment in PPP ... 9
Figure 3: Evolution of future expenditure in PPP’s the health sector in Portugal (in millions of Euros) ... 11
Figure 4: Monthly evolution of aggregate consumption of medicine at hospital level ... 17
Figure 5: Plot of Variance of errors and Value at Risk (VaR) ... 24
Figure 6: Plot of the actual & forecast vs. predicted values of consumption of medicines ... 25
Figure 7: % expenditure in medicines in the hospitals per area of activity ... 26
Figure 8: Plot of the actual & forecast vs. predicted values of consumption of medicines ... 28
Figure 9: Plot of Variance of errors & VaR ... 29
Figure 10: Predicted values of the 3 regression models ... 30
vii
LIST OF ABBREVIATIONS
Infarmed National Authority of Medicines and Health Products (Portugal) NHS National Health Service
PPP’s Public Private Partnerships VaR SPV PSC CNHM AUE Value at Risk
Special Purpose Vehicle Public Sector Comparator
Código Hospitalar Nacional de Medicamentos Autorização de Utilização Excepcional
1
1. INTRODUCTION
HM Treasury (2000) defines Public private Partnerships (PPP’s) as an arrangement that brings public and private sectors together to deliver significantly improved public services, by contributing to increases in the quality and quantity of investment.
The legal instrument underpinning the partnerships most often used in Portugal is the concession of public service, involving, in most cases, the design, financing, construction, maintenance and operation of infrastructure designed to meet the public need in question, being in the sectors of infrastructure for road transport and the uptake and distribution of water and waste treatment where there is a significant part of the contracts already concluded. Besides these two sectors, PPP’s tender were also launched in the health sector (DGTF, 2008).
As has been described later, the clinical services in the Portuguese PPP/health model under the 1st wave are managed by the private sector. Keeping this into consideration, the work tends to identify the technological risk on drugs in the hospitals under PPP. Technology has vast meanings, but here technological risk which is measured through Value at Risk (VaR) is meant to capture the impact of the aggregate cost of medicine consumption which may include any new introduction of drugs, on the costs borne by the concessionaire providing the clinical services.
The question that also arises is, whether the risk and uncertainty involved in innovation of medical technologies should be borne by the private sector (the concessionaire), the public sector or should they be shared between the two? Who should bear the technological risk under the 1st wave PPP/health Portuguese model?
Ideally, in order to measure the technological risk, information about the number of new drugs that are introduced each year should be studied, estimating how much they add to the expenditure of hospitals and the variance of these costs over the years. Due to the unavailability of information it was not possible to capture the effect of a group of new drugs on the expenditure on medicines by the hospitals. Hence, the aim of this work is to forecast the expenditure on medicines at the hospital level using the data available publicly to get estimates of variance in the expenditure on medicines by hospitals and then provide an insight to the 1st wave PPP hospitals about the technological risk involved.
From the results it was found that, considering a 95% confidence level, and the standard deviation estimate, it can be said that 5% of the times, the hospitals loses within the next month, next three months or within the next year, at least 5.0409%, 5.0498% & 4.9785% respectively in January 2012.
2
1.1 Literature Review
Public private partnerships in the health sector have gained attention for some time now due to the two following reasons. Firstly, technological innovation and modernization in the health sector makes it susceptible to financial un-sustainability. Health technologies are all means (material or otherwise) and procedures for the prevention, diagnosis, treatment and rehabilitation of diseases and their consequences. In this sense, health technologies are articulated sets of health care (PNS 2011-2016). Secondly, the health sector faces demographic pressure which implies higher costs of health of the aging population and lower amounts associated with tax payments.
The health sector is subject to a lot of risk and uncertainty due to innovation in health, particularly in the field of medicine. Long-term planning is difficult in the health service because healthcare is changing over time and the local demography may also change. This may affect the optimum type and location of facilities that are required. This exposes the Trust to the risk that it may become locked into a long-term contract for buildings and services that are no longer needed. This issue is not limited to PPP hospitals, but the long-term service contract of a PPP deal makes termination likely to be more expensive (NAO, 2002).
New technologies like improvements in drugs come with at an expense and involve indirect costs like the cost of training and promotion. For a given technology to be adopted, it has to prove not only its relative effectiveness as the most-reasonable (at least) of the budgetary outlay for additional funding from its use. When this is done, we reach the ultimate goal of technology assessment - the hierarchy in terms of cost-effectiveness. In addition, funding agencies also ask for an evaluation of the overall impact of the financing of new technology on your budget. The model underlying this exercise is that proposes to choose the most cost-effective technology for each indication, i.e., that will maximize the given health care budget restrictions, not the least expensive but more efficient, i.e., which has lower costs per unit results (PNS 2011-2016).
There are two kinds of risks/uncertainties borne by the public sector under the PPP contract. First, there are those that remind the Trust of its obligations in relation to specific details of the contract - vis, use of the hospital complex. Second, they provide a further reminder of the wider uncertainties that fall upon the hospital management in relation to clinical and legislated NHS organizational changes. These are highlighted in the PPP contract to make absolutely clear that it is the Trust, not the private sector partner, who bears the full responsibilities for these potential uncertainties (Broadbent, Gill, Laughlin, 2008)
In the U.K, under the PPP it is made very clear that the uncertainty involved with unexpected changes in medical technology is borne by the public sector whereas in Portugal under the 1st wave
3 model there is no evidence about who bears the cost of such uncertainties but with the kind of pressure from the government, usually the private sector has to bear it. Although PPP’s and project finance are of great importance for public policy and have recently gained public eye in Portugal, no quantitative models have been developed to measure the technological risk for PPP in the health sector.
Despite the relevance of the project finance market, so far a formal model to measure the potential losses for lenders supporting project finance deals has not been formally developed. They suggest how VaR for project finance deals may be measured through Monte Carlo simulation, by discussing how default risk could be defined and a loss distribution could be derived (Gatti, Rigamonti, Saita, Senati, 2007).
Every PPP project is subject to an investment appraisal to check its economic prospects and also whether it reflects a value for money. For this reason, (Savvides, 1994) present the methodology and use of Monte Carlo simulation to analyze and evaluate risk of investment projects such as PPP. He concludes that an in depth risk analysis of the project is useful in order to take the correct investment decision. In this way investment opportunities are identified, projects areas that require further investigation are identified and enhance a better risk allocation and management between the parties involved.
More emphasis needs to be placed on strategies for the transfer of risk for the successful conclusion of PPP contracts (Nisar, 2007). To do so, he adopted a case study research to examine the effects of risk transfer on value for money gains of five PPP projects. He concluded that the PPP arrangement is about delivering better services by combining the strengths of the public and private sectors working in partnership, each focusing on the areas it does best. Recognizing the limitations of using a case study approach he also concluded that the approach underlines the role of risk allocation in PPP projects—the party that can manage the risk at the lowest cost should be responsible for it.
The effective introduction of new medicines in the domestic market depends on three elements (Pedro, Luis 2011):
1) Before the medicines may be introduced in the market, they need to satisfy the criterias of safety, efficacy and quality. After satisfying those criteria’s, the market receives the Authorisation of Introduction of Medicines. This barrier is usually defined at the European Union level.
2) The second barrier exists at the national level, where the decision of the reimbursement of the medicines by the NHS has to conform to the existing methodological guidelines, economic evaluation and an evaluation by Infarmed.
4 3) The decision to introduce a new medicine in the Portuguese market depends completely on the marketing of the pharmaceutical company.
The economic evaluation of health technologies: Canada provides guidelines (2006) for the analysts to carry out an economic evaluation for decision-making relevant for the Canadian health care system. Such guidelines apply to a variety of health technologies, including those that promote health, prevent and treat conditions, or improve rehabilitation and long-term care. The Canadian guidelines for the economic evaluation of health technologies set forward evaluations such as the use of a cost-utility analysis (CUA), cost-effectiveness analysis when (CUA) is an inappropriate choice, a cost-minimization analysis (CMA), a cost-benefit analysis (CBA) using sensitivity analysis, but generally, it should be considered as a secondary analysis or a cost-consequence analysis (CCA). Provided that methodologies for incorporating uncertainty into health technology evaluation are not yet well developed, an approach to evaluating health technologies based on the ideas of real options has been put forward. These seek to integrate the uncertainty and irreversibility associated with a technology into a unifying theory of economic evaluation, which offers the decision-maker a systematic framework for handling the degree of uncertainty inherent in evidence on the cost-effectiveness of a health technology. The mathematical form of this process can be written as: d x = α dt + sigma d z. In the simplest form of a Poisson process, a random variable can take only two values and has a fixed probability in each time period of changing from one to the other. This process is used to model situations in which the variable of interest is subject to rare but critical ‘jumps’. In health care, it might for example be used to model the emergence of a new drug which constitutes a discrete shock to the associated market (Palmer, Smith 2000).
The agreement in February, 2006 between the health ministry and the Portuguese Association of Pharmaceutical Industry –APIFARMA, it was intended to limit the growth of expenditure on drugs. The agreement established ceilings to the growth of drugs spending, with the return of funds to the health ministry when the ceiling was exceeded. In March 2007, new regulation for the fixation of prices of the medicines were established by international referencing and the prices discontinued to be fixed price and passed on to be maximum prices. The new agreement in 2011, provides ceilings to the pharmaceutical expenditure borne by the NHS but without a ceiling or growth rate specified for the total expenditure. This feature allows to anticipate a shift to consumption of drugs with lower reimbursements of NHS, that conciles the objectives of growth of activity of pharmaceutical industry with the objective of cost containment of expenditure of NHS with drugs at the expense of a greater financial effort of the citizens (Pedro, Luis 2011).
5 The measures adopted by Portugal with the objective of cost containment mainly in medicines by reducing the process has an indirect cost of potencially delaying the introduction of new medicines in the national market. The existence of low prices in Portugal, from the point of view of the pharmaceutical companies, has created an each a higher temporal gap in the introduction of innovative medicines in the Portugues market, which increases in the approval time until the decision of reimbursement by NHS. Infarmed does not make available information about reimbursements and the time spent in evaluation each request (new medicine). The delay in the decisions of the pharmaceutical companies in introducing new medicines in the various countries has more to do with the price regulation than the authorization process. Portugal registers delay higher than 4 years in many products. For Portugal the average time for the introduction of a new medicine was of 14.2 months. The main alteration in the last decade was the introduction of an economic barrier in the utilization of new medicines at the hospital level (Pedro, Luis 2011).
The paper is organized as follows. Section 2 provides an overview of PPP’s in general and particularly in the health sector in Portugal. Section 3 puts forward the data and methodology for measuring the technological risk. Results and conclusions are given in Section 4 & 5 respectively.
6
2. PUBLIC PRIVATE PARTNERSHIPS
(World Bank, 2007) defines a PPP broadly as an agreement between a government and a private firm under which the private firm delivers an asset, a service, or both, in return for payments contingent to some extent on the long-term quality or other characteristics of outputs delivered. PPP models are used for the development of investment projects of public interest. They attract private capital for the financing of expenditure of public investment and also benefit from the technical capacity and specialization of private entities in the construction and in the management of services, in a context of sharing the associated risk. Such investments that are reversed back to the government are coined as concession, although during the contract term, the building remains with the concessionaire (DGTF, 2008).
The role of PPP’s has become significant ever since the government considered the involvement of the private sector in the delivery of public services. What led the government to such a consideration was the failure in complying by the budget constraints and inefficiency in the completion of the projects built by the public sector on time. Therefore to satisfy the quality and demand of investment in public services and to sustain development and economic growth and to make a better use of the taxpayer’s money, many countries including Portugal considered PPP as a way for the provision of public services. Through PPP’s, the government try to achieve value for money (VFM) which can be explained as providing the services in a much efficient and improved way by using the same amount of funds that the public sector would have used or spent to provide a similar service or project. Under PPP, VFM is achieved by transferring risk and sharing risk best managed by parties involved. Figure 1 below illustrates the value-for-money comparison between a public sector comparator (PSC) and a PPP bid. Assuming all things equal (i.e. quality and risk allocation), value for money is demonstrated when the total present value cost of private sector supply is less than the net present value of the base cost of the service, adjusted for: the cost of risks to be retained by the government; cost adjustments for transferable risks; and competitive neutrality effects (Grimsey, Lewis 2004 p.38).
7 U.K once a pioneer in PPP’s uses the private finance initiative to provide health services to the public. The National Audit Office (NAO, 1999) categorizes risk as design and construction risk, commissioning and operating risks, demand risk, residual value risk, technology/obsolescence risk, regulation risk, project finance risk, risk of contractor default and political/business risk.
N et P re se n t C o st Risk to be transferred to the private sector
Cost Saving Cost of service payments (revenue stream) Competitive neutrality Base costs Risk to be retained by the public sector
Risk to be retained by the public sector
PSC PPP
8
2.1- PPP’s in the Health Sector
2.1.1 - Overview of PPP/health models over the globe
U.K once a pioneer in PPP uses the private finance initiative (PPP) to provide health services to the public. Under PPP/health, the private sector enterprise that will own and run the hospital is not an existing corporation but a new joint venture or consortium known as a Special Purpose Vehicle (SPV). The SPV typically includes construction, IT, medical supplies, domestic services and pharmaceutical corporations (Froud, Shaoul, 2001). The private sector under the PPP in U.K is responsible only for construction and maintenance of the hospital which is transferred back to the government at the end of contract term. The management of clinical services remains in the hands of the public sector. Therefore, the private sector has lower levels of risk.
Australia uses a model similar to that of privatization in which the private sector is also responsible for the provision of the clinical services but the hospital is not transferred back to the government at the end of the contract term. Spain on the other hand uses a model in which the private sector is responsible for the provision of the clinical services and the infrastructure is transferred back to the government at the end of the contract term.
2.1.2 - Overview of PPP/health in Portugal
The Portuguese Health system is characterized by three coexisting systems: the NHS, special social health insurance schemes for certain professions (health subsystems) and voluntary private health insurance.1 The NHS supports primary healthcare, basic and specialized hospital care and continued healthcare which provides universal coverage and free access for all citizen. The Portuguese healthcare system is based on the Public healthcare (NHS) created in 1979 and is financed by taxpayers. The NHS is complemented by an ambulatory medical system.
Drugs in Portugal are authorized through the centralized authorization procedure or through national authorization procedures. In the case of national authorizations, the legal framework establishes that the authorization permits each of the national authorities in Portugal to INFARMED IP, so that the evaluation can be performed in a coordinated manner between different authorities or independently by each, according to the detail (PNS 2011-2016).
Between 2008 and 2010 in Portugal; the amount of net expenditure with PPP has more than doubled, reaching 1,128 million Euros in 2010, representing a high future burden on public accounts. In percentage of GDP, these expenditures have evolved approximately from 0.3% in 2008 to 0.7% in
9 2010. It is worth noting that the value of 2010 represented an increase of approximately 19% compared to the predicted value. (DGTF, 2011)
From the Figure 2 below, it can be seen that the investment in PPP is dominated by the road sector, followed by the railway sector, health sector and lastly by security.
Figure 2 : Sectoral breakdown of total investment in PPP Source: DGTF, 2011
In 2001, Portugal launched a PPP programme for the health sector for the construction and management of new hospitals, including clinical services which came to be known as the First Wave (1st wave). The PPP/health under the 1st wave involved two different bodies which integrated two different objectives. Firstly, the management of clinical services with a contract term of 10 years responsible for clinical services, ancillary services and medical equipment acquisition and replacement. Secondly, construction and management of the hospital infrastructure with a contract term of 30 years responsible for the design, construction and maintenance of the hospital building and fixed equipment. The hospitals under the 1st wave are:
Hospital of Loures
Hospital of Cascais
Hospital of Braga
Hospital of Vila Franca de Xira
10 Hospitals Concessionaire Initial Estimated Investment (Investment – prices of 2010) Construction Infrastructure management Clinical Services management Start End Hospital of Braga
(Groups: Mello, Edifer and Somague)
Escala Braga, Gestora do Edifício S.A.
Escala Braga, Gestora do Estabelecimento S.A
124.4 M€ 2009 2011
Hospital of Loures
(Grupo Espírito Santo – Consis Loures grouping)
HL Sociedade Gestora do Edifício S.A.
SGHL Sociedade Gestora do Hospital de Loures S.A.
86.3 M€ 2009 2012
Hospital of Cascais TDHOSP - Gestão de Edifício Hospitalar, SA
HPP Saúde - Parcerias Cascais, SA
73 M€ 2008 2010
Hospital of V.F.Xira
(led by Mello Group)
Escala Vila Franca - Gestora do Edifício, S.A
Escala Vila Franca – Sociedade Gestora do Estabelecimento, S.A.
76.3 M€ 2010 2013
Table 1: Investment in construction & expropriation /original hospital equipment (adapted from dgtf, august 2011) Source: Direção-Geral dos Tesouro e Finanças
There are two different payment mechanism of the PPP model for a hospital under the 1st wave which are described below and is also demonstrated in table 2:
Annual payment to the clinical SPV
Here the payment mechanism is rigid. The private sector or the hospital receives the same amount of money for any kind of services provided as would be provided by the public sector. Quantity and price for product or service to be sold is negotiated annually. The only way to increase the unit price is through inflation to gain more money but its chances are very low due to the competitive pressure of the tender process. The other way to gain some extra revenue apart from what is fixed is through emergency visits of patients as here the demand is not under control. Other variable revenue could be through discharges, outpatient visits and hospital day sessions. The hospital can provide services to people outside its catchment area up to a maximum of 10%. For example, pregnant women have the right to choose the hospital for the delivery but due to the rigid contract details, if the contract does not include this clause, the hospital is not allowed to accept that pregnant woman.
Annual Payment to the infrastructural SPV
Here the payment depends on the availability. But if the private sector fails to provide the quality expected by the government in the contract, the payments will be subject to deductions.
11 In 2005, the 2nd wave of PPP’s for health came into effect which involved only one management body. Under it, the tender only covers the hospital infrastructure aspect assuming the same responsibility as in 1st wave. Clinical and healthcare provision management remains with the public sector. The 2nd wave includes 5 hospitals of substitution:
Hospital of Algarve
Hospital of Evora
Hospital of Guarda
Hospital of Povoa do Varzim/ Vila do Conde
Hospital of Vila Nova de Gaia
The payment to the infrastructural SPV depends on the availability. Figure 3 below depicts the forecast of costs with PPP in the health system.
Figure 3: Evolution of future expenditure in PPP’s the health sector in Portugal (in millions of Euros) Source: DGTF, 2011
Contract Objective Conception, construction, financing, exploration of the hospitals building
Management of clinical services
Contract Term 30 years 10 years
Responsibility Management entity for infrastructure
Management entity for clinical services
Activity Conception, construction and maintenance of hospital building, hard facilities management and fixed heavy equipments.
Management of hospital, clinical services, soft facilities management
Payment mechanism Payment on availability Associated to clinical activity Table 2: Payment mechanism under the 1st wave model (adapted from Tribunal de Contas, 2009)
12
2.1.3 – Risk sharing structure
The risk sharing structure for the health care services for each hospital under public private partnership as elaborated by (DGTF, 2011) has been described below.
Hospital of Cascais
The risk of providing health care services to residents outside the catchment area is retained in the sphere of the public contractor. Nevertheless, this risk is totally mitigated by imposing a limit of 10% of a predicted production to be provided outside the catchment area. If the effective production is much lower than predicted then this risk is shared, mitigating it partially by imposing deduction on remunerations due to the failure of performance and an obligation of presenting by the private concessionaire of construction of the building of a diagnostic and a corrective measure plan subject to the approval by the public contractor. In what concerns the financial risks, and from the point of view of the public contractor, inflation risk is of particular importance, which is retained by the public contractor, with respect to the evolution of the reference prices associated to health care services.
Hospital of Braga, Loures & (Vila Xira de Franca)
The improper transfer of risks of the users and the provision of health care services to residents outside the catchment area is retained in the sphere of the public contractor. Nevertheless, this risk is totally mitigated by imposing deduction on remunerations for improper transfers and by imposing a limit of 10% of a predicted production to be provided outside the catchment area. The transfer covers 80% (75%) of the total demand risk including namely; the ability to attract users of the catchment area, the guarantee that the installed capacity will meet the predicted production, the integration with the health centers of the catchment area of Hospital of Loures, access to health care services, articulation with the national network of integrated continued care. In what concerns the financial risks, and from the point of view of the public contractor, inflation risk is of particular importance, which is retained by the public contractor, with respect to the evolution of the reference prices associated to health care services.
13
2.1.4 - Criticisms of the 1st wave PPP/health model
The 1st wave PPP model adopted by the then Portuguese government has raised many questions such as “who would be responsible for fixing the characteristics of the construction of the hospital, the government or the private sector due the difference in the contract term of the two management bodies involved in the provision of clinical services and infrastructure” (Tribunal de Contas, 2009).
The (Tribunal de Contas, 2009) also criticizes the government’s decision of the 1st wave model on various other grounds which are as follows:
The government did not have experience in contracting PPP for Health. They used the traditional model for contracting PPP. PPP contracts were established without prior planning.
The government did not study the models used by other countries for PPP/Health. Many countries including United Kingdom that were in this field much before Portugal opted by not including the management of clinical services in the PPP contract.
The Health Ministry did not have experience in evaluating the competition process.
The decisions involved political motives and incentives, not giving priorities to healthcare required by the people of a particular catchment area.
PPP/health lacked a healthcare indicator although public health possessed a lot of experience.
The government signed many contracts at the same time, creating false expectations for the private sector making them spend unnecessary resources and bear excessive costs (in creating structures and in elaborating the proposals).
The projects that the government proposed required both financial and human resources higher than were actually needed.
The government lacked clarity in the definition of objectives, which left the private sector with a lot of doubts, which made it difficult for the private sector to oblige by the stipulated deadlines.
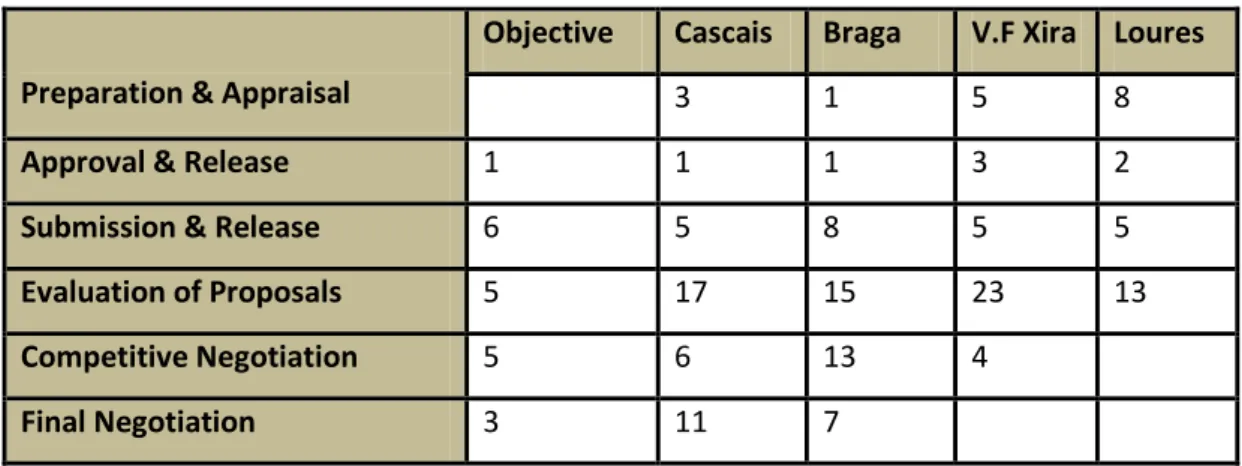
The complexity in the phases of the tender process obligated the government to analyze and evaluate a much more complex negotiation process which created negative repercussions in fulfilling the fixed terms. The performance of the phases involved a tender’s process is depicted in table 3 below.
14
High level of bureaucracy was involved which delayed each level of the competition’s process. 2
Preparation & Appraisal
Objective Cascais Braga V.F Xira Loures
3 1 5 8
Approval & Release 1 1 1 3 2
Submission & Release 6 5 8 5 5
Evaluation of Proposals 5 17 15 23 13
Competitive Negotiation 5 6 13 4
Final Negotiation 3 11 7
Table 3: Expected vs. Actual duration of phases in the tender process (adapted from Tribunal de Contas, 2009)
Another critic of the hospitals under the 1st wave is that each hospital is treated as a case and each case is negotiated separately. This implies the 4 projects under this model may solve the same problem differently. This indicates that the management is not homogenous. Different PPP contracts may have different characteristics. Hospital of Sintra has a very simple contract, they have a separate drugs account. Here the government pays for the extra drugs cost whereas at hospital of Loures, the hospital does not receive any extra payment for providing an innovation, not included in the original contract but made obligatory by the government. The cost of technology (innovation or improvement of drug) has to be treated as an internal cost (has to be included in the price). Contracts are rigid. The health ministry or the finance ministry can stop any innovation or provision of service by the hospital if that service is not mentioned explicitly in the contract. In order for the hospital to be able to provide that innovation or service a 4 or 5 pages long letter needs to be presented to ministry to modify the contract. Changes in common legislation has to be accepted by the hospital but changes in the specific legislation may not necessarily be accepted.
2
List of entities involved:
Ministers of Health and Finance (must approve all the major decisions);
Commissions responsible for the tender documents’ preparation (include members from the health and finance ministries);
Commissions responsible for bid valuation and negotiations (include members from the health and finance ministries);
Departments and entities of the Ministry of Finance (e.g.: Parpública, General Inspectorate of Finance);
Departments and entities from the Ministry of Health (e.g. Regional Health Administrations, Partnerships in Health, Central Health Systems Administration, public hospitals);
Teams of advisors and consultants;
15
3. DATA AND METHODOLOGY
The analysis utilizes data from Infarmed – Autoridade Nacional do Medicamento e Produtos de Saude I.P about the consumption of medicines in hospitals.
In this section, the treatment of the raw database is presented along with some assumptions made to study the volatility of aggregate consumption of medicines by the hospitals under NHS in Portugal and thereby compute VaR. This involves 4 building blocks: data collection and its treatment, model development, volatility analysis and finally tabulating VaR.
3.1 Data
3.1.1 Infarmed I.P
Since the creation if Ordinance No. 155/2007 of January 31, which states that from April 1, 2007, the hospitals and other institutions of the NHS must report compulsorily to INFARMED, on a monthly basis, information on consumption of medicines and hospital care movement.
The data about consumption refers to products covering “Código Hospitalar Nacional de Medicamentos” (CHNM) - Hospital National Drug Code that encompasses medicines of human use with the “Authorisation of Introduction in Market” (AIM), “Autorização de Utilização Especial” (AUE) - Authorization of Special Use and an “Autorização de Utilização Excepcional” (AUE) - Authorization of Exceptional Use. It includes all the medicines dispensed with CHNM by hospitals, whatever the nature of funding. The data related to the consumption of medicines at the hospital level is a project in development, so that the data may be subject to changes arising from the validation of qualitative and quantitative information.3
3.1.2 Data Collection
The sample covers the monthly evolution of the consumption of medicines at the hospital level for the period between January 2007 and December 2011 of the public hospitals under NHS.
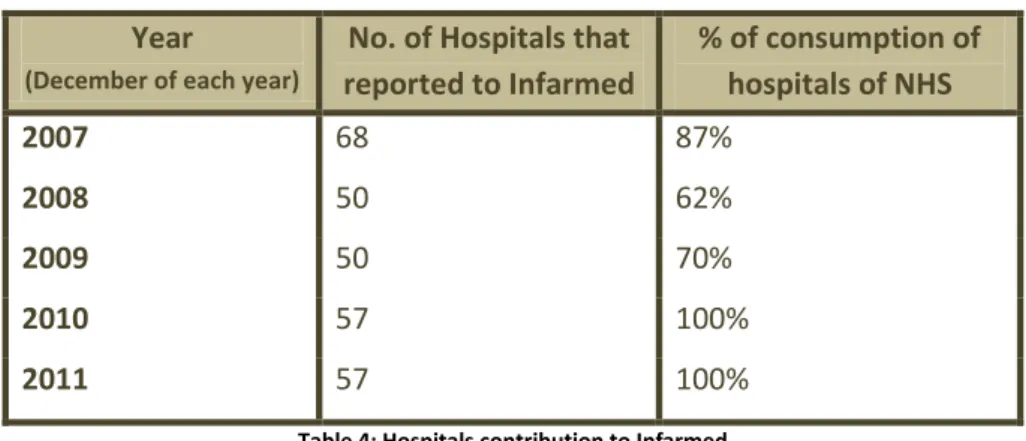
The data that is presented in the monthly reports corresponds to only those hospitals that are able to send information about their consumption of medicines. Due to the inability to send information within the stipulated period of time, some hospitals may not be included in the reports of that month. Therefore the number of hospitals that report to Infarmed each month is different. Due to this reason only the reports of the month of December of each year has been used to collect the data of the monthly consumption of medicines at the hospital level which is illustrated in Table 4.
3
16 Using the report of December of each year, the information about the monthly consumption of medicines, number of hospitals belonging to NHS that reported to Infarmed that month and the percentage of consumption of medicines those hospitals constituted to that month was used.
Year
(December of each year)
No. of Hospitals that reported to Infarmed % of consumption of hospitals of NHS 2007 68 87% 2008 50 62% 2009 50 70% 2010 57 100% 2011 57 100%
Table 4: Hospitals contribution to Infarmed
Information about the accumulated distribution of consumption of medicines is also available per hospital, per area of activity, per healthcare services, per therapeutic classification and per 20 most used active substance. Consumption of orphan medicines, medicines with AUE are also included in the monthly reports. But none of them have been used for the purpose of analysis. It is also necessary to note that none of the hospitals under PPP had reported to Infarmed during the period of 2007 -2011.
3.2 Methodology
3.2.1 Variables
3.2.1.1 Dependent Variable
Aggregate Consumption of medicines in time t –
When a new drug is made available in the market, the NHS may or may adopt those medicines and make it obligatory for the hospitals to provide those new medicines. Once made obligatory, the hospitals necessarily have to provide those medicines when required by the patients of their catchment area. But the provision of this new drug may not necessarily be covered under the PPP contract initially signed upon. Taking into account the uncertainty involved at the hospital level in the introduction of a new drug (new technology), the initial objective of the work was to be able to capture the frequency with which new drugs are introduced in the market and eventually what impact does this unforeseen new drug have on the aggregate expenditure of the hospital.
Due to unavailability of information about the new drugs introduced in a year in the Portuguese market, the aggregate expenditure (consumption) of medicines at the hospital level has been used,
17 which constitutes to be the dependent variable. Therefore the model tends to characterize the volatility in the aggregate expenditure of medicines at the hospital level.
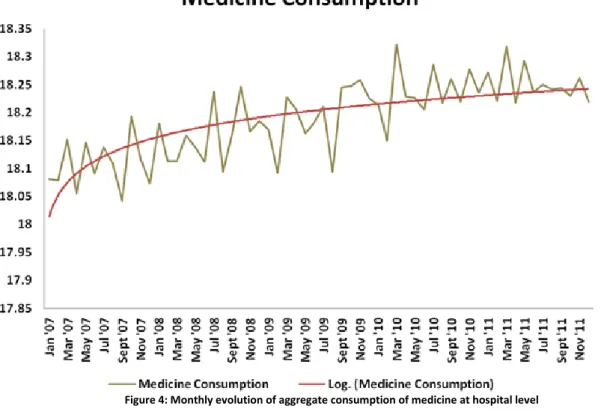
As mentioned above that each month the number of hospitals that report to Infarmed is different which eventually reflects a different percentage of expenditure by hospitals of NHS. So, in order to make the data consistent, the values of the aggregate expenditure on medicines has been made homogenous by dividing it by the % of consumption of hospitals of NHS to obtain a value of what would have the aggregate expenditure on medicines if all the hospitals under the NHS reported to Infarmed each month. Figure 4 plots the monthly evolution of the homogenous aggregate consumption of medicines at the hospital level for the years 2007 – 2011.
Figure 4: Monthly evolution of aggregate consumption of medicine at hospital level
As with many time series there is a common tendency of growing over time, the series graphed above also displays an upward trend (depicted as the Log (Medicine Consumption), which reflects that the consumption of medicines at the hospital level has increased over time.
3.2.1.2 Explanatory Variable
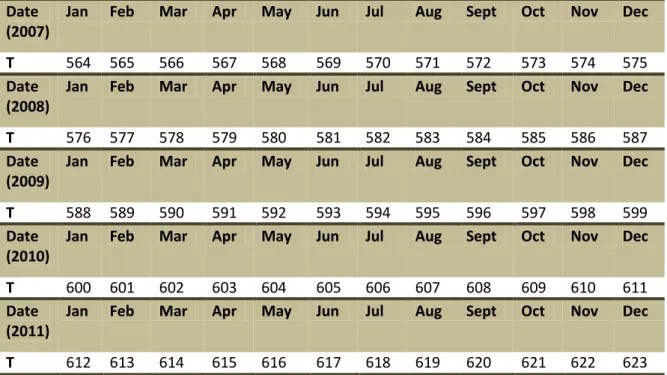
Time - TBy adding a time trend to the regression we can avoid a spurious regression problem, which can be defined as a phenomenon of finding a relationship between two or more trending variables simply because each is growing over time. Therefore, in order to capture the unobserved factors that may systematically be growing or shrinking over time, the time trend has been included to de-trend the
18 model. In STATA, the variable time assumes values between 564 and 583; where 564 is a number allotted to January 2007 and 623 to December 2011.
Date (2007)
Jan Feb Mar Apr May Jun Jul Aug Sept Oct Nov Dec
T 564 565 566 567 568 569 570 571 572 573 574 575
Date (2008)
Jan Feb Mar Apr May Jun Jul Aug Sept Oct Nov Dec
T 576 577 578 579 580 581 582 583 584 585 586 587
Date (2009)
Jan Feb Mar Apr May Jun Jul Aug Sept Oct Nov Dec
T 588 589 590 591 592 593 594 595 596 597 598 599
Date (2010)
Jan Feb Mar Apr May Jun Jul Aug Sept Oct Nov Dec
T 600 601 602 603 604 605 606 607 608 609 610 611
Date (2011)
Jan Feb Mar Apr May Jun Jul Aug Sept Oct Nov Dec
T 612 613 614 615 616 617 618 619 620 621 622 623
Table 5: Values assumed by variable T in the regression
Time before July, 2008 – TB
As can be seen from the figure 4 above, the trend up till some period of time is curved and after that period of time, the trend becomes linear. In order to capture the effect of the curved trend, an additional linear trend has been used. This additional trend is multiplied with a dummy which assumes the value of 1 before the critical point and value of 0 after that critical point. After finding the coefficients of the time on the monthly, July, 2008 has been used as the critical point.
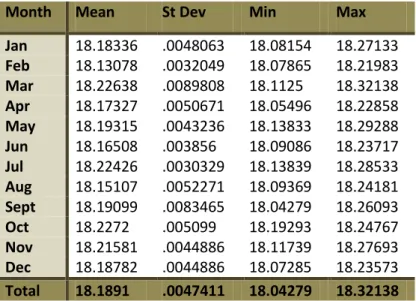
Monthly Dummies –
The monthly time series observed above exhibits seasonality. Therefore to account for seasonality in the aggregate expenditure on medicines in the hospitals – the dependent variable, a set of seasonal dummy variables has been included for de-seasonalizing the data. June has been used as the base month for two purposes: Firstly, it is the median month and secondly, because the average expenditure on medicines in hospitals in the month of June is close to the overall total average expenditure in hospitals between the years 2007-2011. This is depicted in table 6.
19
Month Mean St Dev Min Max Jan 18.18336 .0048063 18.08154 18.27133 Feb 18.13078 .0032049 18.07865 18.21983 Mar 18.22638 .0089808 18.1125 18.32138 Apr 18.17327 .0050671 18.05496 18.22858 May 18.19315 .0043236 18.13833 18.29288 Jun 18.16508 .003856 18.09086 18.23717 Jul 18.22426 .0030329 18.13839 18.28533 Aug 18.15107 .0052271 18.09369 18.24181 Sept 18.19099 .0083465 18.04279 18.26093 Oct 18.2272 .005099 18.19293 18.24767 Nov 18.21581 .0044886 18.11739 18.27693 Dec 18.18782 .0044886 18.07285 18.23573 Total 18.1891 .0047411 18.04279 18.32138
Table 6: Summary Statistics of aggregate consumption of medicines in hospitals by month
Therefore by including time trends and the seasonal dummies in the regression model, the regression uses both de-trended and de-seasonalized series.
Lagged Variable -
As one of the objectives of the work is to forecast the values of aggregate consumption of medicines in hospitals, the lag of the dependent variable has been used which allows varying amounts of recent history to be brought into the forecast. Lagging of the dependent variable was necessary in order for the regression model to be able to predict the future i.e., to predict what will happen in period t based on knowledge of what happened up to period t-1.
The table 7 below provides a summary statistics of the data collected on variables of the model.
3.2.1.3 The Model
An ordinary least square (OLS) regression has been chosen to estimate a model that allows predicting and computing forecast of the aggregate consumption of medicines at the hospital level based on quantified historical data.
The model, which is estimated using an OLS, can be summarized as:
Variable Observations Mean Std. Dev. Min Max AggrConsp 60 18.1891 0.068856 18.04279 18.32138
Time 60 593.5 17.46425 564 623
TB 60 .3 .4621248 0 1
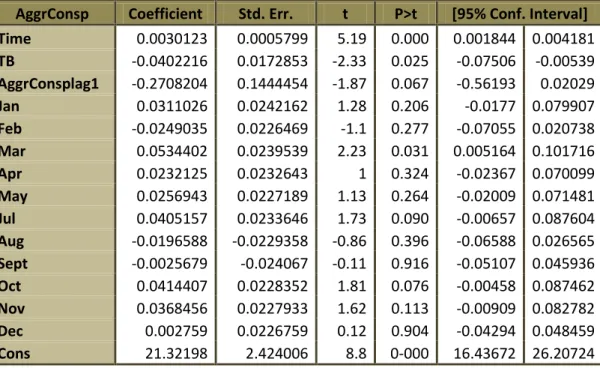
20 Due to the unavailability of data from the PPP hospitals, the model has been estimated econometrically using historical data of the public hospitals under the NHS. Through the estimates of the model and computation of the forecasts, a VaR has been calculated at 95% confidence. An estimate of the regression of the logarithm of the aggregate consumption of medicines at the hospital level has been depicted in table 8.
AggrConsp Coefficient Std. Err. t P>t [95% Conf. Interval] Time 0.0030123 0.0005799 5.19 0.000 0.001844 0.004181 TB -0.0402216 0.0172853 -2.33 0.025 -0.07506 -0.00539 AggrConsplag1 -0.2708204 0.1444454 -1.87 0.067 -0.56193 0.02029 Jan 0.0311026 0.0242162 1.28 0.206 -0.0177 0.079907 Feb -0.0249035 0.0226469 -1.1 0.277 -0.07055 0.020738 Mar 0.0534402 0.0239539 2.23 0.031 0.005164 0.101716 Apr 0.0232125 0.0232643 1 0.324 -0.02367 0.070099 May 0.0256943 0.0227189 1.13 0.264 -0.02009 0.071481 Jul 0.0405157 0.0233646 1.73 0.090 -0.00657 0.087604 Aug -0.0196588 -0.0229358 -0.86 0.396 -0.06588 0.026565 Sept -0.0025679 -0.024067 -0.11 0.916 -0.05107 0.045936 Oct 0.0414407 0.0228352 1.81 0.076 -0.00458 0.087462 Nov 0.0368456 0.0227933 1.62 0.113 -0.00909 0.082782 Dec 0.002759 0.0226759 0.12 0.904 -0.04294 0.048459 Cons 21.32198 2.424006 8.8 0-000 16.43672 26.20724 Table 8: Estimates of the regression model
The model is globally significant with a p-value of 0, RMSE of 0.357, an R-square of 79.08% and an adjusted R-square of 72.42%.
3.2.1.4 Tests
In order to use OLS standard errors, t statistics and F statistics, we need to prove that the OLS coefficients are consistent and unbiased. For this, the model defined above has to comply with all the time series assumptions which are as follows:
Assumption 1 – The time series process follows a model that is linear in parameters.
Assumption 2 - No perfect collinearity among independent variables.
Assumption 3 - Zero conditional mean which implies that the error at time t, is uncorrelated with each explanatory variable in time period.
Assumption 4 – The variance of the error conditional on the independent variables cannot depend on the independent variables and the variance of the error is constant over time. To check for heteroskedasticity the following tests have been performed:
21
Breusch-Pagan test chi2(1) = 0.00 Prob > chi2 = 0.9698
F-statistic – F-test F(1.46) = 0.00 Prob > F = 0.9617
N* version - iid chi2(1) = 0.00 Prob > chi2 = 0.9608 Table 9: Results of Heteroskedasticity
As can be seen from table 9, the p-value of each test is higher than a 5% significance level, which leads to the non-rejection of the null hypothesis of the errors being homoskedastic. This implies that the unobserved variables (errors) of the model have a constant variance over time. The estimate of the variance is depicted in table 10.
Sum of Squared Residuals .056067619 Estimates Variance of Errors 0.0012742
Table 10: Variance of the error
Assumption 5 – The errors in two different periods when conditional on the independent variables are uncorrelated. If they are not then the errors are said to suffer from serial correlation.
Breusch-Godfrey test (p=12) chi2 = 20.982 Prob > chi2 = 0.0506
Durbin-H test (p=12) chi2 = 17.661 Prob > chi2 = 0.1264 Table 11: Results of Auto-correlation
From table 11 we see that the null hypothesis of the errors in different periods being serially correlated is rejected as the p-value for both the tests is higher than a 5% significance level. This implies that the unobserved variables (errors) of the model are not serially correlated. As the model complies with the above assumptions, the estimates from the OLS regression have been used for further analysis.
Assumption 6 – The error is independent of the independent variables and is normally distributed. Performing the Jarque-Bera Test, it was also found that the errors follow a normal distribution. The result of which has been depicted in table 12 below. As statistic does not belong to the critical region of >5.99, there is no reason to reject the null hypothesis of the errors following a normal distribution.
N Skew Kurt J.B Test
59 -0.457817275 0.773403878 3.531494626
22
3.3 Volatility Analysis
The initial approach to calculate the variance for sample period was to use ARCH/GARCH model. Performing the arch test it was found that the model does not suffer from arch effects. This is depicted in table 13.
Arch lm test (p=12) chi2 = 12.927 Prob > chi2 = 0.3743 Table 13: Test for Arch effects
Provided that arch effects do not exist, a more traditional approach has been adopted to compute the volatility through the method of moving volatility. The volatility is tabulated through a moving average of expanding window. It can be explained by computing the variance in which the first observation remains fixed and thereon a new observation is added, thereby expanding the window. The formula is as follows:
Where, = Estimated standard deviation of the window length;
= According to this model is the aggregate consumption of medicines;
= Average of aggregate consumption of medicines of that window length; and = First observation
Therefore, by using the above formula, the variance has been computed for the sample period. VaR is defined as the minimum loss that could occur at a given confidnce level over a specific period. It therefore, specifies the risk faced in this case by the hospitals. Considering a 95% confidence level (with uni-lateral band), and the standard deviation estimate, it can be said that 5% of the times, the hospitals loses within the next month, at least the value of VaR.
VaR has thereby been calculated by computing the standard deviation from the above variances and then multiplying it by a value of 1.644854 which is the inverse of the standard normal cumulative distribution of a probability of 95%.
23
4. RESULTS
The method of OLS chooses the estimates to minimize the sum of squared residuals. From table 5, which depicts the estimates of the regression model and considering a significance level of 5%, it can be seen that the independent variables time, TB (time before June, 2008) and the dummy of the month of March are statistically significant as their p-values are lower than 5%. Although, the variable with a one month lag is not significant at 5% significance level, it is significant at 10%. As aforementioned, It was necessary to include the lagged term in order to compute the forecast of the aggregate consumption of medicines in the hospital sector. The statistical significance of each of the independent variables can be found in the following table 14.
Time TB AggrConsplag1 Jan Feb Mar Apr May Jul Aug Sept Oct Nov Dec
*** ** * - - ** - - * - - * - -
Table 14: Statistical Significance of the independent variables
(*) – statistically significant at 10%, (**) – statistically significant at 5%, (***) – statistically significant at 1% Interpretation of the coefficients:
Time - It is estimated that in average, the aggregate consumption of medicines in the hospital sector increases 0.301% per month after removing seasonality.
Seasonal dummies - It is estimated that in average, the aggregate consumption of medicines in the hospital sector, in relation to June, increases 3.11%, 5.34%, 2.32%, 2.57%, 4.05%, 4.14%, 3.68% and 0.28% in the months of January, March, April, May, July, October, November and December respectively after removing the trend.
Seasonal dummies - It is estimated that in average, the aggregate consumption of medicines in the hospital sector, in relation to June, decreases 2.49%, 1.97% and 0.26% in February, August and September respectively after removing the trend.
TB - It is estimated that in average, the aggregate consumption of medicines in the hospital sector increases 4.02% per month after removing seasonality and the trend.
AggrConsp_lag1 – It is estimated that in average, the aggregate consumption of medicines in the hospital sector in the previous month increases by 1%, the aggregate consumption of medicines in the hospital sector in the current month falls by .2708%.
It is a fact that the consumption of medicines exhibits seasonality. The months of March, July and to some extent the month of October have always been statiscally significant and have a positive coefficient, whereas the months of February and August, although usually never statiscally
24 significant and always a negative coefficient implying that the consumption of medicines in those month decreases. Usually August has low consumption, and that is partially made up in the months July and/or September. As July is a month of holidays, people are usually more available to visit the hospitals for all sorts of tests. February is a smaller month, so the consumption reduces In this month but is compensated later in the March at the beginning of spring.
From Table 10, we saw that the errors do not exhibit ARCH effects, this imples that the errors are not serially correlated and that there no shocks or innovations in the errors. This is also proved by the autocorrelation tests performed above. Although the errors have a constant variance, it does not imply that there is no risk. It just implies that is there may be significantly lower risk. And this can be noted in the Figure 2 below. On computing the volatility of the residuals along time through the method of expanding window, it was found that the errors vary between 0.000868 and 0.001046. VaR varies between 4.8467% and 5.3186%, for the public hospitals under NHS in this analysis. To what extent does the VaR reach for the public private partnership is difficult to assume as no of the hospitals under the PPP’s reported to Infarmed during the period 2007 – 2011. Provided the fact that the contracts once signed by hospitals under PPP’s for the management of the health services, any new introduction of drug in the market would imply an increased costs for the hospitals and thus higher and a more volatile risk. But this can only be tested once the data has been made available for. The figure 5 below plots the VaR and the volatility of the residuals (unobserved variables).
25 The relatively low level of risk involved in the public hospitals under NHS could be due to the fact of the change in the fiscal policy associated with the health sector that was marked in 2006, 2007 & 2011 initially mentioned. The main priority of the health ministry was the cost containment in the public sector of health care, mainly In drugs, be it for outpatient or in hospital. The other objective being, promoting the use of generics, liberalising the sale of drugs not subject to doctors prescription and motivating fall in prices. Reduction of prices acts directly on the price level as a way to induce a shift of demand towards a greater consumption of generic drugs (Pedro, Luis 2011). Therefore, to a greater extent, the fiscal policy of cost containment explains the reason why the there has not been a significant increase in the expenditure on medicines. Figure 6 below plots the actual values from the period between 2007-2011 of the aggregate cosumption of medicines at the level hospital level against the predicted values from the estimates of the coefficients of the regression model for the sample period. The forecasted value of the aggregate consumption of medicines for the years 2012-2015 is also plotted which is followed by the plot of the actual values.
Figure 6: Plot of the actual & forecast vs. predicted values of consumption of medicines
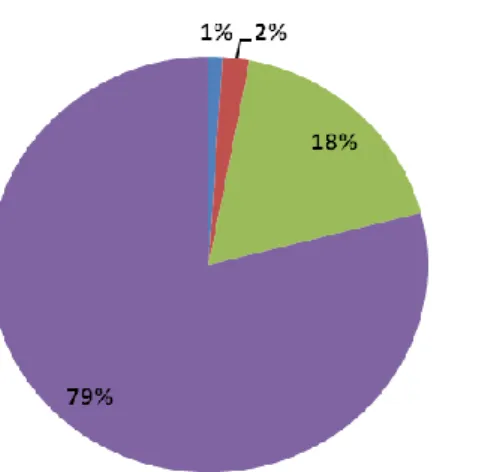
From the figure 4 initially presented and from figure 6 presented above, we find that the hospital market has grown at a steady pace. According to the information available on Infarmed about the consumption drugs for cancer & HIV/AIDS, it can be seen that those two areas of activity represent together about 40% of the aggregate cost of the consumption of medicines in the hospital sector. Hence to some extent the growth in the market of medicines of hospitals could be due the cost related to the consumption of medicines for the therapies of cancer and HIV/AIDS which are usually expensive.
26 Figure 7: % expenditure in medicines in the hospitals per area of activity
From the above figure 7, we can see that oncology & infections (which includes HIV/AIDS) constitute about 40% of the aggregate expenditure of medicines at the hospital level. The main barrier to the growth of the expenditure of medicines at the hospital level, is its economic evaluation as its prior requirement before the usage of a usually expensive new medicine.
Although the original regression model includes a lag of one month for the purpose of predicting the aggregate consumption of medicines at the hospital level, two other models have also been tested, one of which includes a three month lag (season lag) whereas the other model includes a 12 month lag (yearly lag) for the purpose of checking the predictive power of the dependent variable using all other independent variables as before.
27 The results from 3 and 12 month lag model are depicted in the table 15:
AggrConsp Coefficient P>t AggrConsp Coefficient P>t time 0.0011701 0.066 Time 0.0019796 0.015 TB -0.0257016 0.133 TB -0.0287977 0.173 AggrConspLag3 0.4032552 0.01 AggrConspLag12 0.0878286 0.602 Jan 0.038593 0.108 Jan 0.0338152 0.211 Feb -0.0186097 0.441 Feb -0.0285224 0.285 Mar 0.0911832 0.001 Mar 0.0622484 0.035 Apr 0.0278766 0.227 Apr 0.0218556 0.409 May 0.0677839 0.013 May 0.0215219 0.417 Jul 0.0742772 0.003 Jul 0.0466978 0.114 Aug -0.0080959 0.728 Aug -0.031412 0.245 Sept 0.0419755 0.098 Sept 0.0285751 0.289 Oct 0.0531518 0.022 Oct 0.0300198 0.301 Nov 0.0701066 0.011 Nov 0.0346442 0.21 Dec 0.0248464 0.301 Dec 0.0109622 0.68 Cons 10.13159 0 Cons 15.41121 0
Table 15: Estimates of regression model with 3m & 12m lag
The 3month & 12month lag model are globally significant with a p-value of 0 each, RMSE of .03486 and .03656 respectively, an R-square of 79.87% and 71.61% respectively and an adjusted R-square of 73.16% and 59.56% respectively. The statistical significance of each of the independent variables for both the models is depicted in the following table 16.
Time TB AggrConsplag3 Jan Feb Mar Apr May Jul Aug Sept Oct Nov Dec ** - *** - - *** - ** *** - * ** ** - Time TB AggrConsplag12 Jan Feb Mar Apr May Jul Aug Sept Oct Nov Dec
** - - - - ** - - - - - - - -
Table 16: Statistical Significance of the independent variables with 3m & 12m lag
(*) – statistically significant at 10%, (**) – statistically significant at 5%, (***) – statistically significant at 1% On comparing the original monthly model (1 month lag), season and yearly model, it can be noted that the season model has a higher predictive power as 79.87% of the total variation in the aggregate consumption of mdecines at the hospital level is explained by the predictive power of all the independent (explanatory) variables, additionally the mean squared error of the season model is the lowest when compared with the monthly and the yearly model.
Interpretation of the coefficients of the season and yearly model:
Time - It is estimated that in average, the aggregate consumption of medicines in the hospital sector increases 0.117% & 0.19796% per month respectively after removing seasonality.
28 Seasonal dummies - It is estimated that in average, the aggregate consumption of medicines in the hospital sector, in relation to June, increases 3.85% & 3.38%, 2.79% & 2.19%, 6.78% & 2.15%, 7.42% & 4.67%, 4.20% & 2.86%, 5.32% & 3%, 7.01% & 3.46%, 2.48% & 1.10% respectively in the months of January, March, April, May, July, September, October, November and December respectively after removing the trend.
Seasonal dummies - It is estimated that in average, the aggregate consumption of medicines in the hospital sector, in relation to June, decreases 1.86% & 3.85%, 0.81% & 3.14% respectively in February and August respectively after removing the trend.
TB - It is estimated that in average, the aggregate consumption of medicines in the hospital sector decreases 2.57 % & 2.88% respectively after removing seasonality and the trend.
AggrConsplag3 – It is estimated that in average, when the aggregate consumption of medicines in the hospital sector increases by 1% three months before, the aggregate consumption of medicines in the hospital sector in the current month increases by .40325%.
AggrConsplag12 – It is estimated that in average, when the aggregate consumption of medicines in the hospital sector increases by 1% a year ago, the aggregate consumption of medicines in the hospital sector in the current month increases by .08783%.
The following figure 8 plots the actual values of the aggregate consumption of medicines at the hospital level for the sample period of 2007-2011 followed by the forecasted values for 2012-2015 against the predicted values of the sample period.
Season Lag Yearly Lag
Dv
Figure 3a:
29 The volatility and VaR of the aggregate consumption of medicines at the hospital level for season lag and yearly lag has been computed in the same way as that of the monthly lag, i.e. using the moving average - expanding window volatility method. On computing the volatility in the residuals of the regression model for the season and yearly lag it was found that the residuals vary between 0.000906337 - 0.001190102 and 0.000938677 - 0.001190102 respectively. The VaR varies between 4.9519% - 5.6744% and 4.9188% - 5.9583% respectively. The plot of the variance in residuals and VaR of the regression model with season lag and yearly lag is depicted below in figure 9.
Season Lag Yearly Lag
Figure 9: Plot of Variance of errors & VaR
From the figures above, it can be concluded that although not very high but the variance of the errors and the VaR is slightly higher under the yearly lag when compared to the monthly and season lag for the public hospitals under NHS. Therfore, the minimum loss that could occur at a given confidence level over a specific period, considering a 95% confidence level (with uni-lateral band), and the standard deviation estimate, it can be said that 5% of the times, the hospitals loses within the next month, next three months or within the next year, at least 5.0409%, 5.0498% & 4.9785% respectively in January 2012.
In order to compute the veracity of the OLS coefficients, the same econometric tests used for the monthly lag were performed for the season lag and yearly lag. Performing those tests it was found that the errors in two different periods when conditional on the independent variables are uncorrelated and homoskedastic following a normal distribution.
30 Figure 10 below depicts the predicted values of the monthly lag, season lag and yearly lag of the aggregate consumption of medicines at the hospital level for the sample period of 2007-2011.
Figure 10: Predicted values of the 3 regression models
Figure 11 below depicts the forecasted values of the monthly lag, season lag and yearly lag of the aggregate consumption of medicines at the hospital level for period of 2012-2015.