F
ACULTY OFE
NGINEERING OF THEU
NIVERSITY OFP
ORTOComparison of the arterial blood
pressure digital signal acquired using
invasive and non-invasive methods
Raquel Pires Alves
MS
CD
ISSERTATIONIntegrated Master in Bioengineering - Biomedical Engineering Supervisor: PhD. Teresa Henriques
c
Comparison of the arterial blood pressure digital signal
acquired using invasive and non-invasive methods
Raquel Pires Alves
Resumo
A pressão arterial é um sinal vital com relevância clínica significativa, uma vez que está relacionada com mortalidade por causas vasculares ou diversos riscos cardíacos.
O ClearSight System é um sistema que incorpora um dispositivo Nexfin R e mede inúmeros
parâmetros hemodinâmicos de forma contínua através de um sensor de absorção de luz e uma braçadeira de dedo inflável. Este método surgiu como uma alternativa aos métodos invasivos para monitorizar a pressão arterial continuamente evitando as complicações associadas à colocação de um catéter, como sangramento, infecção ou isquemia.
Vários estudos foram realizados para validar a usabilidade do dispositivo Nexfin R,
comparando-o ccomparando-om métcomparando-odcomparando-os certificadcomparando-os e utilizadcomparando-os clinicamente. Essas ccomparando-omparações sãcomparando-o baseadas na variaçãcomparando-o de valores isolados, como valores de pressão arterial média, pressão sistólica e diastólica, débito cardíaco ou índice cardíaco ao longo do tempo.
Este trabalho pretende a validação do dispositivo ClearSight System através da análise da dinâmica das séries temporais de sinais adquiridos continuamente. O objetivo é caracterizar o sinal sincronizado de 14 pacientes submetidos a cirurgia cardíaca. Os dados de pressão arterial foram recolhidos para cada sujeito com técnicas invasivas e não invasivas. As duas séries temporais foram comparadas usando os métodos lineares, de tempo e frequência, e não lineares, incluindo medidas estatísticas, espectrais e de complexidade, como a entropia e a compressão. A correlação das medidas obtidas com os índices de risco também foi analisada.
Foram encontradas diferenças entre os sinais adquiridos pelos dois métodos para todos os índices. Contudo, muitos dos parâmetros apresentam correlações moderadas a elevadas. A corre-lação das medidas obtidas com os índices de risco também foi analisada.
Os resultados obtidos demonstram que o dispositivo Nexfin R capta a dinâmica das séries
temporais de pressão arterial. Além disso, os sinais obtidos pelo método não invasivo relacionam-se com os valores de risco. Em particular, os índices de entropia são associados inversamente com o risco de morbilidade e mortalidade da STS e os índices de compressão são inversamente associados com o tempo que o paciente passou nos cuidados intensivos.
Os resultados sugerem que os dados de pressão arterial recolhidos pelo Nexfi R do ClearSight
System mantêm as dinâmicas lineares e não lineares dos dados e são correlacionados com os índices de risco cardiovascular.
Abstract
Blood Pressure (BP) is one vital sign with significant clinical relevance once its information can be related to vascular mortality or cardiac risks.
The ClearSight system is a setup that incorporates a Nexfin R device, and that measure
nu-merous hemodynamic parameters continuously through a light-absorption sensor and an inflatable finger cuff. It emerged as an alternative to the invasive methods to continuously monitor the blood pressure since it avoids the complications associated with catheter placement such as bleeding, infection, or ischemia.
Several studies have been conducted towards the validation of the usability of the Nexfin method by comparing it with certified and clinically used methods. These comparisons are based on the variation of isolated values such as mean arterial pressure, systolic and diastolic pressures, cardiac output, or cardiac index over time.
This work focus on the validation of the ClearSight System device by analyzing the dynamics of the temporal series of continuously acquired signals. The objective was to characterize the synchronized signal obtained from 14 cardiac surgery patients. The BP data was collect for each subject with both invasive and non-invasive techniques. Both time series are compared using linear, time and frequency domain, and non-linear methods, such as entropy and compression. The correlation of the obtained measures with risk scores was also probed.
Differences were found between the signals collected by the two methods for all the studied indices. However, many of the parameters exhibited moderate to high correlations. The results obtained demonstrate that the Nexfin R device captures the dynamics of the BP signals.
Further-more, the signals acquired by the non-invasive method are related to the risk values. In particular, the entropy measures are inversely related to the Society of Thoracic Surgeons morbidity and mor-tality risk score, and the compression measures are inversely associated with the time spent in the intensive care unit.
The results suggest that the data collected by the Nexfin R device of the ClearSight System
preserves the linear and non-linear data dimensions and that these data are correlated with the patients’ cardiovascular risk assessment.
Acknowledgements
Firstly, I would like to thank Professor Teresa Henriques, my supervisor, for all the guidance throughout this work and for being so understanding and encouraging. It was a pleasure to work with you.
Afterward, I want to leave a thank you note to all my teachers who, during the last 17 years, have led me to my path and to discover my own passions.
Then, I want to thank my parents, my grandmother, and my sister Beatriz for their continuous support and for providing me everything I need to succeed in the future. Also, to the rest of my family, and my godparents who time after time embrace my achievements. A special thanks to my cousins Ana, David, and Nicolas for always trying to teach me through their own experiences.
Finally, I want to thank my friends.
To my all-time girlfriends Diana, Martins, and Sara for being always there, and, particularly, to Bá for this unique and amazing 21-year friendship and for being the person I can always count on. To Tiago, Branco, and Luís for all the times we lived together. To Francisca Albuquerque for being a more than wonderful friend since 2003.
And this 5-year experience would have not been the same without the friends that came out of it. To Leonor for being everything: a twin, a friend, a roommate, a travel buddy, my Erasmus partner, and the one who always understands me. To Pedro for driving me crazy every day but also for being always there for me and knowing me like anyone else. To Pedrão, Migas, Meneses, Gu, Álvaro, Ana, Bruno, Joana, Natalyia with whom I made (and will continue making) the best memories. To Francisca Agante and Francisca Ferreira that had also been a part of this adventure. And finally, to the friends I made during my exchange semester in The Netherlands, especially, Charlotte D., Charlotte B., Mireia, Eva, Belisa, Mònica and Katelynn, with whom I lived the most wonderful time.
If the best is not yet to come at least it was amazing.
“This morning I still have a lot of work to do, I see that it isn’t easy and will no doubt become much more difficult, yet have unfaltering hope that I’ll succeed, and I’m also convinced that I’ll learn to work by working, and that my work will become better and more substantial.”
Contents
1 Introduction 1
1.1 Motivation and context . . . 1
1.2 Goals . . . 2
1.3 Dissertation Structure . . . 2
2 Blood pressure 3 2.1 Introduction . . . 3
2.2 Blood pressure variability . . . 4
2.3 Blood pressure measuring . . . 5
2.3.1 Non-invasive intermittent BP measuring . . . 6
2.3.2 Non-invasive continuous BP measuring . . . 7
2.3.3 Invasive BP measuring . . . 9
2.4 Outcomes: Risk scores . . . 10
3 ClearSight System 11 3.1 ClearSight Systemand Nexfin R . . . . 11
3.1.1 Application . . . 11
3.1.2 Underlying technology . . . 11
3.2 Validation studies . . . 12
4 Signal processing techniques 15 4.1 Introduction . . . 15
4.2 Time domain methods . . . 15
4.3 Frequency domain methods: spectral analysis . . . 16
4.4 Non-linear analyses . . . 17
4.4.1 Entropy measures . . . 17
4.4.2 Compression measures . . . 18
4.5 Association with the outcomes . . . 19
5 Signals pre-processing 21 5.1 Sample population analysis . . . 21
5.2 Signals representation . . . 22
5.3 Data Synchronization . . . 23
5.4 Division into segments . . . 23
6 Signal analysis 25 6.1 Time domain measures . . . 25
6.2 Frequency analysis . . . 26
x CONTENTS
6.4 Entropy analysis . . . 28 6.5 Compression analysis . . . 30 6.6 Association with the outputs: Linear regression . . . 33
7 Discussion 35
8 Conclusion 39
References 41
Appendix A European Society of Hypertension validation procedure phases 49
Appendix B Demographic and clinic characterization of the subjects 51
Appendix C Results: Complementary plots 55
List of Figures
2.1 Diagram with the blood pressure monitoring techniques . . . 5
2.2 Cuff pressure waveform of oscillometric method . . . 6
2.3 T-Line system device for applanation tonometry. . . 7
2.4 Representation of a plethysmograph used in the volume clamp methods. . . 8
2.5 Non-invasive continuous blood pressure measuring techniques: ClearSight System and CNAP R monitor. . . . 8
2.6 Pulmonary arterial catheterization setup. . . 10
5.1 Representation of the raw signals obtained with the PAC and the Nexfin device of the ClearSight System for the MAP, DBP and SBP - example of the patient 5 . . . 22
5.2 Representation of the signals of patient 5 after automatic synchronization. . . 23
6.1 Original and re-sampled signals of the mean arterial blood pressure (MAP) of the Nexfin R device for a segment of patient 2. . . . . 26
6.2 Spectrum of the mean arterial blood pressure (MAP) signals of the invasive method (left) and of the Nexfin R device (right) for a segment of patient 2. . . . 26
6.3 Coherence plot of the mean arterial blood pressure (MAP) signal of segment of patient 2. . . 27
6.4 Sample entropy for scales 1 to 5 for the two methods: invasive arterial blood pressure (IABP) and Nexfin and for the three signal types: mean arterial blood pressure (MAP), diastolic blood pressure (DBP) and systolic blood pressure (SBP). 30 6.5 Compression ratio for scales 1 to 5 for the different signals (mean arterial blood pressure (MAP), diastolic blood pressure (DBP) and systolic blood pressure (SBP)) and for the GZIP and LZMA compressors. . . 31
6.6 Comparison of the two chosen compressors when measuring the Scale 1 ratio, the MSCslopeand the MSCΣof the first five scales ratios. . . 31
C.1 Sample entropy for MAP, DBP and SBP: IABP vs Nexfin . . . 55
C.2 Shannon entropy for MAP, DBP and SBP: IABP vs Nexfin . . . 55
C.3 MSEslope, MSEΣ and MSEslope·Σ(scales 1 to 5) for the three signals (MAP, DBP, SBP) comparing the two methods: IABP and Nexfin . . . 56
C.4 MSCslope, MSCΣand MSCslope·Σ(scales 1 to 5) for the three signals (MAP, DBP, SBP) and the two compressors (GZIP and LZMA) comparing the two methods: IABP and Nexfin . . . 57
List of Tables
2.1 Range of systolic blood pressure (SBP) and diastolic blood pressure (DBP) values: normal, elevated and in hypertension cases [13] . . . 3
5.1 Patient’s clinical characteristics and surgical data . . . 21
6.1 Time domain measures of invasive arterial blood pressure versus noninvasive blood pressure (Nexfin R). P-values in bold are lower than 0.05. . . . 25
6.2 Area of the spectrum in high frequency and mid-frequency regions of invasive arterial blood pressure and noninvasive (Nexfin R) blood pressure signals.
Spear-man correlation and Wilcoxon paired test for the comparison of the two methods. P-values in bold are lower than 0.05 . . . 27 6.3 Coherence between invasive and non-invasive signals. It is presented the median
and quartiles for the average coherence value of each patient’s signal and for the entire spectrum, the HF range and the MF range. . . 27 6.4 Sample entropy for the first differences of the original and surrogate signals. It
is presented the median, the first and third quartiles, the median of difference between the original and the surrogate and its quartiles and the Wilcoxon p-value. P-values in bold are lower than 0.05. . . 28 6.5 Shannon Entropy and Sample Entropy for the mean arterial blood pressure,
di-astolic blood pressure, and systolic blood pressure registered with the invasive method and the Nexfin R device. It is presented the median, the first and third
quar-tiles and the Spearman correlation coefficient (r) and p-value and the Wilcoxon paired test. P-values presented in bold are lower than 0.05. . . 29 6.6 Multiscale entropy measurements for the mean arterial blood pressure, diastolic
blood pressure and systolic blood pressure registered with the invasive method and the Nexfin R device. It is presented the median, the first and third quartiles,
the Spearman correlation (rS) and the Wilcoxon test. P-values in bold are lower
than 0.05. . . 29 6.7 GZIP and LZMA compression measurements of IABP versus Noninvasive (Nexfin R)
signals. P-values in bold are lower than 0.05 . . . 32 6.8 Linear regression standardized coefficients and 95% CI for the association
be-tween the entropy values (SampEn, Shannon entropy, and MSE) and the logarit-mically transformed STS risk for each blood pressure signal. P-values in bold are lower than 0.05. . . 33 6.9 Linear regression standardized coefficients and 95% CI for the association
be-tween the compression measures and the logaritmically transformed ICU time for each blood pressure signal. P-values in bold are lower than 0.05. . . 34
xiv LIST OF TABLES
A.1 Requirements to pass Phase 1 of the European Society of Hypertension validation procedure [84]. At least one of the following 3 conditions must be verified. . . . 49 A.2 Requirements to pass Phase 2.1 of the European Society of Hypertension
valida-tion procedure [84]. The conditions 1, 2 and 3 must be simultaneously verified and 2 out of the conditions 4, 5 and 6 must be confirmed. . . 49 A.3 Requirements to pass Phase 2.2 of the European Society of Hypertension
valida-tion procedure [84]. The conditions must both be simultaneously verified. . . 49
B.1 Demographic and clinic characterization of the subjects to be used on the disser-tation project. . . 51 B.2 Adjustment performed for manual synchronization for each patient. . . 52 B.3 Correspondence between patients and segments and the respective lengths. . . . 53
D.1 Linear regression standardized coefficients and 95% CI for the association be-tween frequency and entropy measures, and the logaritmically transformed time spent in the ICU for each blood pressure signal. P-values in bold are lower than 0.05. . . 60 D.2 Linear regression standardized coefficients and 95% CI for the association
be-tween frequency and compression measures, and the logaritmically transformed STS risk score for each blood pressure signal. P-values in bold are lower than 0.05. 61 D.3 Linear regression standardized coefficients and 95% CI for the association
be-tween entropy and frequency measures, and the logaritmically transformed EU-ROScore for each blood pressure signal. P-values in bold are lower than 0.05. . . 62 D.4 Linear regression standardized coefficients and 95% CI for the association
be-tween the compression measures and the logaritmically transformed EUROScore for each blood pressure signal. P-values in bold are lower than 0.05. . . 63
Abbreviations
ABP Arterial Blood PressureApEn Approximate Entropy
BP Blood Pressure
BPV Blood Pressure Variability
CAB Coronay Artery Bypass
CI Cardiac Index
CNAP Continuous Non-Invasive Arterial Pressure
CO Cardiac Output
DBP Diastolic Blood Pressure
ECG Electrocardiogram
EP Emergency Physician
EuroSCORE European System for Cardiac Operative Risk Evaluation FFT Fast Fourier Transform
HF High Frequency
HR Heart-Rate
IABP Invasive Arterial Blood Pressure
ICU Intensive Care Unit
LF Low Frequency
MAP Mean Arterial Pressure
MF Mid-Frequency
MSC Multiscale Compression
MSE Multiscale Entropy
NIBP Non-invasive Intermittent Method PAC Pulmonary Arterial Catheterization PiCCO Pulse Contour Cardiac Output Monitoring SampEn Sample Entropy
SBP Systolic Blood Pressure SSR Sum of Squared Residuals
STD Standard Deviation
STS Society of Thoracic Surgeons
SV Stroke Volume
Chapter 1
Introduction
1.1
Motivation and context
Blood pressure (BP) is one of the most important physiological signals with high clinical relevance. Its information can help the diagnosis of several diseases by giving valuable information on the heart condition, including blood vessels’ walls thickness or clogging and pumping strength [1,2].
Several methods can be used to assess the blood pressure, whether invasive or non-invasive and provide continuous or intermittent results [3].
In perioperative periods, the gold-standard method for measuring the BP is done by the place-ment of an intra-arterial catheter by a skilled clinician. This invasive procedure is associated with a risk of complications, including bleeding, infection, or ischemia. There is also proneness to measurement error as a result of the position variability within the vessel, perturbations in blood flow, and the frequency response of the transducer and ampifier [4].
Several devices that combine a non-invasive method with a continuous data collection are being developed to overcome the problems that can appear with the invasive procedure. However, to include these new methods in the actual clinical routines, the accuracy of the data must be verified as well as within patient’s precision.
One of these devices that uses the volume clamp method to continuously measure the BP and a physical principle for initial and constant calibration is the ClearSight System. ClearSight is a system with an inflatable finger cuff that incorporates a Nexfin R device and measures cardiac
output (CO) continuously with a light-absorption sensor by combining continuous BP monitoring with a novel pulse contour method. The Nexfin R device measures different parameters including
continuous systolic BP (SBP), diastolic BP (DBP) and mean arterial BP (MAP) [5].
Several studies have been conducted to validate the usability of this non-invasive method (the Nexfin R device) by comparing it with invasive methods [6,7,8,9,10,11]. The comparisons are
based on the variation of isolated values such as MAP, systolic and diastolic pressures, CO, or cardiac index (CI) over time.
2 Introduction
1.2
Goals
The goal of this work is to validate the BP data from the ClearSight System device by com-paring the collected data signals to the gold-standard signals, invasively recorded. For that, several parameters will be collected from signals of both methods and compared. This will be done by analysing the dynamic of the temporal series, using frequency, variability, statistical and com-plexity measures, in order to establish a comparison based on the whole continuous signal. Sub-sequently, the relationship between those parameters and three different outputs: the Society of Thoracic Surgeons (STS) risk of mortality, the European system for cardiac operative risk evalua-tion (EUROScore) and the patient’s time in the intensive care unit (ICU), will be studied.
Several tasks were outlined to asses these goals. The first one consists on the synchroniza-tion of the signals collected with the ClearSight System and the pulmonary arterial catheteriza-tion (PAC) method, Afterward, the selected linear and non-linear methods will be applied to the selected and pre-processed data. Third, the results obtained for the types of signals will be com-pared. Finally, in the fourth task, the risk indices information is going to be used to establish a relation between the used method and the obtained results to extract some conclusions.
Having this in mind, this work prospects in finding a new approach to validate the pertinence of the ClearSight System data in a preoperative setting.
1.3
Dissertation Structure
This work was divided into seven more chapters besides this introductory one.
Initially, Chapter2presentes relevant information on blood pressure, its variability, the mea-surement techniques, and values that can be recorded, and also how they can be related to different outcomes.
Chapter3explains, in detail, the ClearSight System and the Nexfin R device, its applications,
and underlying technology, as well as the validation studies performed so far.
Chapter4shows the different signal processing techniques described, as well as the practical procedure used.
Chapter 5 presents the pre-processing mechanism and how the signals were treated before applying the techniques described in the previous chapter.
Afterward, Chapter6presents the results obtained for the different work phases and a brief description of them.
In Chapter7, the results are discussed. Also, it is described the limitations faced throughout this work and how it can be improved in the future.
Finally, Chapter 8 presents the conclusions of the work developed under the scope of this dissertation.
Chapter 2
Blood pressure
2.1
Introduction
BP is expressed in systolic blood pressure (SBP) and diastolic blood pressure (DBP). SBP is the highest value of pressure during one heart cycle which corresponds to the heart muscle contraction. On the other hand, DBP is the lowest value of pressure between two heartbeats, which corresponds to when the heart chambers are being filled with blood [12]. The mean arterial blood pressure (MAP) is the average BP in an individual during a single cardiac cycle. It can also be described in function of the SBP and the DBP, as seen in equation12.1.
MAP=1
3(SBP − DBP) + DBP (2.1)
When the measures of both SBP and DBP are higher than usual a patient is diagnosed with hypertension. The normal and hypertensive values of SBP and DBP are registered in Table2.1.
Hypertension
Normal Average Elevated Stage 1 Stage 2
SBP 120mmHg 120-129mmHg 130-139mmHg +140mmHg
DBP 80mmHg - 80-89mmHg +90mmHg
Table 2.1: Range of systolic blood pressure (SBP) and diastolic blood pressure (DBP) values: normal, elevated and in hypertension cases [13]
Higher blood pressures and hypertension are associated with a higher incidence of compli-cations and diseases such as coronary heart disease, stroke, and all cardiovascular diseases [14]. They also represent a major risk factor for cardiovascular morbidity, chronic kidney disease, and death [15].
1https://www.nursingcenter.com/ncblog/december-2011/calculating-the-map (last
4 Blood pressure
Furthermore, a sudden elevation of the arterial BP (SBP or DBP), called a hypertensive emer-gency, can be related to life-threatening symptoms and spontaneous deaths. A patient with a hypertensive emergency should be hospitalized with continuous and thorough BP measuring [16]. Studies have found that SBP was more strongly associated with coronary heart disease death when compared to DBP, and isolated SBP elevation was found to be an important risk factor [17]. Moreover, there is evidence that treatments performed under local or general anesthesia may stress the cardiovascular system and, in general, increase the BP [18].
Despite these BP-triggering situations, it is important to know that BP is not constant through-out the day and, even if low, its variations can also infer abthrough-out the patient’s health [19]. Some reports have demonstrated that excessive fluctuations in BP values can be linked to early stages of myocardial, vascular, and renal organs damages [20] and other increases in mortality and cardio-vascular events [21].
2.2
Blood pressure variability
As mentioned above, BP is not constant; it can change during several activities in response to autonomic, humoral, mechanical, myogenic, and environmental stimuli and, in a way, unique to each person [19,22,23].
BP can be characterized by its short-term fluctuations that occur within a 24h period (beat-to-beat, minute-to-minute, hour-to-hour, and day-to-night changes) and also long-term fluctuations occurring over more extended periods (days, weeks, months, seasons or years) [24]. The short-term variations can result from changes in heart-rate (HR), stroke volume, and systemic vascular resistance (concepts that are going to be explored further on) in response to external and internal stimuli [22].
Long-term fluctuations in BP occur when the baroreflex system, the homeostatic system re-sponsible for maintaining the BP nearly constant, is unable to induce the feedback mechanisms that act on the HR and cardiac output to restore stability [25].
The Mayer waves are a representation of the variability noticeable in the BP signal and in the electrocardiogram (ECG). The waves appear in frequencies around 0.1Hz and can be a result of the feedback of several systems, such as the baroreceptor, chemoreceptor and centrogenic feedback systems [26]. Throughout the years, the shift of the Mayer wave frequencies to lower values is being linked to the increased risk of cardiovascular diseases [27].
Even though, in general, the adverse cardiovascular consequences of BP abnormalities largely depend on absolute BP values (MAP, DBP, and SBP), these outcomes might also depend on ele-vated and recurrent BP variability (BPV) [24].
Several studies report that enhanced fluctuation of BP confer cardiovascular risk and can in-duce left ventricular hypertrophy, vascular stiffness, and renal lesion [21, 22]. Both short-term and long-term BP excessive variability independently contributes to target organ damage (TOD), cardiovascular events, and mortality not only in hypertensive patients but also in subjects with diabetes mellitusand chronic kidney disease [21,28].
2.3 Blood pressure measuring 5
In 2006, Young et al. [29] confirmed that the severity of hypertension is more closely related to a 24h mean BP than to single BP values. They also provide the first unequivocal demonstration that TOD is also connected to BP variability. This information reveals its utmost importance on the use of ambulatory BP measurement techniques to support the diagnosis of several conditions, including hypertension.
Furthermore, the study by Young et al. mentioned a cardiac metabolic gene that exhibits a cir-cadian variation2by anticipating the changes in myocardial workload, synchronizing the substrate availability accordingly [29].
Considering that high BPVs strike a relevant cardiovascular risk factor [19], it is considered that the antihypertensive treatment should not only target reducing mean BP levels but also to stabilizing BPV to achieve consistent BP control over time [24]. In 2013, Hocht et al. stated that calcium channel blockers appear to be more effective than other BP lowering drugs for the reduction of short-term and long-term BPVs [21].
2.3
Blood pressure measuring
Monitoring the hemodynamic activity is a mainstay not only of critically ill patients but also as a routine analysis to detect heart-related diseases or malfunctions that can also impair the function of vital organs, such as the brain, heart, and kidneys [3].
The techniques used vary on the application and state of the patient and can be divided in non-invasive and non-invasive. The non-non-invasive methods can use intermittent and continuous techniques to measure the BP. All invasive methods provide continuous measures.
Figure 2.1: Diagram with the blood pressure monitoring techniques
The non-invasive intermittent measures are done with an inflatable cuff recurring to a stetho-scope - manual or clinical method - or with the oscillometric approach - automated or ambula-tory method. The non-invasive continuous methods can use either the volume clamp method or the arterial applanation tonometry (manual or automated). Finally, the invasive methods are the
6 Blood pressure
pulmonary arterial catheterization (PAC) and the transcardiopulmonar dilution. The diagram in Figure2.1has the distribution of these techniques.
2.3.1 Non-invasive intermittent BP measuring
BP has been traditionally measured in the clinical setting. However, recent technology im-provements made it possible to be measured at home or in an ambulatory environment with high accuracy, improving the ability to evaluate the risk for target organ damage and hypertension re-lated morbidity and mortality [30].
The clinical (manual) and the ambulatory (automated) measures of BP are done using an in-flatable cuff tied around the patient’s arm that is inflated occluding a major artery. When the pressure in the cuff slowly decreases, blood will begin to flow through the artery causing char-acteristic sounds - Korotkoff sounds - and the pressure in the cuff when blood first starts to flow continuously is an estimate of diastolic pressure [31]. The onset of the sounds corresponds to the patients’ SBP, and the last sound at decreasing cuff pressure equals the patients’ DBP [3].
The clinical measure of BP is done using a stethoscope and a mercury sphygmomanometer. In this method and during the cuff’s deflation, the clinical practitioner uses a stethoscope to note the circulation sounds and the manometer display to make the correspondence between sound and pressure.
Conventionally, this procedure is done by a trained professional and, to avoid measurement errors, the cuff should have an appropriate size, the patient should be correctly positioned, rested, and should avert extraneous factors that influence blood pressure such as smoking and caffeine intake prior to the measurement [30].
Figure 2.2: Cuff pressure waveform of oscillometric method [32]
The SBP can be estimated without the use of a stethoscope by feeling the radial pulse when the cuff is being deflated. This technique is not commonly used and also requires a quiet environment. The ambulatory/automated measure of the BP uses the oscillometric method that establishes a correspondence between the pressure oscillations registered during the cuff’s deflation and the BP. The mean BP corresponds to the highest peak on the oscillometric wave [33], and the DBP
2.3 Blood pressure measuring 7
and SBP are respectively, the pressure values for the 50% and 80% of the peak value in the oscil-lometric wave [34,32] as it can be seen on Figure2.2.
The ambulatory measuring is used to measure the BP at regular intervals to reduce sudden BP elevations or the white coat hypertension3. It requires the use of fully automated oscillometric devices that have been developed throughout the years [35]. Usually, these can be found in the form of a small cuff with an automated inflatable mechanism and an electronic equipment with a display screen, avoiding the problem of mercury toxicity related to the use of a mercury sphygmo-manometer. They use the oscillometric method incorporated in a software that provides measures of SBP, DBP, and HR with high accuracy.
2.3.2 Non-invasive continuous BP measuring
Non-invasive continuous BP measuring techniques are the most recent ones and least used since their clinical validation still has not provided the expected and wanted results. These mea-surements can be based on two different techniques: the arterial applanation tonometry or the volume clamp method.
The arterial applanation tonometry is a technique based on the work of Pressman and Newgard [36]. They found that a transducer strapped to an artery with a bone underneath can obtain the ar-terial pulse wave. The technique can estimate the mean arar-terial pressure and allows the calculation of the SBP and DBP.
The pulse wave obtained by applanation tonometry contains more information than the SBP and DBP values. However, and despite being considered continuous BP measure techniques, these devices are made for a single timed interval analysis as they have to be handheld by the examiner. One of the devices that uses the automated radial artery applanation tonometry is the T-Line system, represented in Figure2.3. This system has been evaluated in various clinical settings.
Figure 2.3: T-Line system device for applanation tonometry [37].
The second technique for non-invasive continuous BP measurement is the volume clamp method (or vascular unloading technology) based on the work done by Penáz [38].
8 Blood pressure
Figure 2.4: Representation of a plethysmograph used in the volume clamp methods4
The BP is measured with an inflatable cuff combined with a light source and photodiode placed at the finger. Figure2.4contains a representation of the setup. The plethysmograph uses the photodiode’s information to measure changes in volume so that the pressure of the cuff can be adjusted to keep the artery’s diameter constant. This is done by keeping the pressure in the cuff at the exact point where the finger does not show any more pulsations and there is no tension of the arterial wall. The pressure in the cuff follows the instantaneous value of intra-arterial BP. Afterward, with its changes, it is possible to create a BP curve that can be correlated to brachial artery BP through a reconstruction algorithm.
The devices in the market that are based on this technique are the ClearSight System4 (Ed-wards, Irvine, CA, USA) and the CNAP R monitor5(CNSystems Medizintechnik AG, Graz, Aus-tria), shown in Figure2.5. The former will be described in detail in the next chapter.
Figure 2.5: Non-invasive continuous blood pressure measuring techniques: ClearSight System4 (left) and CNAP R monitor5(right).
Both this methods measure the BP, HR, hemodynamics and fluid status, however, their big-ger differentiation comes in the calibration method. The ClearSight System uses the Physiocal R
method for initial and frequent calibration, whereas, the CNAP R monitor provides manual
cal-ibration, where the BP is measured externally and then the value is inserted in the system, or automatic calibration that uses an upper arm cuff to register the initial BP values.
These continuous non-invasive methods to monitor the BP are sensitive to the movement of
4https://www.edwards.com/gb/devices/Hemodynamic-Monitoring/clearsight (last accessed
Feb 2020)
2.3 Blood pressure measuring 9
the patient, meaning that the values obtained for conscious individuals must be checked for plausi-bility. Furthermore, in the case of severe vasoconstriction, peripheral vascular disease, or distorted fingers due to arthritis, it might be difficult for the devices to obtain valid values and waveforms.
2.3.3 Invasive BP measuring
As a counterpoint to the non-invasive methods, there are the PAC and the transcardiopulmonar dilution methods. Both provide continuous hemodynamic measurements (beat to beat, including during the night)[39]. A study done in 2012 demonstrated that continuous measurement of BP detected hypotensive phases in 39% of the cases, whereas only 9% were detected using an in-termittent method [40]. The invasive BP monitoring is usually indicated in the case of high-risk patients or complex surgical procedures. Most anesthesiologists recommend BP monitoring at least once every 5min in anesthetized patients undergoing surgical procedures [41].
The PAC consists of the insertion of a catheter into a pulmonary artery and is considered the standard for assessing CO, stroke volume (SV), systemic vascular resistance (SVR), and cal-culation of oxygen transport parameters in recent years [42]. The Swan Ganz catheter with an inflatable balloon at the tip that facilitates its placement into the pulmonary artery is the most commonly used one. This procedure, despite simple, requires some training and experience to avoid complications [43]. A study revealed that the incidence of Swan-Ganz catheter-associated pulmonary artery rupture is 0.031% [44].
The transcardiopulmonar thermal indicator dilution [42] is a method that uses a cold drug and a specific thermodilution arterial catheter (Pulse Contour Cardiac Output Monitoring, PiCCO) that measures temperature changes following the injection of the drug through a central vein catheter [45]. In some cases, the drug can be combined with a dye whose concentration is followed through time.
The setup required for these invasive methods is displayed in Figure 2.6. The transducer receives the reference pressure through the pressure bag containing a saline solution at 30mmHg. The transducer then converts the BP variations, captured through the catheter, into a digital signal that is amplified and displayed in the monitor6.
These invasive procedures are associated with an increased risk of complications resulting in catheter placement which may include bleeding, infection, or ischemia. In addition, the measure-ment can suffer variations as a result of the position variability of the catheter within the vessel, perturbations in blood flow, and the frequency response of the transducer and amplifier [4]. To avoid the invasive procedure but still provide a continuous BP measure, numerous devices are being developed in the last years. The bigger challenge still resides in the accuracy of the data collected.
10 Blood pressure
Figure 2.6: Pulmonary arterial catheterization setup.
2.4
Outcomes: Risk scores
The Society of Thoracic Surgeons (STS) Short-Term Risk and the EuroSCORE (European system for cardiac operative risk evaluation) are two indices that provide the risk of mortality and morbidities for a patient undergoing cardiac surgeries. They allow the identification of high-risk or “inoperable” patients [46]. These models serve as a statistical tool to account for the impact of a certain procedure on the patient’s overall health7[47]. However, the STS morbidity and mortality risk score can only be calculated for patients undergoing certain types of surgery such as coronay artery bypass (CAB)8, aortic and mitral valve procures.
Some studies reveal that the predictive power of the EuroSCORE is excellent, but usually, mortality is considerably overestimated by this score [48]. The mean EuroSCORE values are, in general, three times higher than the mean STS score values, and there is a reasonable linear relationship between them [46].
In addition, despite not being a risk score, the time a patient spends in ICU can be an indicator of his health state and his reaction to the surgery. Therefore, it can also be used as a parameter to assess the overall surgery risk and recovery.
7https://www.sts.org/resources/risk-calculator(last accessed Feb 2020)
8CAB is a surgical procedure done to restore the normal blood flow in an obstructed coronary artery, by grafting
Chapter 3
ClearSight System
3.1
ClearSight System and Nexfin
RThe volume clamp method - the finger cuff technology - allows for blood pressure to be measured non-invasively and continuously [49]. Devices such as the ClearSight System and the CNAP monitor that use this technology have been clinically tested, validated, and used in various settings [49, 50, 51]. Several tests made confirmed that these systems had the ability to track changes in blood pressure adequately, but the accuracy and precision of the data raised some concerns.
3.1.1 Application
The ClearSight System is indicated for patients going through moderated-risk surgeries that can not have an arterial catheter placed (arterial line) or whose use is not recommended. This system allows the monitoring of the different hemodynamic parameters [5], including the SV and SV variation, the CO, the SVR, the continuous BP. The system also gives valuable hemodynamic insight in moderate to high-risk surgery1.
The ClearSight System incorporates the Nexfin R (BMEYE, Edwards, USA) monitor that
pro-vides the continuous BP waveform as well as the values of SBP, DBP, MAP, HR, and interbeat interval2. The EV1000 clinical platform, incorporated in the monitor, allows the visualization of the chosen parameters in a multi-option screen1.
3.1.2 Underlying technology
As mentioned before, this technology is based on two methods: the volume clamp method to continuously measure BP [52] and the Physiocal R method for initial and frequent calibration
[53].
1https://www.edwards.com/gb/devices/Hemodynamic-Monitoring/EV1000 (last accessed Feb
2020)
12 ClearSight System
The volume clamp method involves clamping the artery providing equally distributed pressure on the arterial walls so that the volume of blood circulating in the artery remains constant. The volume is measured by a photo-plethysmograph built into the cuff, and the pressure is regulated upon these values [53]. This adjustment is made 1000 times per second.
Physiocal R is the real-time method to determine the arterial volume, considering the absence
of a pressure gradient across the arterial wall. This method analyzes the curvature and sharpness of the plethysmogram and recalibrates the system automatically and periodically, allowing accurate tracking of physiologic variations [53,6]. The Nexfin R monitor performs a brachial artery BP
reconstruction since the finger arterial pressures usually differ physiologically from more proximal sites due to the narrowing of the arteries. That may result in more peaked wave shapes as well as decreasing mean BP. These effects are compensated using physiologic models [54], and that is the main difference in this technology when compared to previous products in the market, such as the Finapres R [55].
3.2
Validation studies
The introduction in the market of the Nexfin R Monitor with the CO-trek to monitor BP and
CO occurred in 2007. Later in 2014, with the incorporation of the EV100 clinical platform, the ClearSight System entered the market3. This way, between 2009 and 2012, several studies were performed to validate the results obtained with the Nexfin R Monitor.
Regarding the comparison between the Nexfin R BP measurements and the BP obtained with
a non-invasive intermittent method (NIBP), there are three works published.
The study done by Nowak et al. [56] in 2012 involved 40 emergency patients that had their CO and SVR estimated by an emergency physician (EP) and measured by the Nexfin R monitor
in a baseline and after 2 hours of emergency assessment and treatment. This study stated that the values of CO and SVR estimated by the EPs and measured with the Nexfin R varied significantly,
having an approximate agreement rate of 50%. In general, the EPs underestimated the seriousness of the results. The inability of EPs to accurately estimate these values was also reported with PAC measures - the gold standard, presenting similar results. It was concluded that the clinical assessment of hemodynamics depended on the treating doctor and are not accurate. This way, the use of a technology like the Nexfin R can provide objective and reliable results to assess CO and
SVR.
In 2009, Akkermans et al. presented a study [57] where the values of SBP and DBP measured in 33 volunteers with a mercury sphygmomanometer were compared with the ones measured with the Nexfin R device. The Nexfin R passed phases 1 and 2.1 of the validation procedure of
the European Society of Hypertension but did not pass phase 2.2 that is related to the variations within-subject. The European Society of Hypertension requirements for each phase are described
3https://www.edwards.com/gb/devices/Hemodynamic-Monitoring/clearsight (last accessed
3.2 Validation studies 13
in Appendix A. Despite not meeting all the consitions, the study concluded that the Nexfin R
device could be of value in a research setting or as a clinical BP monitoring system.
Eeftinck et al. presented a study in 2009 [55] where the Nexfin R device was compared with
auscultatory BP measurements of 104 subjects. The differences (median and quartiles) between the two measurement methods were 5.4 (–1.7, 11.0) mmHg and –2.5 (–7.6, 2.3) mmHg for systolic and diastolic BP, respectively. They concluded that the Nexfin R device provided accurate results
with good within-subject precision.
Several studies also compared the Nexfin R device with the gold standard for continuous BP
measures - the PAC method.
In 2012, Martina et al. published a paper [6] where the two methods were compared in car-diothoracic surgery patients for 30 minutes. The results revealed that the correlation coefficients were 0.96 for SBP, 0.93 for DBP, 0.96 for MAP, and 0.94 for pulse pressure. The study concluded that BP could be measured non-invasively and continuously using the physiologic pressure recon-struction present in the Nexfin R. The values and their changes and variations are comparable to
the ones obtained with PAC.
Also, in 2012 Fischer et al. developed a study [9] where SBP, DBP, MAP, and CI obtained from PAC, PiCCO, and the Nexfin R were compared. Six (12%) patients were excluded from the
study because a reliable photoplethysmographic signal could not be obtained, revealing an impor-tant pitfall of the Nexfin R device. For the other 44 patients, there was a significant relationship
between the photoplethysmographic and the PAC signal, with a correlation coefficient of 0.56 for SBP, 0.61 for DBP, and 0.77 for MAP. Between the PiCCO and the Nexfin R, device the
correla-tion coefficient obtained for the CI was 0.33, corresponding to an error of 50%. They concluded that the Nexfin R device is reliable, safe, and convenient to measure BP, but it cannot be considered
a way to replace PiCCO’s measure of CI.
Kalmar et al., in 2012, also presented a study [8] with 110 patients that concluded that the the accuracy of the MAP obtained with the Nexfin R was higher than with the NIBP that does
not provide a continuous measurement. In addition, the Nexfin R device was considered stable
without requiring a long calibration time, providing satisfactory accuracy for most procedures. Finally, Martina et al. have also published another paper [7] earlier, in 2010, where the Nexfin R device was compared with the PAC in patients with reduced arterial pulsatility. The
av-erage difference between the two methods was -1.3±6.5 mmHg. Therefore, it was concluded that the Nexfin R monitor enables clinicians to measure ABP waveform non-invasively supported by
Chapter 4
Signal processing techniques
4.1
Introduction
The signal obtained with the Nexfin R device is a digital signal with the BP information and
its variations. In order to evaluate the signal and compare it with the invasive arterial BP (IABP), some features of the time series must be studied. The next sections will be destined to explain the different methods used to interpret and analyze the signal. These methods were divided into linear time and frequency domain methods and non-linear methods.
4.2
Time domain methods
A time-domain approach considers the signal as a sequence of an unordered set of intervals [58]. It acknowledges the signal as a discrete or continuous progression over time.
For the first two approaches, two of the parameters that can be calculated are the mean and the standard deviation (STD) (or variance). Considering a discrete signal acquired with a specific sampling rate, the mean (µ) and the standard deviation (δ ) can be determined through equations 4.1and4.2, respectively1. The variance corresponds to the square of the standard deviation (δ2).
µ = 1 N N−1
∑
i=0 xi (4.1) δ2= 1 N− 1 N−1∑
i=0 (xi− µ)2 (4.2)Taking this into consideration, the first analysis done included the BP mean value and standard deviation for each patient, as well as, the difference between those values of the two methods
1https://www.statisticshowto.datasciencecentral.com/probability-and-statistics/
16 Signal processing techniques
and, also, the relative error. The relative error can be computed through equation 4.3, where x0
corresponds to the value obtained with the Nexfin device and x is the value measured invasively.
Er(%) =
x0− x
x · 100 (4.3)
4.3
Frequency domain methods: spectral analysis
The frequency-domain methods allow an interpretation of a signal as a function of frequencies instead of time. This approach gives information on the distribution of the signal within each frequency band over a range of frequencies. Spectral estimation methods compute the power as a function of frequency [59].
The transition from a signal in the time domain to the frequency domain can be calculated mathematically using the Fourier transform or its fast algorithm, the Fast Fourier Transform (FFT). The result of the FFT is a complex number for each frequency present in the signal data [60], and its spectrum is characterized by discrete peaks in each frequency component [61].
One of the analyses that can be done in the spectral domain is the partitioning of the signal in high and low-frequency variabilities (HFs and LFs) that gives information on the short-term or long-term variability of the time series [60]. The variability can be obtained by calculating the total area under the power spectral density curve [60].
The spectral components (frequency bands) are, in general, classified into four different power categories that can be distinguished in the calculated spectrum.
Regarding the blood pressure signals, the HF range lies within the 0.2, and the 0.4 Hz, the mid-frequency (MF) range lies around 0.1 Hz, and the LF range is within the 0.02 and 0.07 Hz 2. The HFs are associated with a normal respiratory, activity whereas the MFs can be related to the Mayer Waves. The peaks width and length around these frequencies are not constant, but the control mechanism can be determined through the power or the area of the peaks in the wanted frequency range [63,26].
In this work, it was computed the FFT and, afterward, it was determined the area of the spec-trum in the HF region and the MF region. The MF interval was defined between 0.07 and 0.13Hz. Another analysis that can be done when working in the frequency domain and when comparing two different signals is the coherence index. It comes up as a counterpoint to the correlation function used in the time domain [64]. It can be calculated using equation4.4, where Gxy is the cross-spectral density between the two signals, and Gxx and Gyy are the autospectral density of each signal. The magnitude of the coherence function is an index of the relation between the two signals. These values were also collected for each signal type and patient.
Cxy( f ) =
|Gxy|2
GxxGyy
(4.4)
4.4 Non-linear analyses 17
4.4
Non-linear analyses
The non-linear analysis of a signal focuses on its distribution, analyzing its properties in interval sequences [58,65].
Inside the non-linear measures that are currently used to characterize physiological signals, complexity measures are widely used to outline the amount of structured information. Complexity perceives irregularity, subjectivity, and uncertainty as a fundamental part of every system [66]. Furthermore, dynamical complexity can indicate the adaptability of the system to internal and external stimuli. This ability to adapt is higher in healthy organisms and decreases with elderliness and the presence of pathologies [4].
The complexity measures can be divided into entropy measures and compression measures. The application of compression algorithms on biological systems is still under development. How-ever, some studies have demonstrated that it can be used as an alternative to the entropy and that the combination of both methods can quantify different features of a system’s complexity, improving the characterization of different pathophysiological states [66].
4.4.1 Entropy measures
The first introduction of the entropy measure occurred in 1948 by Shannon [67], who at-tempted to determine how random a message is expected to be within a given distribution.
Considering X, a random variable with a distribution P(X = x) = px, the Shannon entropy of
the random variable X is given by equation4.5, and it is measured in bits [68].
H(X ) =
∑
x∈Y pxlog2 1 px (4.5)Later in 1991, the concept of approximate entropy (ApEn) appeared as a new way to classify complex systems [69]. For N given points of a time series x, ApEn(N,m,r) is calculated using equa-tion4.6where Φm(r) and Cm
i (r) are obtained through equations4.7and4.8, respectively, where d
is the distance between the vectors x(i) and x( j), given by the maximum difference between their corresponding scalar components. The parameters m (subseries length) and r (tolerance) can be variable depending on the context. A system with a low ApEn value is considered a system with a high degree of regularity [66,69].
ApEn= Φm(r) − Φm+1(r) (4.6) Φm(r) = (N − m + 1)−1 N−m+1
∑
i=1 log(Cmi (r)) (4.7)Cim(r) = number of x(j) such that d[x(i), x( j)] ≤ r
N− m + 1 (4.8)
18 Signal processing techniques
computed using equation4.9, in which the parameters m and r allow the change of the size of segments used to help the detection of larger or smaller patterns.
SampEn(m, r) = −lognumber of template vector pairs having d[Xm+1(i), Xm+1( j)] < r number of template vector pairs having d[Xm(i), Xm( j)] < r
(4.9)
For this work, the parameters chosen when determining both the ApEn and the SampEn for each signal were m = 2 and r = 0.15 × standard deviation, following the proxy presented in the study by Gibson et al. in 2018 [4].
The SampEn was also used to assess the short-term fluctuations of the signals by comparing the SampEn value of the first differences of the original pre-processed signals with the value of the first differences of the surrogate signals. The first differences are the difference between consecutive values of the signal, and the surrogate is done by randomly shuffling the points in the signal. This process was done 100 times for each signal and, afterward, the mean SampEn value is the one registered. This procedure is important to determine whether the observed short-term fluctuations of the BP time series have some information or are random noise. Similar entropy values between the original and the surrogate signals indicate that there is no information in those fluctuations.
To provide an analysis of a physiological time series, Costa et al. proposed, in 2002, the multiscale entropy (MSE) technique, a function of the entropy per scale [71]. The MSE method measures the SampEn for a set of time series on different time scales [4]. The use of multiple measurements of entropy allows the assessment of complexity at shorter and longer time scales [72,4].
For the multiscale entropy analysis, it was used the 5 scales, and, for each signal, it was computed the MSEslope, the MSEΣ, and the MSEslope·Σ. The MSEslope is the linear regression
slope between the 5 SampEn values, the MSEΣis considered the complexity index and is the sum
of the 5 SampEn values and, finally, MSEslope·Σ is the product between MSEslope and MSEΣ. It
was used the same values of m and r as the ones used previously for the SampEn.
4.4.2 Compression measures
One of the approaches to measure the complexity of a signal is the Kolmogorov complexity [73]. However, its application in biomedical signals is limited by the fact that the Kolmogorov complexity is not computable. The compressors are a close upper-bounded approximation of the Kolmogorov complexity function.
The purpose of data compression is to encode information using fewer bits than the original data to save data memory.
The compressors can be divided into two main types: lossless and lossy compressors. The lossless compressors preserve every bit of data in the file after uncompression, whereas lossy compressors eliminate certain bits of information, especially redundant ones [66].
4.5 Association with the outcomes 19
When it comes to measuring the complexity of a digital signal, several compressors can be used, being the Lempel-Ziv compressor[74] and the GZIP [75] the most commonly used and adopted in this work . The GZIP compressor was launched in July 1992 by Jean-Loup Gailly and Mark Adler3 and the LZMA compressor (Lempel–Ziv–Markov chain algorithm) has been developed by Igor Pavlov since 1996 and uses the Burrows–Wheeler transform algorithm4. Both compressors perform lossless data compression with a high compression ratio.
In the multiscale compression (MSC) analysis, the BP signals were compressed using 5 dif-ferent scales and the ratio (original/compressed) was calculated for each scale. Afterward, it was registered the scale 1 ratio, the slope (MSCslope), and the sum (MSCΣ) between the 5 scales ratios
and also the product between the slope, and the sum (MSCslope·Σ).
4.5
Association with the outcomes
Demographic and clinical characteristics are summarized by their median, first and third quar-tiles in the case of continuous variables, and by count number and percentage in the case of cate-gorical variables.
For the comparison of two signals obtained with different methods, a correlation coefficient gives information on the statistical relationship between both. It can be computed with equation 4.10, and it ranges from -1 to 1, where higher absolute values indicate a higher linear correlation between the two signals. It is important to mention that a high correlation does not mean that the two methods agree [76].
r= n(∑ xy) − (∑ x)(∑ y)
p[n ∑x2− (∑ x)2][n ∑ y2− (∑ y)2]=
cov(x, y) p
var(x) · var(y) (4.10)
This correlation coefficient is also known as the Pearson correlation coefficient to which can be associated with a p value that represents the significance level of the correlation [77,78]. A high p value might be related to a random data relation, whereas, a low p value ensures the idea that the two data series are linearly related.
The Spearman correlation test is similar to the Pearson test but assesses if there is a monotonic relation between the two variables, even if not linear [79]. It also ranges from -1 to 1 where higher absolute values indicate the monotonic relationship. This correlation coefficient is considered to be the Pearson correlation coefficient for the rank variables and has also associated a p value to test its statistical relevance.
Furthermore, to test differences in the population’s distribution, the Wilcoxon paired test was used [80].
These two methods, the Spearman correlation coefficient, and the Wilcoxon test, were applied to compare the indices derived from invasive versus noninvasive ABP time series.
3http://www.gzip.org(last accessed May 2020)
20 Signal processing techniques
One of the main goals of this work is to relate the different indices obtained from the previously described methods to the EUROScore, the STS, morbidity and mortality risk, and the ICU time. For that, a linear regression was performed. Similarly to what was done by Henriques et al. in 2019 [81], all three outcomes were logarithmically transformed to increase their linear relationship with the parameters and minimize the sum of the squared residuals (SSR).
In this procedure, the correlation coefficients were also standardized (divided by the standard error) so that they could be comparable.
Additionally, the linear regression performed for the ICU time also included information on the patients’ age. That was not done for the risk scores considering their values already consider that parameter.
Statistical significance was set at p-values < 0.05. A sample of 14 paired observations pro-vides 80% power to detect effect sizes of 0.89 (i.e., we are powered to detect differences between methods of 0.89 times the STD). This calculation allows for a 10% loss of efficiency for the non-parametric test (relative to the paired t-test).
Chapter 5
Signals pre-processing
Before applying the non-linear measures to the blood pressure time series, a signal pre-processing is required. In this chapter, we describe the data demographics and the pre-pre-processing used. All the data pre-processing and analysis was done using the Python software.
5.1
Sample population analysis
In this work, it will be used blood pressure data from 14 adult patients (18 years. or older) col-lected from September to December 2017 with informed consent, as part of an ongoing prospec-tive, single tertiary care center observational study funded by the National Institute of Health (R01GM098406). The Institutional Review approved the protocol Board of Beth Israel Deaconess Medical Center. All data were deidentified before analysis. The BP was obtained using both an invasive method, the PAC, and a non-invasive method - the Nexfin R of the ClearSight System.
Table 5.1: Patient’s clinical characteristics and surgical data1. All patients (n=14)
Age (y), median (Q1, Q3) 70 (64.2, 79.5)
Gender (male), n (%) 13 (92.9%)
STS Mort+Morb (%), median (Q1, Q3) 9.8 (6.2, 10.5) EuroSCORE index, median (Q1, Q3) 2.3 (1.0, 3.0) Time in ICU (h), median (Q1, Q3) 29.1 (24.8, 45.0) Surgery type:
CAB, n (%) 10 (71.4%)
Valve, n (%) 5 (35.7%)
Other, n (%) 2 (14.3%)
Of the 14 patients, 13 were male, and 1 was female, with ages ranging from 48 to 84 years. The data was collected in a preoperative period where patients were mainly indicated for CAB or a valve replacement surgery. Seven patients were in an urgent state.
The patients’ clinical characteristics and surgical data are present in Table5.1and, Appendix Bcompiles the detailed information for each subject analyzed.
22 Signals pre-processing
5.2
Signals representation
The data collected with the PAC and the Nexfin device of the ClearSight System for the 14 patients were grouped into different files. The invasive data was divided into MAP, DBP, SBP, and pulmonary arterial pressure, all values as a function of time and separated for each patient. For the non-invasive data, the values included the time, unreconstructed and reconstructed values of MAP, DBP, and SBP, and status data. Note that the reconstructed values of BP imply a certain degree of pre-processing that is not disclosed. For this work, it was only used the reconstructed dataset.
The values of SBP, DBP, and MAP for both methods were plotted, and, in Figure5.1, those can be seen for one representative patient (patient 5).
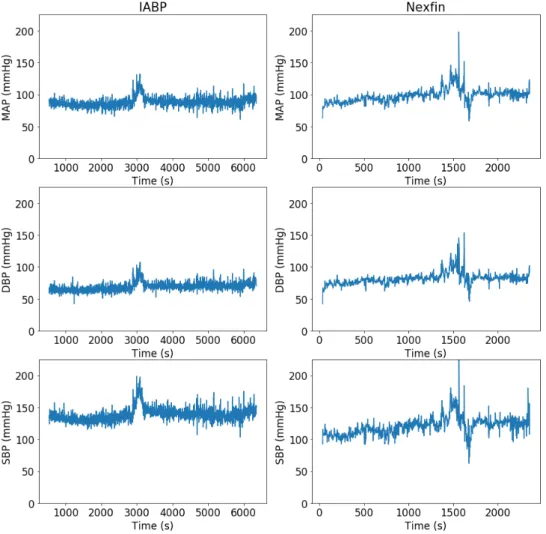
Figure 5.1: Representation of the raw signals obtained with the PAC and the Nexfin device of the ClearSight Systemfor the MAP, DBP and SBP - example of the patient 5
These representations only allow for a simple comparison of the two methods, and, it can be seen, the two signals are not synchronized, and the length of the signals acquired with the non-invasive method is inferior to the ones obtained from the invasive method.
5.3 Data Synchronization 23
5.3
Data Synchronization
The signals require a synchronization that was initially done based on the time of the beginning and end of the signal acquisition. The synchronization was achieved by removing the points where the signals were not being simultaneously acquired.
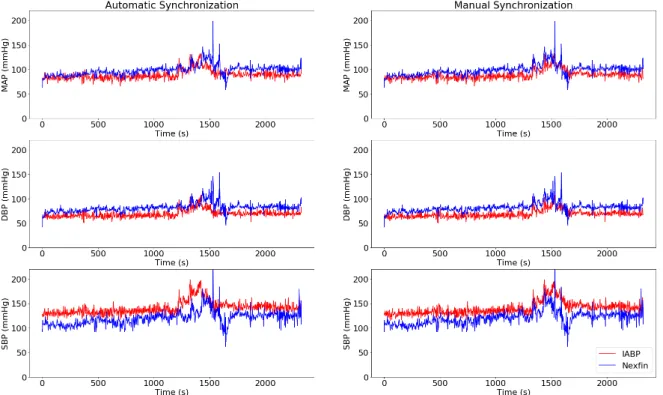
Even though this automatic synchronization was not ideal, this process allowed the identi-fication of patterns in both invasive and non-invasive signals that enabled the determination of adjustment needed for manual synchronization. Figure5.2 compiles the plots of the signals for patient 5 after the automatic and manual synchronization. In this case, the manual adjustment was +73 seconds, where the positive value means that the Nexfin signal is delayed when compared to the IABP signal.
The adjustment made is dependent on the subject, and there was no pattern observed in it. Despite that, those values are presented in AppendixB.2.
Figure 5.2: Representation of the signals of patient 5 after automatic synchronization.
5.4
Division into segments
Following the manual synchronization, it was done a division of each signal into different segments to normalize the length between the signals of the various patients. The segments were created so that they had around 700 points, ranging from 634 to 853, to maximize the number of
24 Signals pre-processing
between patient to segment and its respective length. In all, it was created a group of 33 segments for the 14 patients.
Chapter 6
Signal analysis
Several measures were applied to compare the invasive and non-invasive BP signals. The methods chosen and procedures were presented in Chapter 4 and include statistical measures, a complexity analysis through entropy and compression methods, and a frequency analysis. In addition, it was studied the relationship between these parameters and the different outputs through linear regression analysis. This chapter present the results obtained.
6.1
Time domain measures
Table6.1presents the mean, the standard deviation, the difference between these parameters of the two methods, and the relative error between means (Nexfin R-IABP) for each of the BP time
series.
Table 6.1: Time domain measures of invasive arterial blood pressure versus noninvasive blood pressure (Nexfin R). P-values in bold are lower than 0.05.
IABP (n=14) Median (Q1, Q3) Nexfin R (n=14) Median (Q1, Q3) Difference (Nexfin R - IABP) Median (Q1, Q3) Relative Error (%) Median (Q1, Q3) Wilcoxon P Time series mean
MAP 72.1 (67.5, 76.0) 95.0 (85.8, 101.5) 17.4 (15.5, 29.6) 26.3 (20.1, 46.9) <0.001 DBP 50.1 (45.2, 56.8) 71.7 (64.9, 75.7) 18.8 (14.8, 26.2) 36.4 (28.6, 53.5) <0.001 SBP 138.5 (123.9, 144.8) 131.2 (115.7, 151.0) 0.5 (-12.3, 7.0) -0.3 (-9.7, 5.7) 0.826 Time series STD MAP 5.9 (4.9, 7.0) 7.9 (6.7, 9.0) 1.8 (0.5, 2.6) 30.0 (9.7, 50.2) 0.004 DBP 5.0 (4.2, 6.1) 6.0 (5.3, 7.7) 1.1 (0.7, 2.0) 22.4 (16.6, 33.7) <0.001 SBP 7.8 (6.2, 9.1) 10.8 (8.6, 11.9) 2.6 (1.6, 3.5) 34.3 (16.4, 53.1) 0.006
Abbreviations: IABP, invasive arterial blood pressure; MAP, mean arterial blood pressure; DBP, diastolic blood pressure; SBP, systolic blood pressure; Q1, first quartile; Q3, third quartile; STD, standard deviation.
The mean BP values are significantly higher for DBP and MAP when acquired by Nexfin R
comparing with the invasive ones. The STD of all the BP is higher in the signals obtained by Nexfin R than the invasive ones. The relative error of the mean is higher for the DBP and lower
26 Signal analysis
for the SBP. As a counterpoint, the relative error of the standard deviation is higher for the SBP and lower for the DBP.
6.2
Frequency analysis
For the frequency analysis of the signals, it was fundamental that each signal had a constant sampling frequency. For that, signals were re-sampled by maintaining the same number of points and duration and by interpolating the unknown points. However, in this process, some information or noise can be lost, and signal peaks may appear less prominent. Figure6.1represents the original plot of a segment of patient 2 (segment 3) and the re-sampled version.
Figure 6.1: Original and re-sampled signals of the mean arterial blood pressure (MAP) of the Nexfin R device for a segment of patient 2.
After the signals were sampled, it was determined the area of the spectrum in the HF region and the MF region. Figure 6.2 represents the frequency spectrum for the MAP signal acquired with the Nexfin R device for the third segment, where it is possible to see the general aspect of the
BP spectrum. The HF and MF area values are registered in Table6.2, as well as the Spearman correlation parameters and the p-value of the Wilcoxon paired test.
Figure 6.2: Spectrum of the mean arterial blood pressure (MAP) signals of the invasive method (left) and of the Nexfin R device (right) for a segment of patient 2.
6.2 Frequency analysis 27
The HF and the MF areas are significantly higher for the Nexfin R device for the MAP and
SBP time series. The values of the HF area of the MAP and SBP signals and the MF area for the SBP for both types of acquisition are highly correlated.
Table 6.2: Area of the spectrum in high frequency and mid-frequency regions of invasive arte-rial blood pressure and noninvasive (Nexfin R) blood pressure signals. Spearman correlation and
Wilcoxon paired test for the comparison of the two methods. P-values in bold are lower than 0.05
IABP Nexfin R Spearman Wilcoxon
Median (Q1, Q3) Median (Q1, Q3) r (95% CI) P P
HF area MAP 1.48 (0.94, 1.99) 1.94 (1.30, 2.84) 0.93 (0.79, 0.98) <0.001 0.011 DBP 1.22 (1.03, 1.42) 1.96 (0.72, 2.63) 0.28 (-0.29, 0.71) 0.326 0.177 SBP 1.99 (0.98, 2.68) 3.40 (2.06, 3.91) 0.64 (0.17, 0.88) 0.013 0.003 MF area MAP 1.42 (0.76, 1.75) 1.72 (1.16, 2.59) 0.47 (-0.08, 0.80) 0.088 0.030 DBP 1.04 (0.70, 1.44) 1.19 (0.96, 2.46) 0.36 (-0.21, 0.75) 0.203 0.096 SBP 1.35 (0.82, 2.46) 2.22 (1.73, 2.90) 0.71 (0.28, 0.90) 0.005 0.016
Abbreviations: IABP, invasive arterial blood pressure; MAP, mean arterial blood pressure; DBP, diastolic blood pressure; SBP, systolic blood pressure; HF, high- frequency; MF, mid-frequency; Q1, first quartile; Q3, third quartile.
Figure 6.3: Coherence plot of the mean arterial blood pressure (MAP) signal of segment of patient 2.
Table 6.3: Coherence between invasive and non-invasive signals. It is presented the median and quartiles for the average coherence value of each patient’s signal and for the entire spectrum, the HF range and the MF range.
Median (Q1, Q3)
Entire spectrum HF range MF range
MAP 0.58 (0.56, 0.62) 0.51 (0.49, 0.54) 0.72 (0.71, 0.73) DBP 0.51 (0.50, 0.54) 0.43 (0.43, 0.46) 0.65 (0.62, 0.67) SBP 0.49 (0.49, 0.51) 0.42 (0.41, 0.45) 0.58 (0.58, 0.60)

![Figure 2.2: Cuff pressure waveform of oscillometric method [32]](https://thumb-eu.123doks.com/thumbv2/123dok_br/15213394.1019627/26.892.253.606.716.958/figure-cuff-pressure-waveform-oscillometric-method.webp)
![Figure 2.3: T-Line system device for applanation tonometry [37].](https://thumb-eu.123doks.com/thumbv2/123dok_br/15213394.1019627/27.892.365.569.785.990/figure-t-line-device-applanation-tonometry.webp)