DOI: 10.5935/2359-4802.20180048
REVIEW ARTICLE
Mailing Address: Rodrigo Nazário Leão
Av. Oscar Monteiro Torres, n 49, 1A. Postal Code: 1000-216, Areeiro, Lisbon - Portugal. E-mail: [email protected]; [email protected]
Impedance Cardiography in the Evaluation of Patients with Arterial Hypertension
Rodrigo Nazário Leão1,2 and Pedro Marques Da Silva1,3Faculdade de Ciências Médicas, Universidade Nova de Lisboa;1 Lisbon - Portugal Hospital de São José, Centro Hospitalar de Lisboa Central,2 Lisbon - Portugal Hospital de Santa Marta,3 Lisbon - Portugal
Manuscript received on September 27, 2017, revised on December 25, 2017, accepted on June 16, 2018. Hypertension / physiopathology; Blood Pressure;
Cardiography, Impedance; Hemodynamics.
Keywords
Abstract
Arterial hypertension is responsible for high morbidity and mortality. Despite increasing awareness of the consequences of uncontrolled hypertension and the publication of several recommendations and guidelines, blood pressure control rates are suboptimal, and approximately half of the patients do not reach the targets. Defined as an increase in blood pressure, hypertension is characterized by hemodynamic abnormalities in cardiac output, systemic vascular resistance, or arterial compliance. Therefore, the approach to arterial hypertension can be improved by the knowledge of the hemodynamics underlying the blood pressure increase. Impedance Cardiography has emerged as a new strategy to customize therapy and monitor patients aiming to improve blood pressure control according to the hemodynamic profile, rather than a blind intensive care approach. This is a review of impedance cardiography evidence, its benefits, actual and future applications in the approach and management of arterial hypertension.
Introduction
Hypertension is a condition characterized by elevated blood pressure (BP). A comprehensive definition, published by the American Society of Hypertension in 2005, describes hypertension as “a progressive cardiovascular syndrome (CV) arising from complex and interrelated etiologies”. Early markers of this syndrome are often present before blood-pressure (BP) elevation
occurs; thus, hypertension cannot be solely classified by discreet blood-pressure thresholds. Disease progression is strongly associated with cardiac and vascular functional and structural abnormalities that damage the heart, kidneys, brain, vasculature and other organs, leading to early morbidity and mortality.1
It is estimated that hypertension affects approximately 1 billion individuals and causes more than 7 million deaths annually worldwide (13% of overall mortality). In Portugal, the prevalence of hypertension in the adult population aged 18 to 90 years is 42.2% (44.4% in men and 40.2% in women).2 According to the World Health Organization (WHO), BP greater than 115 mmHg (systolic BP) is responsible for 62% of cerebrovascular diseases and 49% of ischemic cardiac pathologies, with little variation between the genders. These BP values are considered by the WHO as the main risk factor for mortality worldwide.3,4
Although BP control is a growing concern, with a consequent increase in the number of treated and controlled patients, there is still a large percentage of treated patients who do not reach their therapeutic targets. In Portugal, only 55.6% of treated hypertensive patients have controlled BP.2,5,6
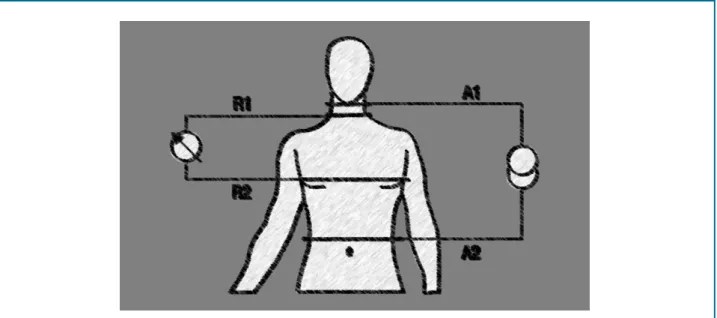
operator-Figure 1 - Schematic illustration of impedance cardiography application, four-pole technique. A1 and A2 correspond to the current-applying electrodes; R1 and R2 to the current-receptor electrodes.
Source: adapted from Cybulski et al.14
independent and low-cost hemodynamic monitoring tool that allows defining the patients’ hemodynamic profiles, leading to a more adequate selection of the antihypertensive therapy.10
Impedance cardiography
Biological tissues are complex anisotropic conductors with reactive and resistive components. The bioimpedance value depends on the type of tissue analyzed and can be altered by translocation of organs or tissues, by changes in shape or structure, by the volume or location of intracellular fluids, or by the frequency of the current used. The ICG consists in the evaluation of the electrical properties of the biological tissues of the chest.11 The bioimpedance measures the way the tissues conduct the alternating electric current and varies according to the amount of body fluids. Thus, the chest impedance increases or decreases, depending on the changes in intrathoracic fluid with each heartbeat.12,13
The most common technique uses four electrodes, two of which are the current electrodes and the two that detect voltage changes. Since the current amplitude is constant, the detected voltage is proportional to the tissue impedance.14 Figure 1 represents the four-pole impedance measurement scheme. The effective evaluation of the chest impedance during a cardiac cycle is hindered by several factors, such as chest size and shape, obesity,
body weight, position and posture, thoracic circulation and respiratory rate. For this reason, although this method was published in 1940 by Nyboer et al.,15 it took several years and many studies to reach a system that would correct them.14,16-19 Current technology, with data processing and modeling techniques, has demonstrated that ICG has a high correlation, reproducibility and precision when compared to invasive hemodynamic monitoring techniques and echocardiography – which was considered more time-consuming, operator-dependent and technically demanding. Therefore, the ICG allows safe, non-invasive and low-cost hemodynamic and cardiac cycle monitoring.20-25
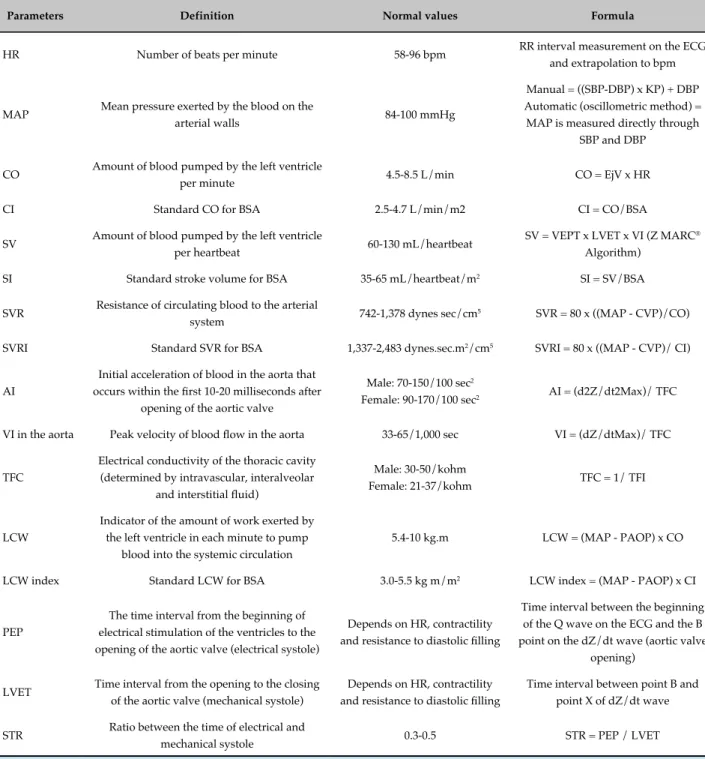
The ICG detects, analyzes, and records hemodynamic changes by measuring electrical resistance changes in the thorax, graphically translating them as impedance and electrocardiography waves (Figure 2). It allows the calculation of several hemodynamic parameters such as systolic volume (SV), cardiac output (CO), systemic vascular resistance (SVR), velocity and acceleration indexes, thoracic fluid content (TFC), pre-ejection period, left ventricular ejection time, systolic time ratio, left cardiac work, heart rate and mean BP.26 The assessed parameters and respective formulas are shown in table 1.
The first derivative of the waveform (ΔZ) describes
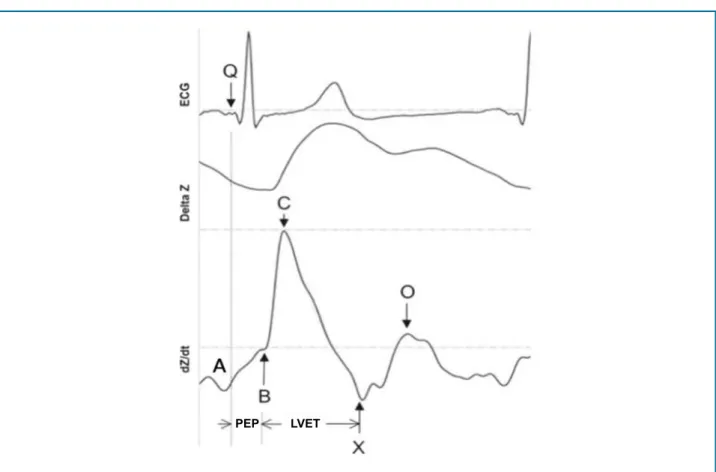
Figure 2 - Electrocardiography and impedance waves. PEP: pre-ejection period; LVET: left ventricular ejection time; ECG: electrocardiogram.
Source: adapted from Thompson et al.27
PEP LVET
wave correlates with cardiac contractility, and its height and width, with systolic volume. Several indices, such as pre-ejection period, left ventricular ejection time, velocity index, acceleration index, left cardiac work index, and so on, can be obtained through the waveform, allowing non-invasive monitoring of CO and contractility, for
instance. The second derivative of the waveform (dZ/
dt), describes fluid acceleration and represents a more detailed wave, containing four reference points (A, B, C, and X) associated with both atrial and ventricular systole, and the point o, which is related to the onset of diastole.
Point A coincides with the electrocardiogram (ECG) p-wave and marks the beginning of the end of diastolic filling. The A wave only exists in the presence of an atrial contraction, being small and round, with its end clearly separated from the beginning of the S wave. The basal impedance corresponds to point B. Point C defines the maximum acceleration of blood output from the ventricles. The slope corresponding to the rise from point B to point C is associated with cardiac contractility:
the steeper the upward curve, the greater the cardiac contractility. After reaching point C, there is a rapid deceleration to point X, which represents the inversion point of the intrathoracic fluid and corresponds to the closure of the aortic valve. After point X, the wave returns to the baseline and starts to form an early diastolic wave, associated with the opening of the mitral valve, the O wave. The moment of greatest opening of the mitral valve is represented by the peak of the S wave – point O. This interval between points X and O corresponds to the time of isovolumetric relaxation.28
This technology can be used, for instance, to evaluate postural cardiac rehabilitation, pacemaker optimization, sleep studies, hemodynamic monitoring in pregnant women and outpatients, and therapy and/or monitoring of hypertensive patients.13,29-39
Table 1 - Parameters evaluated by impedance cardiography
Parameters Definition Normal values Formula
HR Number of beats per minute 58-96 bpm RR interval measurement on the ECG and extrapolation to bpm
MAP Mean pressure exerted by the blood on the
arterial walls 84-100 mmHg
Manual = ((SBP-DBP) x KP) + DBP Automatic (oscillometric method) = MAP is measured directly through
SBP and DBP
CO Amount of blood pumped by the left ventricle
per minute 4.5-8.5 L/min CO = EjV x HR
CI Standard CO for BSA 2.5-4.7 L/min/m2 CI = CO/BSA
SV Amount of blood pumped by the left ventricle
per heartbeat 60-130 mL/heartbeat
SV = VEPT x LVET x VI (Z MARC®
Algorithm)
SI Standard stroke volume for BSA 35-65 mL/heartbeat/m2 SI = SV/BSA
SVR Resistance of circulating blood to the arterial
system 742-1,378 dynes sec/cm
5 SVR = 80 x ((MAP - CVP)/CO)
SVRI Standard SVR for BSA 1,337-2,483 dynes.sec.m2/cm5 SVRI = 80 x ((MAP - CVP)/ CI)
AI
Initial acceleration of blood in the aorta that
occurs within the first 10-20 milliseconds after
opening of the aortic valve
Male: 70-150/100 sec2
Female: 90-170/100 sec2 AI = (d2Z/dt2Max)/ TFC
VI in the aorta Peak velocity of blood flow in the aorta 33-65/1,000 sec VI = (dZ/dtMax)/ TFC
TFC
Electrical conductivity of the thoracic cavity (determined by intravascular, interalveolar
and interstitial fluid)
Male: 30-50/kohm
Female: 21-37/kohm TFC = 1/ TFI
LCW
Indicator of the amount of work exerted by the left ventricle in each minute to pump
blood into the systemic circulation
5.4-10 kg.m LCW = (MAP - PAOP) x CO
LCW index Standard LCW for BSA 3.0-5.5 kg m/m2 LCW index = (MAP - PAOP) x CI
PEP
The time interval from the beginning of electrical stimulation of the ventricles to the opening of the aortic valve (electrical systole)
Depends on HR, contractility
and resistance to diastolic filling
Time interval between the beginning of the Q wave on the ECG and the B
point on the dZ/dt wave (aortic valve
opening)
LVET Time interval from the opening to the closing of the aortic valve (mechanical systole)
Depends on HR, contractility
and resistance to diastolic filling
Time interval between point B and
point X of dZ/dt wave
STR Ratio between the time of electrical and
mechanical systole 0.3-0.5 STR = PEP / LVET
HR: heart rate; ECG: electrocardiogram; MAP: mean arterial pressure; SBP: systolic blood pressure; DBP: diastolic blood pressure; KP: variable that depends on the pulse pressure ratio (usually varies between 0.25-0.33); CO: cardiac output; EjV: ejection volume; CI: cardiac index; BSA: body surface area; SV: stroke volume; VEPT: volume of electrically participating tissue (conductive volume for thorax size, affected by weight, height and gender); LVET: left ventricular ejection time; VI: Velocity index; SI: Stroke index; SVR: systemic vascular resistance; CVP: central venous pressure (pressure in the thoracic vena cava upon reaching the right atrium - the standard value of 7 mmHg is considered); SVRI: systemic vascular resistance
index; AI: acceleration index; d2Z/ dt2Max: maximum of the second derivative of ΔZ; TFI: thoracic fluid index (baseline thoracic impedance, Z0); TFC: total fluid content; LCW: left cardiac work; PAOP: Pulmonary artery occluded pressure (the standard value is 10 mmHg); PEP: pre-ejection
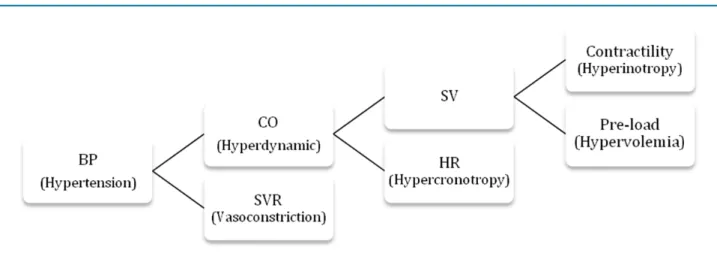
Figure 3 - Hemodynamic components of blood pressure. BP: blood pressure; CO: cardiac output; SVR: systemic vascular resistance; SV: stroke volume; HR: heart rate.
Arterial hypertension and impedance cardiography
Classically defined as an increase in BP, this parameter alone is an incomplete indicator of the cardiovascular system status, particularly in patients with resistance to drug therapy or hypervolemic ones.7 The mean BP consists of the product of two hemodynamic parameters (CO and SVR), and arterial hypertension is the result of a disorder in one or both hemodynamic variables.40 These findings, associated with the fact that the results obtained with empirical therapy based on current guidelines are suboptimal, have led some specialists to propose new approach pathways for the hypertensive patient, particularly a therapeutic approach guided by the patient’s hemodynamic profile.41-45 Historically, the use of BP as an indicator of cardiovascular status in hypertensive patients comes from the fact that hemodynamic parameters are assessed using invasive techniques.46 More recently, echocardiography has been used to accurately estimate CO, but when compared with ICG, the latter was considered more time-consuming and technically demanding.19 Thus, ICG emerges as a non-invasive, simple, accurate and inexpensive method to evaluate patients hemodynamically, characterizing the profile and guiding the therapeutic optimization in hypertensive patients.44,45,47
The use of ICG can improve our knowledge about arterial hypertension, especially regarding its hemodynamic characteristics and consequences. Hypertensive cardiopathy is a continuum, involving structural changes (myocardial fibrosis) and left ventricular geometry (hypertrophy and concentric
remodeling), which progressively develop into systolic and/or diastolic function disorder.48 Close to its end, the IMPEDDANS study (ClinicalTrials.gov; Identifier: NCT03209141) intends to verify the ability to screen for left ventricular diastolic dysfunction in its asymptomatic phase in hypertensive patients, which may allow an early diagnosis, as well as the study of the disease evolution and therapeutics. The growing interest in hemodynamic changes in arterial hypertension and orthostatic and emotional stress responses, led researchers to use ICG to study autonomic dysfunction in hypertension. The technological evolution of the ICG, with the development of monitors for the assessment of outpatients, is a new area of research in arterial hypertension. With this technique, one can assess cardiac performance for 24 to 48 hours, as well as the hemodynamic changes that occur during Daily Life Activities, and the hemodynamic responses to changes in body position and blood pressure control, for instance.49-53
Antihypertensive therapy guided by impedance cardiography
Hypertension management includes lifestyle measures such as sodium restriction and weight loss, and, in most cases, the use of one or more antihypertensive drugs. Considering this approach to arterial hypertension as a hemodynamic pathology, drugs are proposed according to the pathophysiological mechanism responsible for BP increase (Figure 3).
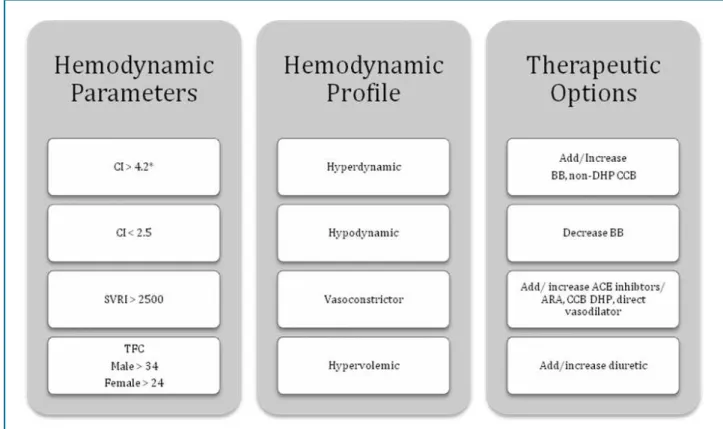
necessary to evaluate the hemodynamic variables to be able to target the therapy at a high cardiac or SVR index. Likewise, if any of these parameters is decreased, the drug responsible for the effect should be identified, its dose reduced, or the drug withdrawn (Figure 4).10,25,44,45 Several studies have highlighted the apparent superiority – although never assessed in long-term studies – of the personalized therapeutic approach to the hemodynamic profile, both regarding its efficacy and cost-effectiveness (Table 2).
Conclusion
Hemodynamic-guided therapy can be valuable in the evaluation and management of hypertensive patients. Impedance cardiography is a cost-effective assessment that allows the diagnosis, therapeutic optimization, and follow-up of hypertensive patients, helping them to achieve therapeutic targets, even in those with resistant hypertension. This therapeutic approach, which focuses on the cause of blood pressure increase
and its pathophysiological mechanism, allows better blood pressure control and a potential reduction in cardiovascular events, mortality and costs associated with arterial hypertension.
Future studies in the ICG area should broaden our understanding of the pathophysiology and hemodynamic changes of arterial hypertension and demonstrate that early diagnosis and treatment of hemodynamic characteristics have a positive impact on patient outcomes, reducing morbidity and mortality associated with high blood pressure.
Author contributions
Conception and design of the research: Leão RN, Silva PM. Acquisition of data: Leão RN, Silva PM. Analysis and interpretation of the data: Leão RN, Silva PM. Writing of the manuscript: Leão RN, Silva PM. Critical revision of the manuscript for intellectual content: Leão RN, Silva PM. Supervision / as the major investigador: Leão RN.
1. Giles TD, Berk BC, Black HR, Cohn JN, Kostis JB, Izzo JL Jr, et al. Expanding the definition and classification of hypertension. J Clin Hypertens (Greenwich). 2005;7(9):505-512.
2. Polonia J, Martins L, Pinto F, Nazare J. Prevalence, awareness, treatment and control of hypertension and salt intake in Portugal: changes over a decade. The PHYSA study. J Hypertens. 2014;32(6):1211-1221.
3. Egan BM, Zhao Y, Axon RN. US trends in prevalence, awareness, treatment,
and control of hypertension, 1988-2008. JAMA. 2010;303(20):2043-50.
4. Stevens G, Mascarenhas M, Mathers C. Global health risks: progress and challenges. Bull World Health Organ. 2009;87(9):646.
5. Campbell NR, Brant R, Johansen H, Walker RL, Wielgosz A, Onysko J, et al; Canadian Hypertension Education Program Outcomes Research
References
Table 2 - Main clinical trials on hemodynamically-guided antihypertensive therapy
Author n Study design Results
Smith et al.44 164 Multicenter, randomized
After 3 months, a higher reduction in blood pressure was observed in the treatment group guided by ICG, 55% vs. 27%;
OR 2.32 (1.27-5.35), p = 0.007
Taler et al.45 104 Single-center, randomized
After 3 months, 56% of the individuals in the ICG-based approach to hypertension achieved blood pressure
< 140/90 mmHg vs. 18 (33%); OR 2.55 (1.15-5.64); p = 0.02
Sramek et al.54 322 Single-center prospective, non-randomized
After 3 weeks of ICG-based therapy, 63% of patients became normotensive; success rate of 58-68%
Sharman et al.55 21 Single-center, prospective, non-randomized
After 7 months, 57% of patients with resistant hypertension had BP control (blood pressure <140/90 mmHg); p < 0.001
Krzesinski et al.56 82 Single-center, randomized
After 3 months, more patients in the ICG-guided group achieved BP control in both ABPM (23.5 vs. 43.9%, p = 0.117) and OBPM
(23.5 vs. 36.6%, p = 0.22)
Krzesinski et al.57 128 Single-center, randomized
After 3 months, all blood pressure values were lower in the ICG-guided treatment group, with statistical significance in OBPM and
nocturnal blood pressure (p < 0.05)
Krzesinski et al.58 272 Single-center, randomized
After 3 months, final BP values were significantly lower in the ICG-guided treatment group for OBPM (p = 0.01), especially in patients
with higher blood pressure (p = 0.003)
Krzesinski et al.59 144 Single-center, randomized
After 12 months, the final blood pressure values were lower in the ICG-guided treatment group, with a BP reduction of at least 20 mmHg in the office measurements of diastolic pressure (27.3%
vs. 12.1%; = 0.034), 24-hour mean systolic blood pressure (49.1% vs. 27.3%, p = 0.013) and improvement in left ventricular diastolic
dysfunction (delta E/A 0.34 vs. 0.12; = 0.017).
ICG: impedance cardiography; OR: odds ratio; ABPM, ambulatory blood pressure monitoring; OBPM, office blood pressure measurement.
Potential Conflict of Interest
No potential conflict of interest relevant to this article was reported.
Sources of Funding
There were no external funding sources for this study.
Study Association
This article is part of the thesis of Doctoral submitted by
Rodrigo Nazário Leão, from Universidade Nova de Lisboa.
Ethics approval and consent to participate
Task Force. Increases in antihypertensive prescriptions and reductions in cardiovascular events in Canada. Hypertension. 2009;53(2):128-34.
6. McAlister FA, Wilkins K, Joffres M, Leenen FH, Fodor G, Gee M et al. Changes in the rates of awareness, treatment and control of hypertension in Canada over the past two decades. CMAJ. 2011;183(9):1007-13.
7. Taler SJ. Individualizing antihypertensive combination therapies: clinical and hemodynamic considerations. Curr Hypertens Rep. 2014;16(7):451.
8. Viera AJ, Furberg CD. Plasma renin testing to guide antihypertensive therapy. Curr Hypertens Rep. 2015;17(1):506.
9. Raman VK, Tsioufis C, Doumas M, Papademetriou V. Renal denervation therapy for drug-resistant hypertension: does it still work? Curr Treat Options Cardiovasc Med. 2017;19(5):39.
10. Ferrario CM, Flack JM, Strobeck JE, Smits G, Peters C. Individualizing hypertension treatment with impedance cardiography: a meta-analysis of published trials. Ther Adv Cardiovasc Dis. 2010;4(1):5-16.
11. Cybulski G. Ambulatory impedance cardiography. Berlin: Springer-Verlag Berlin Heidelberg; 2011.
12. Patterson RP. Fundamentals of impedance cardiography. IEEE Eng Med Biol Mag. 1989;8(1):35-8.
13. Bour J, Kellett J. Impedance cardiography: a rapid and cost-effective screening tool for cardiac disease. Eur J Intern Med. 2008;19(6):399-405.
14. Cybulski G, Strasz A, Niewiadomski W, Gasiorowska A. Impedance cardiography: recent advancements. Cardiol J. 2012;19(5):550-6.
15. Nyboer J, Bango S, Barnett A, Halsey RH. Radiocardiograms: electrical impedance changes of the heart in relation to electrocardiograms and heart sounds. In: Proceedings of The Thrity-Second Annual Meeting of the American Society for Clinical Investigation Held in Atlantic City (NJ), May 6, 1940. J Clin Invest. 1940;19(5):773-4.
16. Kubicek WG, Karnegis JN, Patterson RP, Witsoe DA, Mattson RH. Development and evaluation of an impedance cardiac output system. Aerosp Med. 1966;37(12):1208-12.
17. Bernstein DP. A new stroke volume equation for thoracic electrical bioimpedance: theory and rationale. Crit Care Med. 1986;14(10):904-9.
18. Linton DM, Gilon D. Advances in noninvasive cardiac output monitoring. Ann Card Anaesth. 2002;5(2):141-8.
19. Charloux A, Lonsdorfer-Wolf E, Richard R, Lampert E, Oswald-Mammosser M, Mettauer B, et al. A new impedance cardiograph device for the non-invasive evaluation of cardiac output at rest and during exercise: comparison with the "direct" Fick method. Eur J Appl Physiol. 2000;82(4):313-20.
20. Northridge DB, Findlay IN, Wilson J, Henderson E, Dargie HJ. Non-invasive determination of cardiac output by Doppler echocardiography and electrical bioimpedance. Br Heart J. 1990;63(2):93-7. Erratum in: Br Heart J 1990;64(5):347-8.
21. Albert NM, Hail MD, Li J, Young JB. Equivalence of the bioimpedance and thermodilution methods in measuring cardiac output in hospitalized patients with advanced, decompensated chronic heart failure. Am J Crit Care. 2004;13(6):469-79.
22. Drazner MH, Thompson B, Rosenberg PB, Kaiser PA, Boehrer JD, Baldwin BJ, et al. Comparison of impedance cardiography with invasive hemodynamic measurements in patients with heart failure secondary to ischemic or nonischemic cardiomyopathy. Am J Cardiol. 2002;89(8):993-5.
23. Sageman WS, Riffenburgh RH, Spiess BD. Equivalence of bioimpedance and thermodilution in measuring cardiac index after cardiac surgery. J Cardiothorac Vasc Anesth. 2002;16(1):8-14.
24. Yung GL, Fedullo PF, Kinninger K, Johnson W, Channick RN. Comparison of impedance cardiography to direct Fick and thermodilution cardiac output determination in pulmonary arterial hypertension. Congest Heart Fail. 2004;10(2 Suppl 2):7-10.
25. Van De Water JM, Miller TW, Vogel RL, Mount BE, Dalton ML. Impedance cardiography: the next vital sign technology? Chest. 2003;123(6):2028-33.
26. Ventura HO, Taler SJ, Strobeck JE. Hypertension as a hemodynamic disease: the role of impedance cardiography in diagnostic, prognostic, and therapeutic decision making. Am J Hypertens. 2005;18(2 Pt 2):26S-43S.
27. Thompson B, Drazner MH, Dries DL, Yancy CW. Systolic time ratio by impedance cardiography to distinguish preserved vs impaired left ventricular systolic function in heart failure. Congest Heart Fail. 2008;14(5):261-5.
28. Lababidi Z, Ehmke DA, Durnin RE, Leaverton PE, Lauer RM. The first
derivative thoracic impedance cardiogram. Circulation. 1970;41(4):651-8.
29. Tahvanainen A, Koskela J, Leskinen M, Ilveskoski E, Nordhausen K, Kähönen M, et al. Reduced systemic vascular resistance in healthy volunteers with presyncopal symptoms during a nitrate-stimulated tilt-table test. Br J Clin Pharmacol. 2011;71(1):41-51.
30. DeMarzo AP. Using impedance cardiography with postural change
to stratify patients with hypertension. Ther Adv Cardiovasc Dis. 2011;5(3):139-48.
31. Limper U, Gauger P, Beck LE. Upright cardiac output measurements
in the transition to weightlessness during parabolic flights. Aviat Space Environ Med. 2011;82(4):448-54.
32. Gielerak G, Piotrowicz E, Krzesinski P, Kowal J, Grzeda M, Piotrowicz R. The effects of cardiac rehabilitation on haemodynamic parameters measured by impedance cardiography in patients with heart failure. Kardiol Pol. 2011;69(4):309-17.
33. Khan FZ, Virdee MS, Hutchinson J, Smith B, Pugh PJ, Read
PA, et al. Cardiac resynchronization therapy optimization using noninvasive cardiac output measurement. Pacing Clin Electrophysiol. 2011;34(11):1527-36.
34. Balachandran JS, Bakker JP, Rahangdale S, Yim-Yeh S, Mietus JE, Goldberger AL, et al. Effect of mild, asymptomatic obstructive sleep apnea on daytime heart rate variability and impedance cardiography measurements. Am J Cardiol. 2012;109(1):140-5.
35. de Zambotti M, Covassin N, De Min Tona G, Sarlo M, Stegagno L. Sleep
onset and cardiovascular activity in primary insomnia. J Sleep Res. 2011;20(2):318-25.
36. Moertl MG, Schlembach D, Papousek I, Hinghofer-Szalkay H, Weiss
EM, Lang U, et al. Hemodynamic evaluation in pregnancy: limitations
of impedance cardiography. Physiol Meas. 2012;33(6):1015-26.
37. San-Frutos L, Engels V, Zapardiel I, Perez-Medina T, Almagro-Martinez
J, Fernandez R, et al. Hemodynamic changes during pregnancy and postpartum: a prospective study using thoracic electrical bioimpedance. J Matern Fetal Neonatal Med. 2011;24(11):1333-40.
38. Tomsin K, Mesens T, Molenberghs G, Gyselaers W. Venous pulse transit time in normal pregnancy and preeclampsia. Reprod Sci. 2012;19(4):431-6.
39. Tang WH. Impedance monitoring in heart failure: are we really measuring hemodynamics? Am Heart J. 2009;158(2):152-3.
40. Sanford T, Treister N, Peters C. Use of noninvasive hemodynamics in
hypertension management. Am J Hypertens. 2005;18(2 Pt 2):87S-91S.
41. Stason WB. Hypertension: a policy perspective, 1976-2008. J Am Soc Hypertens. 2009;3(2):113-8.
42. Ferrario CM, Basile J, Bestermann W, Frohlich E, Houston M, Lackland DT, et al. The role of noninvasive hemodynamic monitoring in the evaluation and treatment of hypertension. Ther Adv Cardiovasc Dis. 2007;1(2):113-8.
43. Flack JM. Noninvasive hemodynamic measurements: an important advance in individualizing drug therapies for hypertensive patients. Hypertension. 2006;47(4):646-7.
44. Smith RD, Levy P, Ferrario CM; Consideration of Noninvasive Hemodynamic Monitoring to Target Reduction of Blood Pressure Levels Study Group. Value of noninvasive hemodynamics to achieve blood pressure control in hypertensive subjects. Hypertension. 2006;47(4):771-7.
46. Steingrub JS, Celoria G, Vickers-Lahti M, Teres D, Bria W. Therapeutic
impact of pulmonary artery catheterization in a medical/surgical ICU.
Chest. 1991;99(6):1451-5.
47. Aoka Y, Hagiwara N, Kasanuki H. Heterogeneity of hemodynamic parameters in untreated primary hypertension, and individualization of antihypertensive therapy based on noninvasive hemodynamic measurements. Clin Exp Hypertens. 2013;35(1):61-6.
48. Nazario Leao R, Marques da Silva P. Diastolic dysfunction in hypertension. Hipertens Riesgo Vasc. 2017;34(3):128-39.
49. McFetridge-Durdle JA, Routledge FS, Parry MJ, Dean CR, Tucker B. Ambulatory impedance cardiography in hypertension: a validation study. Eur J Cardiovasc Nurs. 2008;7(3):204-13.
50. Gardner SF, Schneider EF. 24-Hour ambulatory blood pressure monitoring in primary care. J Am Board Fam Pract. 2001;14(3):166-71.
51. Sherwood A, McFetridge J, Hutcheson JS. Ambulatory impedance cardiography: a feasibility study. J Appl Physiol (1985). 1998;85(6):2365-9.
52. Barnes VA, Johnson MH, Treiber FA. Temporal stability of twenty-four-hour ambulatory hemodynamic bioimpedance measures in African American adolescents. Blood Press Monit. 2004;9(4):173-7.
53. Licht CM, de Geus EJ, Penninx BW. Dysregulation of the autonomic nervous system predicts the development of the metabolic syndrome. J Clin Endocrinol Metab. 2013;98(6):2484-93.
54. Sramek BB TJ, Hojerov M, Cervenka V. Normohemodynamic goal -oriented antihypertensive therapy improves the outcome. [abstract]. In: 11th Scientific Meeting, New York (NY), 1996. Am J Hypertens. 1996;9:141A.
55. Sharman DL, Gomes CP, Rutherford JP. Improvement in blood pressure control with impedance cardiography-guided pharmacologic decision making. Congest Heart Fail. 2004;10(1):54-8.
56. Krzesinski P, Gielerak G, Kowal J, Piotrowicz K. Usefulness of impedance
cardiography in optimisation of antihypertensive treatment in patients with metabolic syndrome: a randomised prospective clinical trial. Kardiol Pol. 2012;70(6):599-607.
57. Krzesinski P, Gielerak GG, Kowal JJ. A "patient-tailored" treatment of hypertension with use of impedance cardiography: a randomized, prospective and controlled trial. Med Sci Monit. 2013 Apr 5;19:242-50.
58. Krzesinski P, Gielerak G, Stanczyk A, Piotrowicz K, Skrobowski A. Who benefits more from hemodynamically guided hypotensive therapy? The experience from two randomized, prospective and controlled trials. Ther Adv Cardiovasc Dis. 2016;10(1):21-9.
59. Krzesinski P, Gielerak G, Stanczyk A, Piotrowicz K, Uzię bło-Życzkowska B, Banak M, et al. The effect of hemodynamically-guided hypotensive therapy in one-year observation: randomized, prospective and controlled trial (FINEPATH study). Cardiol J. 2016;23(2):132-40.