The study of bacterioplankton dynamics in the
Berlengas Archipelago (West coast of Portugal)
by applying the HJ‐biplot method
SUSANA MENDES 1,2, M.J. FERNÁNDEZ‐GÓMEZ 2, M.P. GALINDO‐VILLARDÓN 2,
F. MORGADO 3, P. MARANHÃO 1,4, U. AZEITEIRO 4,5 & P. BACELAR‐NICOLAU 4,5
Mendes, S., M.J. Fernández-Gómez, M.P. Galindo-Villardón, F. Morgado, P. Maranhão, U. Azeiteiro & P. Bacelar-Nicolau2009. The study of bacterioplankton dynamics in the Berlengas Archipelago (West coast of Portugal) by applying the HJ-biplot method. Arquipélago. Life and Marine Sciences 26: 25-35.
The relationship between bacterioplankton and environmental forcing in the Berlengas Archipelago (Western Coast of Portugal) were studied between February 2006 and February 2007 in two sampling stations: Berlenga and Canal, using an HJ-biplot. The HJ-biplot showed a simultaneous display of the three main metabolic groups of bacteria involved in carbon cycling (aerobic heterotrophic bacteria, sulphate-reducing bacteria and nitrate-reducing bacteria) and environmental parameters, in low dimensions. Our results indicated that bacterial dynamics are mainly affected by temporal gradients (seasonal gradients with a clear winter versus summer opposition), and less by the spatial structure (Berlenga and Canal). The yearly variation in the abundance of aerobic heterotrophic bacteria were positively correlated with those in chlorophyll a concentration, whereas ammonium concentration and temperature decreased with increasing phosphates and nitrites concentration. The relationship between aerobic heterotrophic bacteria, chlorophyll a and ammonium reveals that phytoplankton is an important source of organic substrates for bacteria.
Key words: Berlengas Natural Reserve, aerobic heterotrophic bacteria, sulphate-reducing bacteria, nitrate-reducing bacteria
Susana Mendes (e-mail: smendes@estm.ipleiria.pt); 1GIRM-Research Group on Marine Resources, Polytechnic Institute of Leiria, School of Tourism and Maritime Technology, Campus 4, PT-2520-641 Peniche, Portugal; 2University of Salamanca, Department of Statistics, ES-37007 Salamanca, Spain; 3CESAM-Centre for Environmental and Marine Studies and Department of Biology, University of Aveiro, PT-3810-193 Aveiro, Portugal; 4IMAR - Institute of Marine Research, University of Coimbra, Department of Zoology,
PT-3004-517 Coimbra, Portugal; 5Open University, Department of Sciences and
Technology, PT-1269-001 Lisboa, Portugal.
The Berlengas Natural Reserve (BNR) is an archipelago formed by 3 groups of islands (Berlenga, Estelas and Farilhões) located 5.7 miles from Cabo Carvoeiro (Peniche). It was created in 1981, aiming to preserve a rich natural
heritage and to ensure sustainable development of human activities in the area. The Reserve has a total area of 9560 hectares, 9456 of which are marine. The fauna is characteristic, very rich, diverse and peculiar (Rodrigues et al. 2008).
Despite its known biodiversity, the few existing marine scientific studies were carried out only after the establishment of the BNR. Azeiteiro et al. (1997) and Pardal & Azeiteiro (2001) studied the macrozooplankton distribution and several studies addressed the macrobenthos communities (Almeida 1996; Bengala et al. 1997a, 1997b, 1997c; Metelo 1999; Neto 1999; Neto et al. 1999).
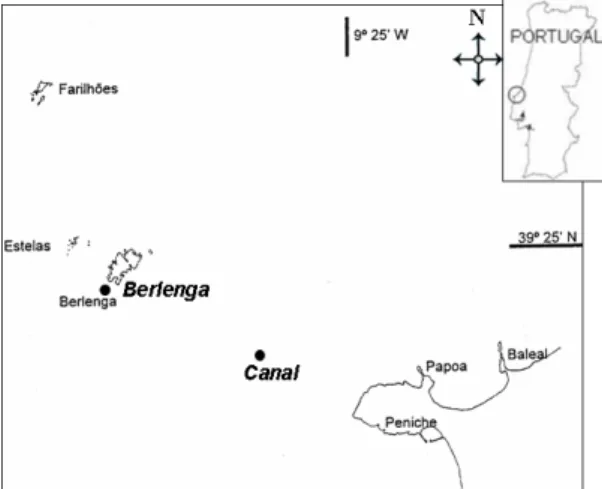
Fig. 1. Berlengas Archipelago with its 3 groups of islands and the location of the sampling stations (●). Microbes are a key component of the structure and function of aquatic ecosystems, through their involvement in the various nutrient biogeochemical cycles namely in coastal areas (Wetz et al. 2008), and in the NW Iberian margin upwelling system (Barbosa et al. 2001).
Until now, no studies have been carried out to assess this component of the ecosystem in the BNR. Because of bacterial major role in planktonic microbial food webs (they comprise an important share of plankton biomass) and their activities impact on ecosystem metabolism and function (Gasol & Duarte 2000) this preliminary study in the BNR has a clear ecological relevance.
The present study aimed to investigate the annual dynamics (February 2006 – February 2007) of three main metabolic groups of heterotrophic bacteria: aerobic heterotrophic bacteria (AHB), sulphate-reducing bacteria (SRB) and nitrate-reducing bacteria (NRB), and to identify the key factors (among various physical
and chemical parameters) that control the annual dynamics of the bacterioplankton in the Berlengas archipelago area, by an HJ-biplot (Galindo 1986; Galindo & Cuadras 1986). The HJ-biplot analysis is an extension of the classical biplots introduced by Gabriel in 1971 (Gabriel 1971, 1972; Gabriel & Odoroff 1990). The usefulness of HJ-biplot has been showed in many fields; for example in Biology (Ruiz et al. 2001; Martínez-Ruiz & Fernández-Santos 2005; Cabrera et al. 2006; Martínez-Ruiz et al. 2007); in Geology (García-Talegón et al. 1999) and Medicine (Pedraz et al. 1985), etc.
MATERIALS AND METHODS
STUDY SITE AND FIELD PROGRAM
The BNR is an archipelago formed by 3 groups of islands (Berlenga, Estelas and Farilhões) located 5.7 miles from Peniche (Portugal). The sea floor consists primarily of irregular hard bottom substrate (i.e. rocks covered with sessile biota, including a variety of algae, sponges, hydrozoans, anemones, crustaceans, sea urchins and tunicates).
The two sampling sites used were Berlenga (inside BNR, 39º24.70’ N, 9º31.22’ W) and Canal (39º24.56’ N, 9º26.70’ W) (Fig. 1). Water samples were collected monthly from subsurface water (0.2 to 0.4 m depth) between February 2006 and February.
DETERMINATION OF PHYSICAL AND CHEMICAL
PARAMETERS
Samples were analysed in situ for salinity and temperature (WTW MultiLine P4 portable meter). Water samples for chemical analyses and chlorophyll a quantification were collected and immediately stored in the dark at low temperature (4o C), until further processing was possible. In
the laboratory these water samples were filtered through GF/C filters (1.2 μm pore diameter), for quantification of photosynthetic pigments. Filtrates were used for determination of nutrient contents. Samples were also analysed in the laboratory (in triplicate) for their content in silica, nitrate, nitrite, ammonium, phosphate and chlorophyll a (Strickland & Parsons 1972).
SAMPLING PROCEDURE AND ENUMERATION OF VIABLE BACTERIA
Water samples (1 L) for the enumeration of viable bacteria were collected in parallel to those obtained for physical and chemical analyses. Samples were collected in sterile glass flasks, filled to capacity, sealed with gas-tight rubber stoppers and immediately placed on ice until processing in the laboratory (3 h later). Numbers of viable AHB, SRB and NRB were estimated by MPN method (Bacelar-Nicolau et al. 2003). Eight replicate ten-fold dilution series of water samples were prepared in appropriate selective liquid media (below) in multiwell plates (Bacelar-Nicolau et al. 2003). These were incubated at room temperature, in the dark, for 2 weeks (aerobes) or 4 weeks (anaerobes). The presence of bacteria was scored positive on the basis of turbidity or precipitate development, and confirmed by microscopic observation. Growth of SRB and NRB required strict anaerobic procedures that were used at all times (Strickland & Parsons 1972). YPG, VMN and the saltwater Widdel and Back media were used, respectively for AHB, SRB and NRB (Bacelar-Nicolau et al. 2003). In all media the concentration of NaCl was adjusted to 30 g.L-1, and pH was adjusted to 7.
STATISTICAL ANALYSIS
Data were organized in a matrix: eight environmental variables and the abundance of the three metabolic groups of bacteria studied (AHB, SRB and NRB) at the two sites over the 12 months forming a data matrix of size 24 x 11 (the data were normalized by columns to homogenize the table).
The HJ-biplot is an exploratory data analysis method that looks for hidden patterns in the data matrix. The method is in some ways similar to correspondence analysis but is not restricted to frequency data. The HJ-biplot is a joint representation, in a low dimensional vector space (usually a plan), of the rows and columns of X, using markers (points/vectors), for its rows and for its columns. The markers are obtained from the usual singular value decomposition (SVD) of the data matrix. The rules for the interpretation of the HJ-biplot are a combination of the rules used in other multidimensional scaling techniques,
correspondence analysis, factor analysis and classical biplots: 1) the distances among row markers are interpreted as an inverse function of similarities, in such a way that closer markers (individuals) are more similar. This property allows for the identification of clusters of individuals with similar profiles; 2) the lengths of the column markers (vectors) approximate the standard deviation of the variables; 3) the cosines of the angles among the column vectors approximate the correlations among variables in such a way that small acute angles are associated with variables with high positive correlations; obtuse angles near to the straight angle are associated with variables with high negative correlations and right angles are associated with non-correlated variables. In the same way, the cosines of the angles among the variable markers and the axes (Principal Components) approximate the correlations between them. For standardized data, these approximate the factor loadings in factor analysis and 4) the order of the orthogonal projections of the row markers (points) onto a column marker (vector) approximates the order of the row elements (values) in that column. The larger the projection of an individual point onto a variable vector is, the more this individual deviates from the average of that variable.
Several measurements are essential for a correct HJ-biplot interpretation (Galindo 1986; Galindo & Cuadras 1986). For instance, the relative contribution of the factor to the element is the relative variability of the variable explained by a factor or dimension. Also, for a point (row or column) on a factorial plan, the quality of representation can be defined by adding the two relative contributions of these factors to the element. Only points with a high quality of representation can be properly interpreted. These indices will be indicated, for the rows and for the columns of the data matrix. HJ-biplot has the advantage that it is a simultaneous representation and achieves an optimum quality of representation for both for rows and columns, both represented on the same reference system. Calculations and graphs shown in this work were done using Classical Biplot software (Villardón [cited 2009; see Acknowledgements]).
RESULTS
The variation patterns of the environmental and biological parameters, at sites Berlenga and Canal are shown in Figure 2. Water temperature showed a similar unimodal pattern at both stations, with max.in summer (23.5 ºC) and min.in winter (13 ºC) (Figs. 2a and 2d). The concentration of
chlorophyll a (Chl a) shows three peaks at both sites (Figs. 2a and 2d). At Berlenga, two moderate peaks of Chl a (May 2006 and January 2007) and broad maxima from July to October 2006 (Fig. 2a). At Canal, one moderate peak appeared in April 2006, and two higher peaks of Chl a appeared in October 2006 and December 2006 (Fig. 2d).
Fig. 2. Variation patterns of the environmental parameters. (a), (b), (c), (g) Berlenga; (d), (e), (f); (g) Canal
The concentration of silica showed different patterns in the two sites (Figs. 2b and 2e). At Berlenga, minimum values coincide with summer and autumn 2006, while at Canal there are two minimum values in May and October-November 2006. Phosphate concentration was fairly constant throughout the year and similar in the two sites, reaching maxima values in March 2006 (Figs. 2b and 2e). Salinity (Fig. 2g) varied between 32 and 36 with maxima in April 2006 and October to December 2006. Nitrogen dynamics are shown in Figs. 2c and 2f. Nitrite concentration was low and fairly similar at Berlenga and Canal. Nitrate and ammonium showed similar variation patterns, at the two sites, from January to September 2006, with a peak of ammonium concentration in April which coincided with a decrease of nitrate concentration. Between September and December
2006 patterns were different, with a peak of ammonium concentration at Berlenga in October, a peak of nitrate at Canal in November.
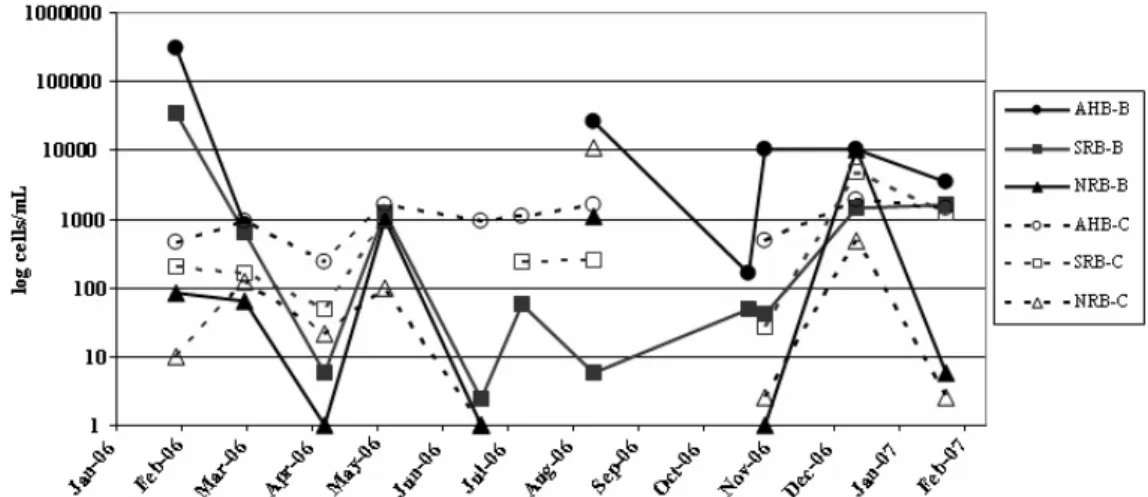
All metabolic groups were detected throughout the year at both sites (Fig. 3). AHB were, in average, present in greater numbers than SRB or NRB and showed greater number and fluctuations at Berlengas than Canal, with maxima values in February and August 2006 as well as between November and December 2006. SRB were, in average, present in greater numbers than NRB, at Berlengas, but the opposite was observed in Canal, where average numbers of NRB were greater than those of SRB. NRB showed similar patterns (and average numbers as well as standard deviation) and at both sites, although greater numbers at Canal, except for winter 2007 when numbers were greater at Berlengas.
Fig. 3. Variation of physicochemical and biological parameters at Berlenga and Canal sampling sites during the annual cycle. AHB - aerobic heterotrophic bacteria, SRB - sulphate-reducing bacteria, NRB - nitrate-reducing bacteria. Points “B” and “C” correspond to the sites Berlenga and Canal.
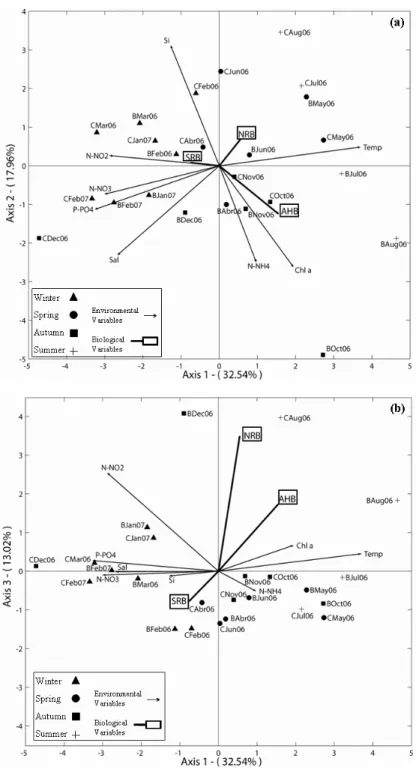
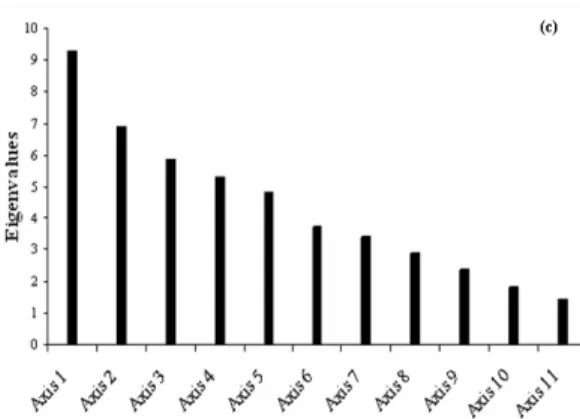
The HJ-biplot analysis of environmental and biological parameters indicates that the system dynamics was independent of location (Berlenga, Canal) and mainly controlled by a seasonal gradient – spring/summer versus autumn/winter (Fig. 4a). The first three axes of the HJ-biplot analysis explained 63.52% of data variability (Fig. 4c and Table 1). The first axis (32.54%) revealed a strong opposition between samples collected in spring/summer and those collected in
autumn/winter, independently of site of origin (Fig. 4a).
Table 1. Eigenvalues and Explained Variance (EV) Axis Eigenvalue E.V. (%) Cum. (%) Axis 1 9.269 32.54 32.54 Axis 2 6.886 17.96 50.50 Axis 3 5.862 13.02 63.52 Axis 4 5.308 10.67 74.20
Fig. 4. HJ-Biplot representation. Projection of samples (points) and variables (arrows) onto plan of maximum inertia. Points “B” and “C” correspond to the sites Berlenga and Canal, the first three letters signify the month and the two second numbers indicate the year (2006 or 2007); AHB: aerobic heterotrophic bacteria, SRB: sulphate-reducing bacteria, NRB: nitrate-sulphate-reducing bacteria; Si: silica, P-PO4: phosphate, N-NO2: nitrite, N-NO3: nitrate,
Fig. 4c). Eigenvalues barplot from HJ-Biplot analysis. Moreover, this axis is characterized by phosphate, nitrate, nitrite, salinity and mostly by temperature. Therefore, the temperature characterizes the positive side of axis 1 (spring/summer samples), while phosphate, nitrate, nitrite and salinity appeared to be characteristic of the opposite side (autumn/winter samples at the left extreme of this axis). Hence, this is the gradient which defines axis 1. The temperature presented a negative correlation with those variables: higher values of temperature imply lower values of phosphate, nitrite, nitrate and salinity. Together, however, phosphate, nitrate, nitrite and salinity were positively correlated. The second axis of variability (17.96%) is mainly characterized by silica, chlorophyll a and ammonium (Fig. 4a). Silica defines the top of this axis and presented a negative correlation with the other two variables, chlorophyll a and ammonium (which are positively correlated). Furthermore, it was observed that chlorophyll a and ammonium are independent of nitrate and phosphate. The same relationship occurred between the pairs of salinity and chlorophyll a, silica and nitrate and salinity and phosphate. For the first principal plan AHB, NRB and SRB showed lower quality of representation (Table 2). This fact justifies the weak significance of these variables on the plan 1-2 (Fig. 4a). Particularly, in the plan 1-3 it is possible to observe that axis 3 is characterized by NRB (Fig. 4b and Table 2). Moreover, only in plan 1-4 and 3-4 (graphic representation not showed), AHB had a superior quality of representation (Table 2). These plans revealed that AHB increases with temperature and
chlorophyll a, but decreases with the increase of phosphate, nitrite and ammonium concentration. Specific factorial axes that most contributed are summarized in Table 2 (as a function of the relative contribution of the factor to the element, both for the samples as for the environmental and biological variables). Shaded cells indicate the different factorial axes where the greatest relationship with the samples (Table 2a) and environmental and biological variables (Table 2b) were observed.
Table 2. Relative contributions of the factor to the element. The number refers of its maximum quality of representation on each axis (on a scale of 1000): Table 2a) Samples
Samples Axis 1 Axis 2 Axis 3
BFeb06 37 3 65 BMar06 607 169 5 BAbr06 3 90 137 BMay06 541 330 25 BJun06 152 19 115 BJul06 715 3 2 BAug06 468 77 73 BOct06 154 499 15 BNov06 73 188 3 BDec06 35 64 723 BJan07 493 84 186 BFeb07 821 97 0 CFeb06 42 304 190 CMar06 615 44 3 CAbr06 80 104 293 CMay06 500 29 97 CJun06 0 517 158 CJul06 439 404 92 CAug06 72 336 441 COct06 362 178 4 CNov06 31 16 108 CDec06 604 95 0 CJan07 520 77 136 CFeb07 831 54 6 Table 2b) Variables
Variables Axis 1 Axis 2 Axis 3 Axis 4
Si 99 593 1 23
DISCUSSION
The Portuguese west coast is affected by weak westerly winds during winter, alternating with relatively strong northerly winds during spring and summer. Because of the north-south orientation of the coast, the increase and steadiness of these northerly along-shore winds support the occurrence of coastal upwelling that, in this area, has its maximum intensity from April to September (Fiúza 1983; Moita et al. 2003; Resende et al. 2007). The period between August and October (late summer–early autumn) is generally characterized by a relaxation of the upwelling events (Fiúza 1983). During the upwelling period, primary production is enhanced in shelf areas (Tenore et al. 1995).The fate of this new dissolved and particulate matter largely depends upon the recycling efficiency within the pelagic microbial food web (Barbosa et al. 2001). Heterotrophic bacteria play a pivotal role in the biogeochemical cycles of marine ecosystems and are the major consumers of dissolved organic carbon (Barbosa et al. 2001). Besides the heterotrophic AHB, NRB and SRB two other metabolic groups were targetted (ammonium-oxidising bacteria and nitrite-(ammonium-oxidising bacteria) by the MPN method in the present study, although unsuccessfully, possibly due to their low numbers. Also carbon and sulphate were not determined, which would have been interesting, as they are central to understanding the biogeochemical cycles in which AHB, NRB and SRB are involved. It would have also been important to determine total bacterial numbers, in
addition to the performed viable counts by MPN, however this was not possible to accomplish. Culturable viable bacterial numbers are lower than total bacteria and each set of data allows different analysis of information. In this work we chose to study dynamics of the three main metabolic bacterial groups involved in biogeochemical cycles which would have not been possible if considering the total number of bacteria.
In this study, AHB showed a general increase during late spring indicating that the main factors regulating their abundance in the studied aquatic systems are temperature, organic and inorganic substrates. In fact, the increase in abundance of AHB and also NRB during the annual period was mainly associated with increasing temperature and chlorophyll a and, to a lesser degree, ammonium, as found by other authors (Ducklow & Shiah 1993; Hoch & Kirchman 1993; Cunha et al. 2000; Bacelar-Nicolau et al. 2003). Moreover, globally AHB numbers decrease with the increase of phosphate, nitrite and nitrate concentrations. The relation between AHB and chlorophyll a and ammonium suggests that phytoplankton is an important source of organic substrates for bacteria (e.g. Barbosa et al. 2001; Bacelar-Nicolau et al. 2003). The chlorophyll a content is widely used as a measure of the organic carbon available to support oxygen consuming processes (Jonas & Tuttle 1990), where degradation of phyto-plankton-derived organic matter has an essential ecological role for carbon and nitrogen bio-geochemistry in coastal ecosystems (Wetz et al. 2008). The negative correlation existing between AHB numbers and silica concentration also sup-ports the importance of phytoplankton to AHB. Phosphorus (as phosphate) appeared as a limiting resource both to the bacterioplankton and phyto-plankton communities, as found by other authors (Currie 1990; Rivkin & Anderson 1997; Bacelar-Nicolau et al. 2003). In fact this may also be due to the fact that N:P ratio was above the Redfield only ratio value during November 2006 at Berlenga and December 2006 at Canal, and slightly below that value in April 2006 and May 2006 (not shown). At both sites, when N:P ratio was slightly below or above the Redfield value there was an peak in ammonium concentration, and a peak of nitrate in Canal.
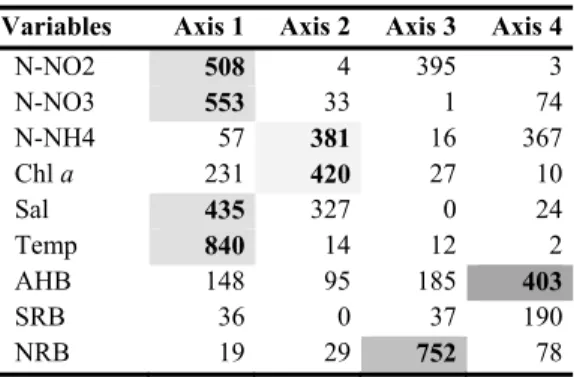
Table 2b). Variables (continuation)
Variables Axis 1 Axis 2 Axis 3 Axis 4
N-NO2 508 4 395 3 N-NO3 553 33 1 74 N-NH4 57 381 16 367 Chl a 231 420 27 10 Sal 435 327 0 24 Temp 840 14 12 2 AHB 148 95 185 403 SRB 36 0 37 190 NRB 19 29 752 78
The quality of representation (Table 2) of NRB and SRB was very weak on the plan 1-2, similar in plan 1-3 for the SRB, and NRB showed the best representation in axis 3. However, the observed opposition between SRB and both NRB, and AHB in the two first plans may be attributed to competition for carbon, as suggested for the Mondego estuary by Bacelar-Nicolau et al. (2003). NRB dynamics, besides being sug-gestively related to increasing temperature and chlorophyll a (upwelling months) also appeared to a great extent correlated with increasing nitrite concentrations (particularly in December and August 2006), a direct product of microbial denitrification (e.g. Herbert 1999) and with increasing silica concentrations (indicating decreasing diatom phytoplankton). This latter relationship is not yet understood.
The present work points to the strong involvement of AHB, NRB and SRB in the biogeochemical cycling of carbon and nitrogen, through the water column. Even though sites were not oxygen depleted (data not shown) anaerobic metabolisms may occur in particular microniches such as marine snow particles (e.g. Azam 1998). Future objectives will be to investigate the different proportions of bacterial mortality attributable to viral lysis or bacterivory at different stages of a phytoplankton bloom and to characterize bacterioplankton functional assem-blages that transform specific components of the coastal seawater dissolved organic carbon. Future work also aims to further identify and investigate some of the viable cultivable bacteria particularly in relation to their relevance for biogeochemical cycles at the studied sites.
ACKNOWLEDGEMENTS
This study was funded by IMAR-Institute of Marine Research and by Instituto Politécnico de Leiria. The authors want to thanks to Júlio and João Laranjeira, the crew of the vessel Julius and to the students of the Escola Superior de Turismo e Tecnologia do Mar (Peniche) who helped in field work. The statistical analyses were run using the Classical Biplot software, available free of charge_(http://biplot.usal.es/ClassicalBiplot/
[Villardón cited 2009]). The authors are grateful to the contributors who have made such a valuable tool available. The authors wish to thank the anonymous referees for their helpful and constructive comments on the manuscript.
REFERENCES
Almeida, A. 1996. Structure and spatial variability of the rocky fish fauna in the protected marine «Reserva Natural da Berlenga» (Portugal). Arquivo. Museu Bocage, Nova Série II: 633-642. Azam, F. 1998. Microbial control of oceanic carbon
flux: the plot thickens. Science 280: 694-696. Azeiteiro, U., M. Pardal, J. Neto, I. Metelo & N.
Bengala 1997. Caracterização das comunidades planctónicas da Reserva Natural da Berlenga e seu possível padrão de migração: estudo preliminar. IMAR – Instituto do Mar (CIC), Instituto da Conservação da Natureza (ICN) – Reserva Natural da Berlenga. 36 pp. [In Portuguese]
Bacelar-Nicolau, P., L.B. Nicolau, J.C. Marques, F. Morgado, R. Pastorinho & U.M. Azeiteiro 2003. Bacterioplankton dynamics in the Mondego estuary (Portugal). Acta Oecologica 24: 67-75.
Barbosa, A.B., H.M. Galvão, P.A. Mendes, P.A. Álvarez-Salgado, F.G. Figueiras & I. Joint 2001. Short-term variability of heterotrophic bacterioplankton during upwelling off the NW Iberian margin. Progress in Oceanography 51: 339-359.
Bengala, N., I. Metelo, J. Neto & M. Pardal 1997a. Dinâmica anual de espécies chave da ilha da Berlenga. IMAR – Instituto do Mar (CIC), Instituto da Conservação da Natureza (ICN) – Reserva Natural da Berlenga. 38 pp. [In Portuguese] Bengala, N., I. Metelo, J. Neto & M. Pardal 1997b. A
ilha da Berlenga. Breve caracterização dos biótopos marinhos da zona intermareal e submareal. IMAR – Instituto do Mar (CIC), Instituto da Conservação da Natureza (ICN) – Reserva Natural da Berlenga. 38 pp. [In Portuguese]
Bengala, N., I. Metelo, J. Neto & M. Pardal 1997c. Variação sazonal das principais espécies de macroalgas da Reserva Natural da Berlenga. IMAR – Instituto do Mar (CIC), Instituto da Conservação da Natureza (ICN) – Reserva Natural da Berlenga. 18 pp. [In Portuguese]
Cabrera, J.M.G., M.R.F. Martínez, E.J.M. Mateos & S. Vicente-Tavera 2006. Study of the evolution of air pollution in Salamanca (Spain) along a five-year period (1994–1998) using HJ-Biplot simultaneous
representation analysis. Environmental Modelling & Software 21: 61-68.
Cunha, M.A., M.A. Almeida & F. Alcântara 2000. Patterns of ectoenzymatic and heterotrophic bacterial activities along a salinity gradient in a shallow tidal estuary. Marine Ecology Progress Series 204: 1-12.
Currie, D.J. 1990. Large-scale variability and interactions among phytoplankton, bacterio-plankton, and phosphorous. Limnology and Oceanography 35: 1437-1455.
Ducklow, H.W. & F.K. Shiah 1993. Estuarine bacterial production. Pp. 261-264 in: Ford, T. (Ed.). Aquatic Microbiology: An ecological approach. Blackwell, London.
Fiúza, A. 1983. Upwelling patterns of Portugal. Pp. 85– 98 in: Suess, E. & J. Thiede (Eds). Coastal Upwelling, its Sedimentary record. Part A: Responses of the Sedimentary Regime to Present Coast Upwelling, Plenum Press, New York. Gabriel, K.R. 1971. The biplot-graphic display of
matrices with application to principal component analysis. Biometrika 58: 453-467.
Gabriel, K.R. 1972. Analysis of meteorological data by means of canonical decomposition and Biplots. Journal of Applied Meteorology 11: 1071-1077. Gabriel, K.R. & C.L. Odoroff 1990. Biplots in
biomedical research. Statistics in Medicine 9: 469-485.
Galindo, M.P. 1986. Una alternativa de representación simultánea: HJ-Biplot. Qüestiio 10: 13-23. [In Spanish] [In Spanish]
Galindo, M.P. & C.M. Cuadras 1986. Una extensión del método Biplot y su relación con otras técnicas. Publicaciones de Bioestadística y Biomatemática. Universidad de Barcelona. 17 pp. [In Spanish] García-Talegón, J., M.A. Vicente, E.
Molina-Ballesteros & S. Vicente-Tavera 1999. Determination of the origin and evolution of building stones as a function of their chemical composition using the inertia criterion based on an HJ-biplot. Chemical Geology 153: 37-51.
Gasol, J.M. & C.M. Duarte 2000. Comparative analyses in aquatic microbial ecology: How far do they go? FEMS Microbiology Ecology 31: 99-106. Herbert, R.A. 1999. Nitrogen cycling in coastal marine
ecosystems. FEMS Microbiology Ecology 563-590. Hoch, M.P. & D.L. Kirchman 1993. Seasonal and
interannual variability in bacterial production and biomass in a temperate estuary. Marine Ecology Progress Series 98: 283-295.
Jonas, R.B. & J.H. Tuttle 1990. Bacterioplankton and Organic Carbon Dynamics in the Lower Meso-haline Chesapeake Bay. Applied and Environ-mental Microbiology 56: 747-757.
Martínez-Ruiz, C., B. Fernández-Santos & J.M. Gómez-Gutiérrez 2001. Effects of substrate coarseness and exposure on plant succession in uranium-mining wastes. Plant Ecology 155: 79-89. Martínez-Ruiz, C. & B. Fernández-Santos 2005.
Natural revegetation on topsoiled mining-spoils according to the exposure. Acta Oecologica 28: 231-238.
Martínez-Ruiz, C., B. Fernández-Santos, P.D. Putwain & M.J. Fernández-Goméz 2007. Natural and man-induced revegetation on mining wastes: Changes in the floristic composition during early succession. Plant Ecology 155: 79-89.
Metelo, I. 1999. Caracterização das comunidades de crustáceos da ilha da Berlenga. MSc Thesis, F.C.T.U., Coimbra. 77 pp. [In Portuguese]
Moita, M.T., P.B. Oliveira, J.C. Mendes & A.S. Palma 2003. Distribution of chlorophyll a and Gymnodinium catenatum associated with coastal upwelling plumes off central Portugal. Acta Oecologica 24: 125-132.
Neto, J. 1999. Variação espacial e temporal dos moluscos do substrato rochoso da ilha da Berlenga. MSc Thesis, F.C.T.U., Coimbra. 95 pp. [In Portuguese]
Neto, J., N. Bengala, I. Metelo & M. Pardal 1999. Farilhões: breve caracterização do substrato rochoso da zona intermareal e submareal. IMAR – Instituto do Mar (CIC), Instituto da Conservação da Natureza (ICN) – Reserva Natural da Berlenga. 21 pp.
Pardal, M. & U.M. Azeiteiro 2001. Zooplankton biomass, abundance and diversity in a shelf area of Portugal (the Berlenga Marine Natural Reserve). Arquipélago. Life and Marine Sciences 25: 49-62. Pedraz, C., M.P. Galindo, C. De Hoyos, R. Escribano
& V. Salazar-Villalovos 1985. Estudio de los factores socioculturales que influyen en la selección de lactancia natural. Archivos de Pediatría 36: 469-477. [In Spanish]
Resende, P., U. Azeiteiro, F. Gonçalves & M.J. Pereira 2007. Distribution and ecological preferences of diatoms and dinoflagellates in the west Iberian Coastal zone (North Portugal). Acta Oecologica 32: 224-235.
Rivkin, R.B. & M.R. Anderson 1997. Inorganic nutrient limitation of oceanic bacterioplankton. Limnology and Oceanography 42: 730-740. Rodrigues, N.V., P. Maranhão, P. Oliveira & J. Alberto
2008. Guia de Espécies Submarinas – Portugal, Berlengas (1st edition). Instituto Politécnico de Leiria. 231 pp. [In Portuguese]
Strickland, J.D. & T.R. Parsons 1972. A practical hand-book of seawater analysis. Bulletin of Fisheries Research Board. Canada 167: 1-311.
Tenore, K.R., M. Alonso-Noval, M. Alvarez-Ossorio, L.P. Atkinson, J.M. Cabanas, R.M. Cal, H.J. Campos et al. 1995. Fisheries and oceanography off Galicia, NW Spain: Mesoscale spatial and temporal changes in physical processes and resultant patterns of biological productivity.
Journal of Geophysical Research 100:
10943–10966.
Wetz, M.S., B. Hales & P.A. Wheeler 2008. Degradation of phytoplankton-derived organic matter: Implications for carbon and nitrogen biogeochemistry in coastal ecosystems. Estuarine, Coastal and Shelf Science 77: 422-432.