1 Universidade dos Açores, Dep. de Ciências Agrárias, Terra-Chã, 9700 – 851 Angra do Heroísmo, Terceira, Açores, Portugal (Author to whom correspondence should be addressed). Tel.: 00.351.295.402234; Fax: 00.351.295.402205. E-mail: [email protected] 2 Centre for Agri-Environmental Research, Department of Agriculture, The University of Reading, Earley Gate, PO Box 237,
Reading RG6 6AR, UK.
P. A. V. Borges
1and V. K. Brown
2ABSTRACT
The advantages of the complementary use of suction sampling (Vortis) and pitfall trapping in estimating the species richness of arthropods in sown and semi-natural pastures were inves-tigated on three recent isolated oceanic islands in the Azores. In addition, the ability of pitfall trapping and suction sampling to describe species composition and richness were tested in terms of taxonomic and ecological groups. Both suction sampling and pitfall trapping techni-ques were reliable in terms of sampling efficiency, getting a good estimate of the arthropod spe-cies richness as judged by percentage sampling completeness, the ratio of observed to estima-ted species richness. Using the two methods together values of almost 90% completeness were obtained in some guilds. Pitfall and suction alone were reliable in estimating species richness of predatory arthropods (all species) and spiders. Joint data is needed for getting reliable esti-mates for herbivores guilds. In terms of presence-absence data, sap-feeding (suckers) and che-wing herbivores showed very different patterns, with a higher proportion of the former sam-pled exclusively by suction sampling, whereas more chewing species were samsam-pled only by pit-fall traps. Similar patterns were obtained for two guilds of spiders, where more web-building species were sampled only by suction sampling, whereas most other species were sampled only by pitfall trapping. We conclude that pitfall trapping and suction sampling should be conside-red as complementary methods, not as alternatives. We therefore strongly recommend that they be used simultaneously in grassland and agroecosystem community studies, in order to derive reliable estimates of arthropod species composition and richness.
Key words: suction (Vortis), pitfall trapping, pasture arthropods, species composition, spe-cies richness, estimators.
RESUMEN
Estimando la riqueza de especies de artrópodos en los pastizales de las Azores: eficacia de los métodos de succión y las trampas de caída
Se han investigado las ventajas del uso combinado de técnicas de succión (Vortis) y trampas de caída, a la hora de estimar la riqueza de especies de artrópodos en pastizales antrópicos y seminaturales de tres islas oceánicas de las Azores de origen geológico recien-te. Se ha comprobado, además, la capacidad de las trampas de caída y de succión para des-cribir la composición faunística y la riqueza de especies según distintos grupos taxonómi-cos y ecológitaxonómi-cos. Teniendo en cuenta el porcentaje de especies colectado sobre el total esti-mado, ambas técnicas de muestreo resultaron fiables en lo que se refiere a su eficacia, ofre-ciendo buenas estimas de la riqueza de especies de artrópodos. Usando los dos métodos a la vez, se obtuvieron valores de eficacia cercanos al 90% para algunos grupos taxonómi-cos. Las técnicas de succión o de caída por separado fueron fiables para estimar la riqueza de especies de artrópodos predadores (todas las especies) y arañas. Sin embargo, ambas
téc-ESTIMATING SPECIES RICHNESS OF ARTHROPODS IN AZOREAN
PASTURES: THE ADEQUACY OF SUCTION SAMPLING
AND PITFALL TRAPPING
nicas son necesarias para conseguir estimaciones fiables en el caso de los grupos herbívo-ros. En términos de presencia-ausencia, los grupos que se alimentan de savia, los chupado-res y los herbívoros masticadochupado-res mostraron diferentes patrones, con una proporción de colecta más alta en los primeros mediante las técnicas de succión, mientras que la mayoría de las especies masticadoras se pudieron colectar mediante las trampas de caída. Un patrón similar fue obtenido en el caso de las arañas, en donde las especies tejedoras fueron colec-tadas solo gracias a las técnicas de succión, mientras que la mayoría del resto de las espe-cies se capturaron gracias al uso de trampas de caída. Se concluye que estos dos métodos de colecta deben considerarse complementarios y no alternativos. Por tanto, en estudios rea-lizados en pastizales y sistemas agrícolas, se recomienda el uso simultáneo de ambas téc-nicas a fin de obtener estimas fiables de la riqueza de especies y la composición taxonó-mica de artrópodos.
Palabras clave: técnicas de succión (Vortis), trampas de caída, artrópodos de pastizales, composición faunística, riqueza de especies, estimadores.
Introduction
The comprehensive and critical sampling of arthropods is a key requisite in many areas of eco-logical science. Despite this, there is still little con-sensus as to the relative merits of different me-thods. This is mainly because few quantitative com-parisons have actually been undertaken (but see papers in Toft & Riedel, 1995; and particularly Standen, 2000). Furthermore, most are either site specific or focus on particular taxa. In this paper, we aim to compare quantitatively two of the most widely employed methods, in respect of a wide range of insect taxa and spiders. It is also compared the efficacy of methods in different pasture types, known to have different arthropod guild structure and spider species richness (Borges, 1999; Borges & Brown, 1999).
Undoubtedly, two of the most commonly used sampling methods are pitfall trapping and suction sampling. Pitfall traps are frequently used in eco-logical studies, mainly because they are inexpensi-ve, easy to set in the field and can be used conti-nuously over several years. However, their use carries some methodological problems (reviewed in Adis, 1979). In addition, the distribution of spe-cimens in traps may not reflect relative frequencies of species in the field (see Jarosík, 1992) and the method does not provide absolute measures of spe-cies density (Southwood, 1978; Topping & Sunderland, 1992; Dinter, 1995; Sunderland & Topping, 1995; Powell et al., 1996; Southwood & Henderson, 2000), as the number of individuals caught depends partly on their activity as well as habitat characteristics. However, Baars (1979) con-siders that, by continuous trapping, a reliable rela-tive measure of the size of ground-beetle popula-tions can be obtained. Moreover, Downie et al. (1996) concluded that, providing the habitats under study are not too different in terms of vegetation
structure, the relative abundance of a single spe-cies in different places, during a comparable time period, could be assessed. Habitat structure may, however, have serious implications for the inter-pretation of relative abundance data (Halsall & Wratten, 1988; Melbourne et al., 1997; Melbourne, 1999) and there are studies that sug-gest that pitfall trapping is not a suitable method for comparing different species within a habitat (Topping & Sunderland, 1992; Dinter, 1995; Hawthorne, 1995). The use of different killing-pre-serving agents may also cause some distortion of results (Luff, 1968; Southwood, 1978; Adis, 1979). To achieve a more accurate inventory of a commu-nity, various killing-preserving agents can be used simultaneously (Adis, 1979; Borges, 1992).
Despite the limitations of suction methods in the sampling of some types of arthropods (e.g. large epigean soil-dwelling arthropods) (Ausden, 1996; Southwood & Henderson, 2000), this technique is generally recommended for studies of field stratum arthropods in grassland (Southwood, 1978; Törmälä, 1982; Dinter, 1995; Southwood & Henderson, 2000). Southwood & Henderson (2000) review insect suction sampling techniques, with emphasis on the widely used D-vac (Dietrick, 1961) and its adaptations, but also the more recent portable Univac and Vortis suction sampling machi-nes. The entomological and ecological literature, published since 1973, cites 60 papers that have used the D-vac for sampling, mainly Acari, Araneae, Homoptera, Heteroptera, Coleoptera (Staphylinidae, Nitidulidae, Chrysomelidae, Curculionidae), but also other arthropod groups, such as the Acari and Araneae. The D-vac has been used extensively in ecological work (e.g. Southwood et al., 1979 and V. K. Brown and colle-agues subsequently; but see also Morris, 1973, 1990a,b and c; Nagel, 1979; Good & Giller, 1990, 1991) to sample herbivorous insects (Heteroptera,
Homoptera, Thysanoptera, Coleoptera - Chryso-melidae, Curculionidae), but also predators (e.g. Araneae by Gibson et al., 1992), in grasslands. Smaller machines, like the “Univac portable insect suction sampler” (Arnold et al., 1973), have been used less extensively (but see Brown et al., 1987; Evans, 1988; Gange et al., 1989; Galton, 1993). For the D-vac, there has been extensive experimental work on its efficiency (e.g. Smith et al., 1976; González et al., 1977; Simonet et al., 1979; Törmälä, 1982; Harcourt et al., 1983; Hand, 1986) and calibration (Pruess & Whitmore, 1976), while the efficiency of the Univac in grasslands has only been assessed by Henderson & Whitaker (1977).
The smaller suction sampling machines have been developed to replace the heavy, not easily por-table, D-vac in ecological and entomological work. Examples include: 1) the ECHO (Summers et al., 1984), a backpack unit similar to the Univac, in which the arthropods are collected in a cloth net bag; 2) the Ryobi RSV3100E sweeper-vac, descri-bed in Macleod et al. (1994, 1995), and the “Blow & Vac” (Stewart & Wright, 1995) are similar light weight suction sampling devices, consisting mainly of modifications of petrol driven machines nor-mally used to collect leaf litter; 3) the “Vortis” suc-tion machine is a light, portable sucsuc-tion sampling system, developed by Arnold (1994), with many advantages over other suction sampling machines. Here, arthropods are collected directly into contai-ners (several sizes and shapes are available) and not in bags or filters. This enables the operator to take a large number of samples in a short period of time, and prevents the loss of specimens while transfe-rring from the machine to containers. The arthro-pods collected are also sampled without damage and may be returned to their habitat if required. The apparatus is light (7.8 kg) and fully portable (ove-rall height 930 mm) and can be easily operated by one person. The collected material does not impede air flow and the nozzle wind speed is constant (Southwood & Henderson, 2000).
The growing need for land managers and con-servationists to characterise sites, highlights the need for practical ways of sampling arthropod fauna (Buffington & Redak, 1998). Less labour-intensive, though accurate, sampling techniques are required. The present study investigates the level of sampling completeness and the potential for the complementary use of suction sampling (Vortis) and pitfall trapping to estimate the species richness and composition of herbivorous (sap-feeding and chewing species) and predacious arthropods, parti-cularly spiders, in sown and semi-natural pastures
from three oceanic islands, in the Azores. In addi-tion, we assess the predictive value of suction sam-pling and pitfall trapping used on their own as surrogates for describing the species richness of assemblages in twelve sites.
Methods
STUDY AREA AND EXPERIMENTAL DESIGN
This study was undertaken in the Azores, an oceanic volcanic archipelago located in the North Atlantic, roughly between coordinates 37° to 40° N latitude and 25° to 31° W longitude. Two replicates of recently sown (3 years old) and old semi-natural pasture (more than 30 years old) were sampled on three Azorean islands (S. Maria, Terceira and Pico). The replicates were standardised in terms of mana-gement history and were located distanced such that they could be considered as separate sites for statistical purposes (see Borges, 1997, 1999; Borges & Brown, 1999, 2001 for a detailed des-cription of sites).
In all 12 sites (3 islands x 2 pasture types x 2
replicates), an area of at least 900 m2was fenced for
livestock early in 1994, with additional fencing to preclude differential rabbit grazing. At each site, 20
3 x 3 (9 m2) plots were marked with coloured short
wooden posts. The plots were regularly spaced, with a corridor of 5m between each. All sites were grazed regularly by dairy and beef cattle, thereby maintaining their traditional management. Cattle grazing events were carefully managed in liaison with the farmers. Sampling took place at least three weeks after a grazing event, thereby allowing the sward structure to develop. The study was conduc-ted over two consecutive years and four complete samples were obtained (spring, summer and autumn 1994 and summer 1995 to provide a betwe-en year comparison).
SAMPLING METHODS
Pitfall traps. Pitfall trapping comprised periods of seven consecutive days of sampling. A set of twenty pitfall traps (a plastic cup with a trap dia-meter of 110 mm and a depth of 70 mm) was used, and positioned according to a grid configuration, the minimum distance between traps being 5.30 m. Each trap was dug into the ground flush with the substrate in the corner of each plot (30 cm inside), enabling one of the four traps to be used for each sampling occasion. For the present work, it was desirable to have an inexpensive preservative, but with neutral qualities. Ethylene glycol (anti-freeze)
was therefore chosen from potential candidates (e.g. formaldehyde, alcohol, acetic acid) and has been widely used in ecological work. Due precau-tions in handling this liquid in the field and labora-tory, gloves and a nose mask were taken (Hall, 1991). Each trap was half-filled with the preserva-tive with a little detergent (Teepol) added to lower the surface tension of the solution. Each trap was protected against the rain with a white plastic dish cover, fixed to the ground by three pieces of wire, with a consistent space of 2.5-3.0 cm between the ground and pitfall cover. After collection, the sam-ples were stored in tubes with 70% ethanol with some drops of glycerol prior to sorting.
Suction. Two new and identical “Vortis” suction sampling machines (Burkhard Scientific Sales -Ltd., Rickmansworth, Hertfordshire, England) (see Arnold, 1994; Southwood & Henderson, 2000) were used to facilitate between-island sampling.
The collection nozzle samples an area of 0.2 m2. On
each occasion sampling was carried out between 11.00 and 18.00, and only when the vegetation was completely dry and the wind conditions moderate. At each site, four subsamples were taken in each of
the 20 plots, one in each corner (total area: 0.8 m2).
The collection nozzle was held in position for 30 seconds on each occasion. To simplify the sorting process, the four subsamples from a single plot were taken successively without changing the collection vial. Samples were frozen to kill the ar-thropods and stored as for pitfall trap samples.
Since the pastures were grazed regularly, and sampling took place consistently three weeks after a grazing event, the height of the vegetation did not impair the efficiency of the suction sampler. It was also possible for the suction nozzle to be positioned on the ground, which is optimal.
Direct searching. In order to assess the efficacy of each sampling method and the two combined, direct field observation in Spring and Summer 1995 were made, with equal additional sampling effort applied to each plot. This enabled the assess-ment of Orthoptera and adult Lepidoptera, groups that are not readily collected by either of the main methods used in the study.
IDENTIFICATION OF ARTHROPODS
Samples were first sorted into morphospecies, since some taxa are difficult taxonomically. This is a common practice in biodiversity studies and does not compromise scientific accuracy (see Oliver & Beattie, 1996). However, in this study we were able to identify most taxa to species (see Borges, 1997; Borges & Brown, 1999). Identification of juvenile
spiders is usually considered impossible (Churchill & Arthur, 1999), but since the Azorean pasture fauna is not particularly rich, most juveniles could be assigned to species. The same applied to the other groups. The taxonomic groups assigned to each ecological group in the samples were as follows: sap-feeders (referred to subsequently as suckers) – Hemiptera - Heteroptera (Tingidae, Miridae, Lygaeidae, Rhopalidae, Cydnidae and Pentatomidae), Hemiptera - Homoptera (Cicade-lli-dae, Delphaci(Cicade-lli-dae, Cocci(Cicade-lli-dae, Pseudococci(Cicade-lli-dae, Aphididae), Thysanoptera; chewers - Diplopoda, Lepidoptera and Coleoptera (Carabidae, Dryo-pidae, Elateridae, Nitidulidae, AnasDryo-pidae, Chryso-melidae, Rhynchophoridae and Curculionidae); predators - Chilopoda, Pseudoscorpiones, Opilio-nes, Araneae, Hemiptera - Heteroptera (Nabidae, Miridae and Anthocoridae), Thysanoptera (Aelo-thripidae), Plannipenia and Coleoptera (Carabidae, Staphylinidae, Melyridae, Cucujidae and Cocci-nellidae).
DATA ANALYSIS
SAMPLING EFFICIENCY, RICHNESS ESTIMATORS AND ACCUMULATION CURVES
It is very difficult to judge the completeness of the sampling without information on abundance of species. For the herbivores (all species), chewers, suckers, predators (all species) and also Araneae we created three species abundance matrices, one for each method and also the two methods together (5 guilds x 3 methods = 15 matrices) using the 48 available samples (4 sampling periods x 12 pastu-res), and compared observed species richness with predicted (true) species richness using Bootstrap, Michaelis Menten means (MMMean), Chao 1 and first order Jackknife (Jackknife 1) statistical esti-mators calculated with the software program EstimateS version 6.0b1 (Colwell, 2000). These estimators were selected in a range of several pos-sible because represented a lower (Bootstrap; MMMean) and upper (Jackknife 1, Chao 1) bound of true species richness and were useful in determi-ning the extent to which we underestimated actual species richness for the three methods (pitfall, suc-tion, both methods). Curves obtained when ting the true species richness with the four estima-tors were the average of 100 randomizations and were tested for heterogeneity using the Coleman test, that compares the mean randomized species accumulation curve with the curve expected if all the individuals caught over all the samples were randomly assigned to the samples (Colwell &
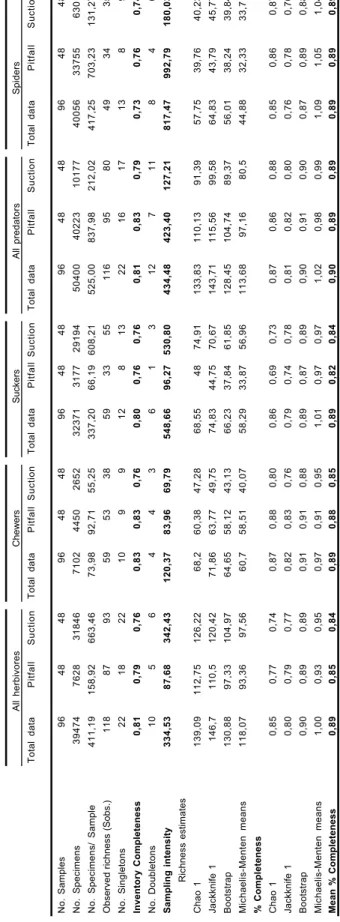
All herbivores Chewers Suckers A ll predators Spiders Total data Pitfall Suction Total data Pitfall Suction Total data Pitfall Suction Total data Pitfall Suction Total data Pitfall Suction No. Samples 9 6 4 8 4 8 9 6 4 8 4 8 9 6 4 8 4 8 9 6 4 8 4 8 9 6 4 8 4 8 No. Specimens 39474 7628 31846 7102 4450 2652 32371 3177 29194 50400 40223 10177 40056 33755 6301
No. Specimens/ Sample
411,19 158,92 663,46 73,98 92,71 55,25 337,20 66,19 608,21 525,00 837,98 212,02 417,25 703,23 131,27
Observed richness (Sobs.)
1 1 8 8 7 9 3 5 9 5 3 3 8 5 9 3 3 5 5 1 1 6 9 5 8 0 4 9 3 4 3 5 No. Singletons 2 2 1 8 2 2 1 0 9 9 1 2 8 1 3 2 2 1 6 1 7 1 3 8 9 Inventory Completeness 0,81 0,79 0,76 0,83 0,83 0,76 0,80 0,76 0,76 0,81 0,83 0,79 0,73 0,76 0,74 No. Doubletons 1 0 5 6 4 4 3 6 1 3 1 2 7 1 1 8 4 6 Sampling intensity 334,53 87,68 342,43 120,37 83,96 69,79 548,66 96,27 530,80 434,48 423,40 127,21 817,47 992,79 180,03 Richness estimates Chao 1 139,09 112,75 126,22 68,2 60,38 47,28 68,55 48 74,91 133,83 110,13 91,39 57,75 39,76 40,23 Jackknife 1 146,7 110,5 120,42 71,86 63,77 49,75 74,83 44,75 70,67 143,71 115,56 99,58 64,83 43,79 45,77 Bootstrap 130,88 97,33 104,97 64,65 58,12 43,13 66,23 37,84 61,85 128,45 104,74 89,37 56,01 38,24 39,84 Michaelis-Menten means 118,07 93,36 97,56 60,7 58,51 40,07 58,29 33,87 56,96 113,68 97,16 80,5 44,88 32,33 33,71 % Completeness Chao 1 0,85 0,77 0,74 0,87 0,88 0,80 0,86 0,69 0,73 0,87 0,86 0,88 0,85 0,86 0,87 Jackknife 1 0,80 0,79 0,77 0,82 0,83 0,76 0,79 0,74 0,78 0,81 0,82 0,80 0,76 0,78 0,76 Bootstrap 0,90 0,89 0,89 0,91 0,91 0,88 0,89 0,87 0,89 0,90 0,91 0,90 0,87 0,89 0,88 Michaelis-Menten means 1,00 0,93 0,95 0,97 0,91 0,95 1,01 0,97 0,97 1,02 0,98 0,99 1,09 1,05 1,04 Mean % Completeness 0,89 0,85 0,84 0,89 0,88 0,85 0,89 0,82 0,84 0,90 0,89 0,89 0,89 0,89 0,89 Ta b le 1.— Summar y tab le of herbi v
ores (all species), che
w
ers, suck
ers, predators (all species) and spider species richness esti
mates for total, pitf
all and suction sampling
data. In bold the results of three indices of sampling ef
fi cienc y (see te xt for fur ther e xplanations). Ta b
le 1.— Número de muestras, indi
viduos y especies obser
v
adas y estimadas se
gún los distintos estimadores utilizados, desglosa
ndo los v
alores para cada tipo de técnica
de colecta (técnica de succión y trampas de caída) y el tipo de alimentación de las especies: todas las especies de herbív
oros,
especies masticadoras, chupadoras,
predado-ras (todas las especies) y arañas. En ne
g
rita se indican los resultados de los tres índices utilizados para comprobar la ef
icie
ncia de muestreo (v
er te
xto para una e
xplicación
Coddington, 1995). Based on that index, it was confirmed for all 15 matrices that the species accu-mulation curve was derived from a homogeneous (stable) community, that is, the expected curve did not rise more steeply from the origin than the accu-mulation curve, implying that heterogeneity was not greater than could be explained by random sampling error alone (Colwell & Coddington, 1995). Therefore, the use of a parametric estimator (MMMean) is adequate and it is possible to apply the randomization of samples.
To evaluate the performance of pitfall, suction and both methods together we computed the follo-wing indices: i) inventory completeness index that is computed as 1 - percentage of singletons (species represented by only one specimen). This index should be near 1 in completely sampled communi-ties (Toti et al., 2000); ii) sampling intensity was calculated as the ratio of specimens to species (see Sorensen et al., 2002); iii) percentage sampling completeness as the ratio of observed to estimated species richness using the four estimators and the average.
COMMUNITY COMPOSITION
The presence/absence pooled data matrix cove-ring three seasons, in two different years and three sampling methods is used to provide the most accu-rate approximation to the total arthropod commu-nity, from which we can compare the efficacy of individual methods. For contingency table analysis, the G-test was chosen since it is the most reliable means of analysing frequency data (Crawley, 1993). To compare the two sampling methods we
used Sorensen’s index of similarity, Cs, a simple but
reliable measure of the extent by which two sites share species in common (Southwood &
Henderson, 2000): Cs = 2J/(2J+A+B), where J is
the number of species common to the two sampling methods and A and B are the number of species exclusively sampled by suction and pitfall respecti-vely. A Dissimilarity index was obtained
calcula-ting 1 - Cs. Cluster analysis (Ward´s agglomerative
method with Euclidean distance) was performed using the software Community Analysis Programme (CAP, 1999).
SPECIES RICHNESS SURROGACY (PRESENCE/ABSENCE DATA)
For the estimation of the value of pitfall and suc-tion samples as surrogates of community species richness, correlation rather than regression analysis was performed. For instance, where most ground-beetles were caught by one type of sampling
tech-nique, it is not surprising that there was a strong relationship between species richness based on that technique and that based upon the pooled data. Therefore, the potential explanatory surrogate variables (pitfall and suction species richness) are not independent from the potential response varia-ble (pooled species richness), which violates a basic assumption of regression analysis. The value
of r2is used as an indicator of the significance of
the correlation, as this value shows the proportion of variation in one variable explained by the other (Dytham, 1999). For several ecological groups and
taxa, species richness estimates were log10
transfor-med to control heterogeneity of variance (Zar, 1984). When zero values were present, data were
log10 (x+0.5) transformed (see Yamamura, 1999).
Multiple comparisons can inflate Type I error rate, so the Bonferroni correction was used to set the P-value at 0.0028 (= 0.05/ 18). A correlation (Pearson r) analysis was also performed between pitfall and
suction species richness estimates using log10 or
log10(x+0.5) transformation of data.
Results
SAMPLING EFFICIENCY, RICHNESS ESTIMATORS AND ACCUMULATION CURVES
A total of 47851 arthropod specimens were collected in pitfall samples (7628 herbivores and 40223 predators) belonging to 182 species, where-as 42023 arthropod specimens were collected in suction samples (31846 herbivores and 10177 pre-dators) belonging to 173 species. Total sampling intensity, the ratio of specimens to species, was similar in both methods (pitfall = 262.92; suction = 242.91), but higher for predators than herbivores in pitfall and herbivores than predators in suction (see Table 1). The overall inventory completeness index (the percentage of species that is not singletons) was 0.81 for pitfall and 0.77 for suction, but the values slightly vary between investigated ecological groups in both methods (see Table 1): in predatory groups, inventory completeness is always slightly higher in pitfall than suction or both methods taken together, whereas in herbivores groups total data gets better results than each individual sampling method.
In terms of percentage completeness, in gene-ral this index was high with the Bootstrap and Michaelis-Menten means and reached lowest values with the Jackknife 1 or Chao 1 estimators (Table 1). Using the mean value of percentage completeness, in all three herbivore guilds both
0 20 40 60 80 100 120 1 3 5 7 9 11 13 15 17 19 21 23 25 27 29 31 33 35 37 39 41 43 45 47
Cumulative number of samples
Cumulative species richness
a) Herbivores 0 20 40 60 80 100 120 140 1 3 5 7 9 11 13 15 17 19 21 23 25 27 29 31 33 35 37 39 41 43 45 47
Cumulative number of samples
C u m u la tiv e s p e c ie s ric h n e s s b) Predators 0 10 20 30 40 50 60 70 1 3 5 7 9 11 13 15 17 19 21 23 25 27 29 31 33 35 37 39 41 43 45 47
Cumulative number of samples
Cumulative species richness
c) Chewers 0 5 10 15 20 25 30 35 40 45 50 1 3 5 7 9 11 13 15 17 19 21 23 25 27 29 31 33 35 37 39 41 43 45 47
Cumulative number of samples
C u m u la tiv e s p e c ie s ric h n e s s d) Spiders
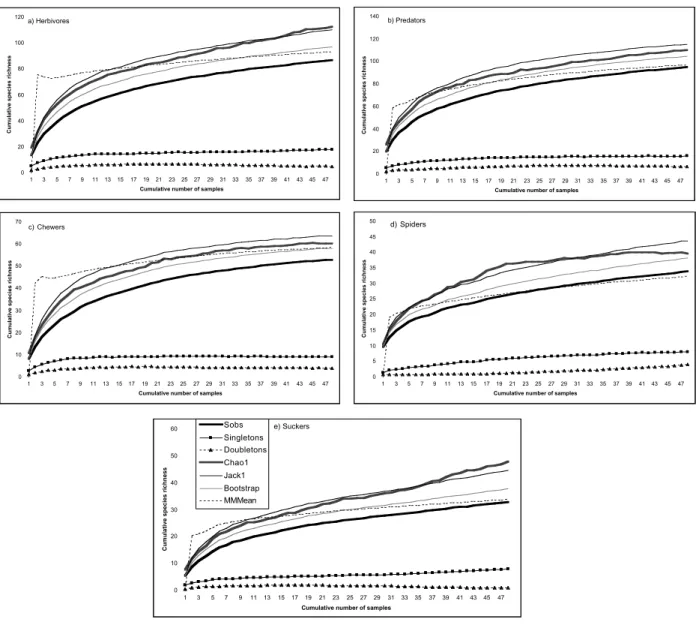
Fig. 1.— Plots comparing the estimated species richness with the observed species accumulation curve (Sobs), using data from 48 pitfall pasture samples (12 sites x 4 sampling periods) of herbivores insects (a), predatory arthropods (b); chewing insects (c), spiders (Araneae) (d) and sucking insects (e). The estimators used are Chao 1, Jackknife 1 (Jack 1), Bootstrap and Michaelis-Menten Mean (MMMean) and were generated by EstimateS, version 6.0b1 (Colwell, 2000). The two curves at the bottom of the graph plot mean numbers of singletons and doubletons as a function of cumulative number of samples. For all curves, each point is the mean of 100 values based on 100 randomizations of sample accumulation order.
Fig. 1.— Comparación del número de especies estimadas según las curvas de acumulación o colecta (Sobs), usando los datos de 48 muestras de trampas de caída ubicadas en pastizales (12 sitios x 4 períodos de muestreo) y los datos de insectos herbívoros (a), artrópodos predadores (b), insectos masticadores (c), arañas (Araneae) (d) e insectos chupadores (e). Los estimadores usados son Chao 1, Jackknife 1 (Jack 1), Bootstrap y Michaelis-Menten Mean (MMMean), los cuales fueron generados mediante el progra-ma Estiprogra-mateS, versión 6.0b1 (Colwell, 2000). Las dos curvas de la parte inferior de los gráficos indican el crecimiento acumula-do en el número de especies con un ejemplar (singletons) o con acumula-dos ejemplares (acumula-doubletons) según se incrementa el número de muestras. Para todas las curvas, cada punto es la media de 100 valores obtenidos mediante 100 aleatorizaciones del orden de entra-da de las muestras. 0 10 20 30 40 50 60 1 3 5 7 9 11 13 15 17 19 21 23 25 27 29 31 33 35 37 39 41 43 45 47
Cumulative number of samples
Cumulative species richness
Sobs Singletons Doubletons Chao1 Jack1 Bootstrap MMMean e) Suckers
0 20 40 60 80 100 120 140 1 2 3 4 5 6 7 8 9 10 11 12 13 14 15 16 17 18 19 20 21 22 23 24 25 26 27 28 29 30 31 32 33 34 35 36 37 38 39 40 41 42 43 44 45 46 47 48 Cumulative number of samples
Cumulative species richness
a) Herbivores 0 20 40 60 80 100 120 1 2 3 4 5 6 7 8 9 10 11 12 13 14 15 16 17 18 19 20 21 22 23 24 25 26 27 28 29 30 31 32 33 34 35 36 37 38 39 40 41 42 43 44 45 46 47 48 Cumulative number of samples
C
um
u
lative species richness
b) Predators 0 10 20 30 40 50 60 1 2 3 4 5 6 7 8 9 10 11 12 13 14 15 16 17 18 19 20 21 22 23 24 25 26 27 28 29 30 31 32 33 34 35 36 37 38 39 40 41 42 43 44 45 46 47 48 Cumulative number of samples
Cumulative species richness
c) Chewers 0 5 10 15 20 25 30 35 40 45 50 1 2 3 4 5 6 7 8 9 10 11 12 13 14 15 16 17 18 19 20 21 22 23 24 25 26 27 28 29 30 31 32 33 34 35 36 37 38 39 40 41 42 43 44 45 46 47 48 Cumulative sample number
C
um
ulative species rich
ness d) Spiders 0 10 20 30 40 50 60 70 80 1 2 3 4 5 6 7 8 9 10 11 12 13 14 15 16 17 18 19 20 21 22 23 24 25 26 27 28 29 30 31 32 33 34 35 36 37 38 39 40 41 42 43 44 45 46 47 48 Cumulative number of samples
Cumulative species richness
Sobs Singletons Doubletons Chao1 Jack1 Bootstrap MMMean e) Suckers
Fig. 2.— Plots comparing the estimated species richness with the observed species accumulation curve (Sobs), using data from 48 suction pasture samples (12 sites x 4 sampling periods) of herbivores insects (a), predatory arthropods (b); chewing insects (c), and spiders (Araneae) (d) sucking insects (e). The estimators used are Chao 1, Jackknife 1 (Jack 1), Bootstrap and Michaelis-Menten Mean (MMMean) and were generated by EstimateS, version 6.0b1 (Colwell, 2000). The two curves at the bottom of the graph plot mean numbers of singletons and doubletons as a function of cumulative number of samples. For all curves, each point is the mean of 100 values based on 100 randomizations of sample accumulation order.
Fig. 2.— Comparación del número de especies estimadas según las curvas de acumulación o colecta (Sobs), usando los datos de 48 muestras de técnicas de succión ubicadas en pastizales (12 sitios x 4 períodos de muestreo) y los datos de insectos herbívoros (a), artrópodos predadores (b), insectos masticadores (c), arañas (Araneae) (d) e insectos chupadores (e). Los estimadores usados son Chao 1, Jackknife 1 (Jack 1), Bootstrap y Michaelis-Menten Mean (MMMean), los cuales fueron generados mediante el pro-grama EstimateS, versión 6.0b1 (Colwell, 2000). Las dos curvas de la parte inferior de los gráficos indican el crecimiento acu-mulado en el número de especies con un ejemplar (singletons) o con dos ejemplares (doubletons) según se incrementa el número de muestras. Para todas las curvas, cada punto es la media de 100 valores obtenidos mediante 100 aleatorizaciones del orden de entrada de las muestras.
0 20 40 60 80 100 120 140 160 1 3 5 7 9 11 13 15 17 19 21 23 25 27 29 31 33 35 37 39 41 43 45 47 49 51 53 55 57 59 61 63 65 67 69 71 73 75 77 79 81 83 85 87 89 91 93 95 Cumulative number of samples
Cumulative species richness
a) Herbivores 0 20 40 60 80 100 120 140 160 1 3 5 7 9 11 13 15 17 19 21 23 25 27 29 31 33 35 37 39 41 43 45 47 49 51 53 55 57 59 61 63 65 67 69 71 73 75 77 79 81 83 85 87 89 91 93 95 Cumulative number of samples
Cum
ulative species richness
b) Predators 0 10 20 30 40 50 60 70 80 1 3 5 7 9 11 13 15 17 19 21 23 25 27 29 31 33 35 37 39 41 43 45 47 49 51 53 55 57 59 61 63 65 67 69 71 73 75 77 79 81 83 85 87 89 91 93 95 Cumulative number of samples
Cumulative species richness
c) Chewers 0 10 20 30 40 50 60 70 1 3 5 7 9 11 13 15 17 19 21 23 25 27 29 31 33 35 37 39 41 43 45 47 49 51 53 55 57 59 61 63 65 67 69 71 73 75 77 79 81 83 85 87 89 91 93 95 Cumulative number of samples
C
um
ulative species richness
d) Spiders
Fig. 3.— Plots comparing the estimated species richness with the observed species accumulation curve (Sobs), using data from 48 pitfall and 48 suction pasture samples (2 sampling methods x 12 sites x 4 sampling periods) of herbivores insects (a), preda-tory arthropods (b); chewing insects (c), spiders (Araneae) (d) and sucking insects (e). The estimators used are Chao 1, Jackknife 1 (Jack 1), Bootstrap and Michaelis-Menten Mean (MMMean) and were generated by EstimateS, version 6.0b1 (Colwell, 2000). The two curves at the bottom of the graph plot mean numbers of singletons and doubletons as a function of cumulative number of samples. For all curves, each point is the mean of 100 values based on 100 randomizations of sample accumulation order. Fig. 3.— Comparación del número de especies estimadas según las curvas de acumulación o colecta (Sobs), usando los datos de 48 muestras de trampas de caída y 48 muestras de succión ubicadas en pastizales (2 métodos x 12 sitios x 4 períodos de mues-treo) y los datos de insectos herbívoros (a), artrópodos predadores (b), insectos masticadores (c), arañas (Araneae) (d) e insectos chupadores (e). Los estimadores usados son Chao 1, Jackknife 1 (Jack 1), Bootstrap y Michaelis-Menten Mean (MMMean), los cuales fueron generados mediante el programa EstimateS, versión 6.0b1 (Colwell, 2000). Las dos curvas de la parte inferior de los gráficos indican el crecimiento acumulado en el número de especies con un ejemplar (singletons) o con dos ejemplares (dou-bletons) según se incrementa el número de muestras. Para todas las curvas, cada punto es la media de 100 valores obtenidos mediante 100 aleatorizaciones del orden de entrada de las muestras.
0 10 20 30 40 50 60 70 80 1 3 5 7 9 11 13 15 17 19 21 23 25 27 29 31 33 35 37 39 41 43 45 47 49 51 53 55 57 59 61 63 65 67 69 71 73 75 77 79 81 83 85 87 89 91 93 95 Cumulative number of samples
Cumulative species richness
Sobs Singletons Doubletons Chao1 Jack1 Bootstrap MMMean e) Suckers
methods taken together improved individual pit-fall or suction performance, but in predatory guilds no obvious difference was obtained betwe-en the three sampling strategies. Chao 1 percbetwe-enta- percenta-ge completeness gave the most contrasted results between sampling strategies for herbivores (all species) and sucking insects, where both suction and pitfall taken together greatly improved sam-pling efficiency in comparison to pitfall or suction alone (see Table 1).
For none of the 15 sample sets (5 guilds x 3 sam-pling strategies) does the randomized species accu-mulation curve reach an asymptote (Figs. 1-3). The species accumulation curve for the four estimators has three different general patterns (Figs. 1-3): i) a non-asymptote pattern for Jackknife 1 and Bootstrap; ii) a general asymptote pattern for Michaelis-Menten means; iii) a more interesting variation in curvature between the five guilds for Chao 1. In fact, for predators (all species), chewing insects and spiders pitfall data (Fig. 1b, c, d) an asymptote was reached by the Chao 1 curve and the singleton and doubleton curves are also converging. For suction data, an asymptote was reached only for predatory guilds with the singleton and doubleton curves converging (Fig. 2b, d). When both methods are taken together only for sucking insects and spi-ders there is an obvious asymptote in Chao 1 curve (Fig. 3d, e).
SPECIES COMPOSITION
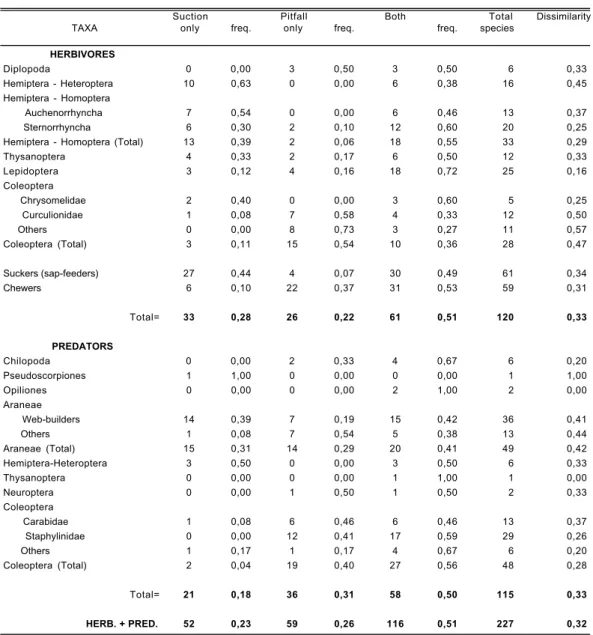
A total of 227 species of arthropods were sam-pled by suction and pitfall trapping in the twelve sites, during the four sampling occasions over two years. One hundred and twenty species were her-bivores (sap-feeders= 61; chewers= 59) and 115 predators. Table 2 shows the number of species of the different taxonomic or ecological groups that were exclusively caught by pitfall trapping or suc-tion sampling or sampled by both methods. As expected both sampling methods contributed uni-que species (Table 2): about 22% of herbivore spe-cies and 31% of predatory arthropod spespe-cies were only sampled by pitfall trapping, whereas by suc-tion sampling proporsuc-tions were 28% and 18% res-pectively; In the Coleoptera, a higher proportion of species was sampled only by pitfall traps than in other taxonomic groups (G = 29.44, d.f. = 1, p < 0.0001); Slightly more species of herbivores were sampled exclusively by suction than by pit-fall traps, while a few more species of predatory arthropods were found only in pitfall traps (G = 4.28, d.f. = 1, p = 0.04); Sucking and chewing her-bivores showed very different patterns, with a
hig-her proportion of the former sampled exclusively by suction, whereas more chewing species were sampled only by pitfall traps (G = 28.02, d.f. = 1, p < 0.0001); Similar patterns were obtained for two guilds of spiders, with more web-building species sampled exclusively by suction, whereas most other species were sampled only by pitfall (G = 7.41, d.f. = 1, p = 0.0091).
Values of the dissimilarity index (Table 2) shows that both methods differ greatly mainly for Hemiptera (Heteroptera), Curculionidae, phytopha-gous Coleoptera in general and spiders.
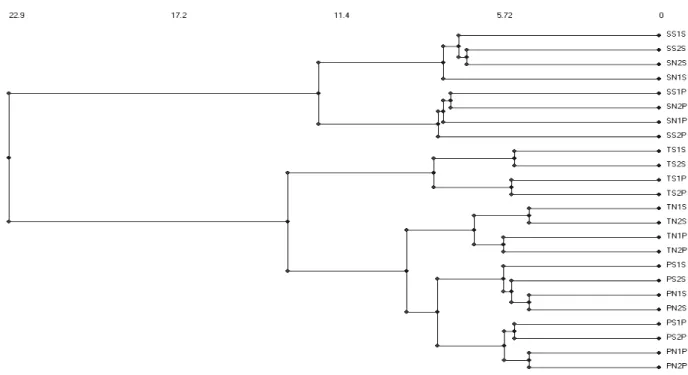
The analysis shown in Figure 4, illustrates that pitfall and suction samples of the same islands or habitats are clustered together. For Santa Maria and Pico, suction and pitfall samples form two separate clusters, thereby showing a difference between the two methods. For Terceira, samples from the two methods were clustered only by habitats (Figure 4). SPECIES RICHNESS SURROGACY (PRESENCE/ABSENCE DATA)
The pooled species richness includes species that were collected only by suction sampling, only by pitfall trapping, by both methods and by direct search. Even after Bonferroni correction, correla-tions between pooled species richness and either suction or pitfall species richness were statistically significant, for several different groups of species (see Table 3). For the herbivores, both suction and pitfall estimates of species richness were well correlated with pooled species richness. However, suction estimates of species richness of sap-fee-ders and pitfall estimates of chewing insects had
higher levels of r2than alternative sampling
met-hod (Table 3). For the predatory groups, only web-building spiders were better sampled by suction (r= 0.80; p = 0.0016). Wandering spiders, ground-beetles and rove-ground-beetles were better sampled by pitfall traps, with high proportions of the variance (90, 94 and 86% respectively) being explained (see Table 3).
There were high correlations between estimates of species richness from pitfall and suction met-hods for total herbivores (r =0.93; p < 0.0001), comprising sap-feeders (r = 0.89; p = 0.0001) and chewers (r = 0.83; p = 0.00089). Total predatory species (r = 0.84; p = 0.00067), wandering spiders (r = 0.61; p = 0.04) and rove-beetles (r = 0.81; p = 0.0014) were also sampled with equal efficacy by both methods. On the other hand, no correlation was obtained for total species of spiders (r = 0.40; p = 0.19), web-building spiders (r = 0.10; p = 0.74) and ground-beetles (r = 0.01; p = 0.85).
Discussion
The interpretation of data obtained by a single technique may introduce bias or even be speculati-ve (Sunderland et al., 1995). Pitfall trapping and suction sampling have a long history of use in eco-logical research (see Southwood, 1978; papers in Toft & Riedel, 1995; Southwood & Henderson,
2000). Indeed, there is already a substantial litera-ture comparing arthropod sampling methods in terms of arthropod abundance in specific sites or habitats and often of species groups of arthropods (e.g. Disney et al., 1982; Schotzko & O´Keeffe, 1989; several papers in Toft & Riedel, 1995; Broatch & Vernon, 1997; Costello & Daane, 1997; Hammond, 1997; Buffington & Redak, 1998;
Suction Pitfall Both Total Dissimilarity
TAXA only freq. only freq. freq. species
HERBIVORES Diplopoda 0 0,00 3 0,50 3 0,50 6 0,33 Hemiptera - Heteroptera 10 0,63 0 0,00 6 0,38 16 0,45 Hemiptera - Homoptera Auchenorrhyncha 7 0,54 0 0,00 6 0,46 13 0,37 Sternorrhyncha 6 0,30 2 0,10 12 0,60 20 0,25
Hemiptera - Homoptera (Total) 13 0,39 2 0,06 18 0,55 33 0,29
Thysanoptera 4 0,33 2 0,17 6 0,50 12 0,33 Lepidoptera 3 0,12 4 0,16 18 0,72 25 0,16 Coleoptera Chrysomelidae 2 0,40 0 0,00 3 0,60 5 0,25 Curculionidae 1 0,08 7 0,58 4 0,33 12 0,50 Others 0 0,00 8 0,73 3 0,27 11 0,57 Coleoptera (Total) 3 0,11 15 0,54 10 0,36 28 0,47 Suckers (sap-feeders) 27 0,44 4 0,07 30 0,49 61 0,34 Chewers 6 0,10 22 0,37 31 0,53 59 0,31 Total= 33 0,28 26 0,22 61 0,51 120 0,33 PREDATORS Chilopoda 0 0,00 2 0,33 4 0,67 6 0,20 Pseudoscorpiones 1 1,00 0 0,00 0 0,00 1 1,00 Opiliones 0 0,00 0 0,00 2 1,00 2 0,00 Araneae Web-builders 14 0,39 7 0,19 15 0,42 36 0,41 Others 1 0,08 7 0,54 5 0,38 13 0,44 Araneae (Total) 15 0,31 14 0,29 20 0,41 49 0,42 Hemiptera-Heteroptera 3 0,50 0 0,00 3 0,50 6 0,33 Thysanoptera 0 0,00 0 0,00 1 1,00 1 0,00 Neuroptera 0 0,00 1 0,50 1 0,50 2 0,33 Coleoptera Carabidae 1 0,08 6 0,46 6 0,46 13 0,37 Staphylinidae 0 0,00 12 0,41 17 0,59 29 0,26 Others 1 0,17 1 0,17 4 0,67 6 0,20 Coleoptera (Total) 2 0,04 19 0,40 27 0,56 48 0,28 Total= 21 0,18 36 0,31 58 0,50 115 0,33 HERB. + PRED. 52 0,23 59 0,26 116 0,51 227 0,32
Table 2.— Number of species of different ecological and taxonomic groups collected exclusively by pitfall, or by suction or by the two sampling methods. A dissimilarity index (1-Sorenson´s Index of similarity) is also presented.
Table 2.— Número de especies de los distintos grupos taxonómicos y ecológicos colectados mediante el uso exclusivo de tram-pas de caída o técnica de succión, y el uso combinado de ambos métodos. Se presentan también los valores de un índice de disi-militud (1-Índice de sidisi-militud de Sorenson).
Boiteau & Osborn, 1999; Churchill & Arthur, 1999; Standen, 2000). The study described here was conducted in the context of estimating species richness and composition in different habitats and islands and to give insight into the importance of using, simultaneously, two methods of sampling arthropods in agroecosystems, to assess herbivo-rous and predatory groups.
METHODOLOGICAL ASPECTS: FIELD WORK AND SAM -PLE SORTING
The study was carried out under logistically dif-ficult circumstances on three different oceanic islands and at high altitude pasture sites where access was commonly difficult. It therefore requi-red less labour-intensive sampling techniques. In this contest, the “Vortis” suction sampler had con-siderable advantages, as it is fully portable, fast to operate and reliable, with few mechanical problems during the two years of operation. Its main
advanta-ges are undoubtedly its light weight and ease of retaining and removing the samples, which enables an operator to take 20 two minutes samples (four 30 seconds subsamples) in about one hour of conti-nuous work. Thus, at least three sites located relati-vely near each other could be sampled daily and at a reasonable level of sampling intensity, assuming that the weather conditions remain constant. The amount of debris collected was highly dependent on the nature of the substrate, but since the pastures had a dense cover of non-flowering perennial gras-ses (mainly Anthoxanthum odoratum, Holcus lana-tus, Agrostis castellana and Poa trivialis), the sam-ples were very clean. Another important advantage of the “Vortis” suction machine is its ability to sam-ple even very small juvenile spiders and immature insects (aphids, thrips, Lepidoptera larvae, etc.) and small adult insects (e.g. male coccids) with great accuracy and without damage. Of course, sorting these samples is more time consuming than sorting Fig. 4.— Cluster analysis of the species composition of arthropods from twelve sites. Each site is represented by four symbols in which the first symbol refers to island (S – S. Maria; T – Terceira; P - Pico), the second symbol to site management type (S – sown pastures; N – semi-natural pastures), the third symbol to replicate number and the last symbol to sampling method (suction (S) and pitfall trapping (P).
Fig. 4.— Análisis de agrupamiento (Cluster Analysis) de los doce sitios de muestreo según su composición faunística de artrópodos. Cada sitio está representado por cuatro símbolos, el primero de los cuales se refiere a la isla (S – S. María; T Terceira; P -Pico), el segundo al tipo del manejo (S - pastizales antrópicos; N - pastizales seminaturales), el tercero representa el número de la réplica y el último se refiere al método de muestreo: técnica de succión (S) y trampa de caída (P).
pitfall samples that are composed mainly of adults of more active species, but gives a more detailed assessment of the arthropod community. If time is a constraint, the subsampling of collected samples is always an option. Although suction sampling is less effective for large, nocturnal, active arthropod spe-cies and possibly some spiders that build webs on the ground, the ability to sample juvenile stages is an attribute of considerable importance especially when samples cannot be taken throughout the sea-son to coincide with adult stages.
In terms of labour, suction samples, even wi-thout debris, are more difficult to sort than pitfall samples, since there were more small specimens. Moreover, suction sampling is very dependent on weather conditions, since it requires dry vegetation and low wind conditions to be effective. This was critical in the hyper-oceanic and wet climate of the Azorean islands, allowing sampling only on some days and in the afternoon when the vegetation was
dried by the sun. Pitfall trapping is less sensitive to the weather, since the set-up and recovery of traps can occur even in bad weather conditions, though at least two site visits are necessary for a single sam-ple. The method is far less effective in sampling juvenile and small arthropods.
SAMPLING EFFICIENCY, RICHNESS ESTIMATORS AND ACCUMULATION CURVES
In spite of the fact that none of the observed spe-cies accumulation curves reached an asymptote other measured indices were useful in evaluating the performance of the investigated sampling me-thods. Looking for the four richness estimators they performed differently, Jackknife 1 and Chao 1 generating large estimates of species richness, Bootstrap giving a lower estimate of species rich-ness and Michaelis-Menten mean (MMMean) cle-arly underestimating species richness. Since the available estimators are probably underestimating
TAXA r r2(%) Significance r r2(%) Significance SUCTION PITFALL Herbivores 0,98 96 *** 0,98 95 *** Suckers 0,98 97 *** 0,90 81 *** Chewers 0,91 82 *** 0,97 94 *** Predators 0,93 86 *** 0,97 95 *** Araneae 0,73 53 ** 0,84 70 *** (all species) Araneae 0,80 64 ** 0,42 17 n.s. (web-builders) p=0.0016 Araneae 0,78 61 ** 0,95 90 *** (others) p=0.0027 Carabidae 0,20 4 n.s. 0,97 94 *** Staphylinidae 0,88 77 *** 0,93 86 ***
Note: Significance levels underlined are significant after a Bonferroni correction (p< 0.0028). n.s. = not significant; *p < 0.05; **p < 0.01; ***p < 0.001.
Table 3.— Coefficient of determination, percentage of variance explained (r2) and significance level of the correlation between log pooled species richness and the suction and pitfall log species richness for a range of taxa. The highest paired correlations are shown with the r2 value in bold.
Table 3.— Valores del coeficiente de determinación o porcentaje de varianza explicado (r2) y nivel de significación estadística de la correlación entre el logaritmo del número total de especies y el número de especies capturado mediante cada uno de los dos métodos de colecta para cada uno de los grupos considerados. Las mayores correlaciones muestran el valor r2en negrita.
true species richness in most studies (Chiarucci et al., 2003), all but Michaelis-Menten mean estima-tor gave probably realistic estimates of species rich-ness. This contrasts with the study of Toti et al. (2000), in which Chao 1 gave unrealistic large esti-mates and MMMean performed better. Interesting is to compare the estimates of each sampling tech-nique used separately (Table 1; Figs 1-3) with the observed species richness pooling data from the two sampling methods (see Table 2): 120 species of herbivores were observed and Chao 1 and Jackknife 1 suction estimates generated the near result, 126.22 and 120.42 species respectively; 61 species of suckers were observed (including also direct search), and Bootstrap suction estimate generated 61.85 species; 59 species of chewers were obser-ved, whereas Chao 1 and Bootstrap pitfall estimates generated the near result, 60.38 and 58.12 respecti-vely; 115 species of predators were observed and Chao 1 and Jackknife 1 pitfall estimates generated the near result, 110.13 and 115.56 species respecti-vely; 49 species of spiders were observed and Jackknife 1 suction and Jackknife 1 pitfall estima-tes generated the near result, 45.77 and 43.79 spe-cies respectively. These patterns clearly show that Chao 1 and First Order Jackknife (= Jackknife 1) were the most reliable estimators with the current datasets, whereas, suction sampling was more effective for herbivores (all species), sucking insects and spiders, and pitfall trapping was more effective for chewing insects, predators and spiders. Therefore, sampling spiders with pitfall or suction was equally effective in terms of estimating true species richness. However, as showed by the Dissimilarity Index (Table 2) pitfall and suction are sampling a different set of the spider community (see also below).
The number of singleton species is usually the key factor in most the above-mentioned indices. If a sampling protocol was efficient than the curve of the singletons should level or decrease with increa-sing collecting effort (Toti et al., 2000). This was the case of pitfall trapping with predatory guilds and chewing insects, suction sampling with preda-tory guilds and joint sampling methods for all but chewing insects. Therefore, me may conclude that the use of both sampling methods was useful with a general high sampling efficiency, in average more than 85%. Together with a similar performance of the species accumulation curves for most of the investigated ecological groups, demonstrates that both sampling methods (pitfall and suction) yielded a high percentage of the present species in the pas-tures of the three studied islands.
Looking for the ecological and taxonomic sta-tus of singletons in our data sets, for instance in spiders for which we have a good knowledge of species composition in other Azorean habitats (Borges et al., unpublished data), most of the sin-gletons are species particularly common in other habitats (e.g. native forest both in soil and canopy). Therefore, most our spider singletons are probably tourists in managed pastures and consequently we may have reached a near perfect sampling comple-teness for spiders.
For the several studied arthropod groups pitfall was as good as suction sampling in terms of sam-pling efficiency as measured by the inventory com-pleteness and the percentage comcom-pleteness indices. In terms of species accumulation, pitfall performed even better than suction for chewing insects (see Figs. 1c and 2c) and as well as suction for spiders (see Figs 1d and 2d). Interestingly, when both met-hods were jointed in the analysis, percentage com-pleteness only slightly improved for phytophagous guilds. In terms of sampling intensity (number of specimens per species) pitfall performed better for predacious groups, whereas suction was better for all herbivores and sucking insects (Table 1). Jointed methods yielded a higher sampling intensity parti-cularly for chewing insects.
COMMUNITY COMPOSITION AND SPECIES RICHNESS SURROGACY
In terms of community composition, suction sampling was more effective for sucking insects, whereas pitfall trapping was preferable for chewing herbivores. Indeed, a higher proportion of sucking insects was sampled exclusively by suction sam-pling, whereas more chewing species were sampled only by pitfall trapping. For spiders, more web-building species were only sampled by suction sam-pling, whereas most of other species were sampled only by pitfall trapping. Moreover, our results indi-cate that species richness of some groups, e.g. her-bivorous arthropods (all species), insect sap-feeders and web-building spiders is better explained by the suction data set, whereas pitfall data were more informative for predatory arthropods (all species), chewing insects, wandering-spiders, carabids and staphylinids. Thus, neither Vortis suction sampling, nor pitfall trapping described perfectly the species composition and richness of pasture arthropods. Indeed, a few species were only collected by direct searching. However, the cluster analysis (Fig. 4) shows greater similarity in species composition between the two sampling methods than between sites (particularly in Terceira) and, thus, if time was
a major constraint it would be possible to use a sin-gle method to give a fair reflection of the commu-nity.
Topping & Sunderland (1992) reported a failure of pitfall traps to reflect the community composi-tion of spiders adequately. However, our results are not in total agreement since: i) pitfall trapping was complementary to suction sampling in describing species composition of arthropods (see also Standen, 2000); ii) species richness estimated from pitfall traps was correlated with pooled species richness for several ecological and taxonomic arth-ropod groups.
Another interesting subject is related with the species richness ratio of herbivores to predators (124:115). We should expect a much higher number of phytophagous species related to predators than obtained and the explanation for this result is explained not by an inefficacy of sampling but by insular disharmony and geological age of the islands (see Borges & Brown, 1999).
Since each method has its advantages and disad-vantages, we are in agreement with Standen (2000) in that pitfall trapping and suction sampling (Vortis) should optimally be considered as two complementary sampling methods in describing the biodiversity of pastures, and not as exclusive met-hods. In fact, a suction device in grassland will not, by itself, give absolute estimates of density, becau-se careful ground becau-search after suction sampling usually results in more species being added (Buffington & Redak, 1998). However, suction samples were such good estimates of the density of arthropod species that it has been possible to make good predictions between the attributes of the pas-ture vegetation strucpas-ture and herbivorous insects and spider densities (see Borges & Brown, 2001).
Our results have shown that pitfall trapping can be used in community ecology studies with some fidelity, and when used together with an absolute density sampling technique (e.g. suction sam-pling), the final result can be highly accurate. It seems that, unless we are only interested in absolu-te density estimaabsolu-tes, for which suction will be a more reliable method, pitfall trapping may be a more practical and inexpensive method of descri-bing species composition.
The present and growing demands for habitat characterization highlights the need for the critical awareness of the strengths and weaknesses of the various sampling techniques most likely to be used by land managers, farmers, advisory services and conservation bodies. Grasslands are currently a par-ticular focus at attention because of the large areas
under intensive management, the need to assess the impact of such management on biodiversity and the success of measures being undertaken to ameliora-te the effects or actively restore biodiversity. The results given in this paper may therefore be of value in the assessment of agri-environment schemes being implemented in various parts of the globe.
Conclusions
This study allows us to conclude that both suc-tion sampling and pitfall trapping techniques were reliable in terms of sampling efficiency getting a good estimate of arthropod species richness in sown and semi-natural pastures of the three Azorean islands. Using the two methods together we reached values of almost 90% completeness in some guilds, which is very good when compared with other studies (Toti et al., 2000; Sorensen et al., 2002). Pitfall and suction alone were reliable in estimating species richness of predatory arthropods (all species) and spiders. Joint data is needed for getting reliable estimates for herbivores guilds. We also found that both suction sampling and pitfall trapping techniques were inadequate by themselves for a detailed description of community composi-tion, and species richness surrogacy of most of the diurnal active grassland arthropods. “Vortis” suc-tion sampling is a reliable method for estimating these parameters for most sap-feeding insects and web-building spiders. Pitfall trapping has some advantages for larger, nocturnal and active arthro-pods, most chewing insects, wandering spiders, ground-beetles and rove-beetles. Thus, suction and pitfall methods should be considered complemen-tary techniques for sampling grassland epigeic ar-thropod species and for an accurate estimate of total arthropod community structure. If only an assess-ment of community composition as an indication of grassland sward quality is needed, both techniques may be useful on their own. It is therefore impor-tant to tailor the choice of technique to address the requirements of the study.
ACKNOWLEDGEMENTS
The authors wish to thank F. Pereira, Paulo Barcelos and Genage André for assistance in the field. We also thank Prof. H. Enghoff (Zoologisk Museum, University of Copenhagen, Denmark), Prof. F. Ilharco (“Estação Agronómica Nacional”, Portugal); Prof. R. zur Strassen (“Forschungsinstitut und Naturmuseum Senckenberg”, Frankfurt, Germany), V. Vieira (“Dept. Biologia da Universidade dos Açores”, Portugal), Dr.
R. Booth, (The Natural History Museum, London, U.K), Dr. A. Serrano (“Faculdade de Ciências de Lisboa”, Portugal), J. Hollier, J. Ribes and J. Wunderlich for confirmation of mor-phospecies identification.
This research was generously supported by FCT (“Fundação da Ciência e Tecnologia”, Lisboa, Portugal). Special thanks are also due to the “Secretaria Regional da Agricultura e Pescas (Açores)” who provided financial support for all field and laboratory work in the Azores.
References
ADIS, J., 1979. Problems of interpreting arthropod
sam-pling with pitfall traps. Zoologischer Anzeiger, 202: 177-184.
ARNOLD, A. J. 1994. Insect suction sampling without nets, bags or filters. Crop Protection, 13: 73-76. ARNOLD, A. J., NEEDHAM, P. H. & STEVENSON, J. H.,
1973. A self portable insect suction sampler and its use to assess the effects of azinphos methyl and endosulfan on blossom beetle populations on oil seed rape. Annals of Applied Biology, 75: 229-233.
AUSDEN, M., 1996. Invertebrates. In: W. J. Sutherland (ed.). Ecological Census Techniques - A Handbook. Cambridge University Press. Great Britain: 139-204.
BAARS, M. A., 1979. Catches in pitfall traps in relation
to mean densities of Carabid beetles. Oecologia, 41: 25-46.
BOITEAU, G. & OSBORN, W. P. L., 1999. Comparison of plastic-lined trenches and extruded plastic traps for controlling Leptinoptarsa decemlineata (Coleoptera: Chrysomelidae). The Canadian Entomologist, 131: 565-572.
BORGES, P. A. V., 1992. The relative efficiency of forma-lin, vinegar and turquin in pitfall traps on an Azorean pine woodland area. Suplemento n.° 3 do Boletim da Sociedade Portuguesa de Entomologia, 1: 213-223. BORGES, P. A. V., 1997. Pasture arthropod community
structure in Azorean islands of different geological age. Ph. D. Thesis. Imperial College, University of London. 245 pp.
BORGES, P. A. V., 1999. Plant and arthropod species com-position of sown and semi-natural pasture communi-ties of three Azorean islands (S. Maria, Terceira and Pico). Arquipélago, 17A: 1-21.
BORGES, P. A. V. & BROWN, V. K., 1999. Effect of island geological age on the arthropod species richness of Azorean pastures. Biological Journal of the Linnean Society, 66: 373-410.
BORGES, P. A. V. & BROWN, V. K., 2001. Phytophagous insects and web-building spiders in relation to pastu-re vegetation complexity. Ecography, 24: 68-82. BROATCH, J. S. & VERNON, R. S., 1997. Comparison of
water pan traps and sticky traps for monitoring Delia
spp. (Diptera: Anthomyiidae) in Canola. The Canadian Entomologist, 129: 979-984.
BROWN, V. K., GANGE, A. C., EVANS, I. M. & STORR, A.
L., 1987. The effect of insect herbivory on the growth and reproduction of two annual Vicia species at dif-ferent stages in plant succession. Journal of Ecology, 75: 1173-1189.
BUFFINGTON, M. L. & REDAK, R. A., 1998. A comparison of vacuum sampling versus sweep-netting for arthro-pod biodiversity measurements in California coastal sage scrub. Journal of Insect Conservation, 2: 99-106. CAP, 1999. Community analyis package (CAP) - a pro-gram to search for structure in ecological community data, Version 1.1. Pisces Conservation Ltd. 26 pp. CHIARUCCI, A., ENRIGHT, N. J., PERRY, G. L. W., MILLER, B.
P. & LAMONT, B., 2003. Performance of nonparametric
species richness estimators in a high diversity plant community. Diversity and Distributions, 9: 283-295. CHURCHILL, T. B. & ARTHUR, J. M., 1999. Measuring
spi-der richness: effects of different sampling methods and spatial and temporal scales. Journal of Insect Conservation, 3: 287-295.
COLWELL, R. K., 2000. EstimateS: statistical estimation of
species richness and shared species from samples. Version 6.0b1. User´s guide and application. University of Connecticut, Storrs, Connecticut, U.S.A. (Online, URL: http://viceroy.eeb.uconn.edu/estimates).
COLWELL, R. K & CODDINGTON, J. A., 1995. Estimating terrestrial biodiversity through extrapolation. In: D. L. Hawksworth (ed.). Biodiversity, Measurement and estimation. Chapman & Hall. London: 101-118. COSTELLO, M. J. & DAANE, K. M., 1997. Comparison of
sampling methods used to estimate spider (Araneae) species abundance and composition in grape vine-yards. Environmental Entomology, 26: 142-149. CRAWLEY, M. J., 1993. GLIM for Ecologists. Blackwell
Scientific Publications. London. 379 pp.
DIETRICK, E. J., 1961. An improved backpack motor fan for suction sampling of insect populations. Journal of Economic Entomology, 54: 394-395.
DINTER, A., 1995. Estimation of epigeic spider popula-tion densities using an intensive D-vac sampling technique and comparison with pitfall trap catches in winter wheat. In: S. Toft & W. Riedel (eds.). Arthropod natural enemies in arable land. I density, spatial heterogeneity and dispersal. Acta Jutlandica LXX: 2, Aarhus University Press. Aarhus: 23-32. DISNEY, R. H. L., ERZINCLIOGLU, Y. Z., HENSHAW, D. J. DE
C., HOWSE, D., UNWIN, D. M., WITHERS, P. & WOODS,
A., 1982. Collecting methods and the adequacy of attempted fauna surveys, with reference to the Diptera. Fields Studies, 5: 607-621.
DOWNIE, I. S., BUTTERFIELD, J. E. L. & COULSON, J. C., 1995. Habitat preferences of sub-montane spiders in northern England. Ecography, 18: 51-61.
DYTHAM, C., 1999. Choosing and Using Statistics – A
Biologist´s Guide. Blackwell Science. London. 218 pp.
EVANS, I. M., 1988. Leguminous herbs and their insect
herbivores: interaction during early secondary suc-cession. Ph. D. Thesis. Imperial College, University of London. 239 pp.
GALTON, R. E., 1993. An investigation into invertebrate
diversity variation between management regimes on Lullington Heath National Nature Reserve. MSc. Thesis. University of London. 86 pp.
GANGE, A. C., BROWN, V. K., EVANS, I. M. & STORR, A.
L., 1989. Variation in the impact of insect herbivory on Trifolium pratense through early plant succession. Journal of Ecology, 77: 537-551.
GIBSON, C. W. D., HAMBLER, C. & BROWN, V. K., 1992. Changes in spider (Araneae) assemblages in relation to succession and grazing management. Journal of Applied Ecology, 29: 133-142.
GONZÁLEZ, D., RAMSEY, D. A., LEIGH, T. E., EKBOM, B. S.
& BOSCH, R. VAN DEN, 1977. A comparison of
vacuum and whole-plant methods for sampling pre-daceous arthropods on cotton. Environmental Entomology, 6: 750-760.
GOOD, J. A. & GILLER, P. S., 1990. Staphylinid beetles
(Coleoptera) from cereal and grass fields in south-west Ireland. Bulletin of the Irish Biogeographical Society, 13: 2-22.
GOOD, J. A. & GILLER, P. S., 1991. The effect of cereal
and grass management on staphylinid (Coleoptera) assemblages in South-West Ireland. Journal of Applied Ecology, 28: 810-826.
HALL, D. W., 1991. The environmental hazard of
ethyle-ne glycol in insect pit-fall traps. The Coleopterists Bulletin, 45: 193-194.
HALSALL, N. B. & WRATTEN, S. D., 1988. The efficiency of pitfall trapping for polyphagous predatory Carabidae. Ecological Entomology, 13: 293-299. HAMMOND, H. E. J., 1997. Arthropod biodiversity from
Populus coarse woody material in North-Central Alberta: a review of taxa and collection methods. The Canadian Entomologist, 129: 1009-1033.
HAND, S. C., 1986. The capture efficiency of the Dietrich
vacuum insect net for Aphids on grasses and cereals. Annals of Applied Biology, 108: 233-241.
HARCOURT, D. G., BINNS, M. R. & GUPPY, J. C., 1983. Sample size determination for Hypera postica (Coleoptera: Curculionidae) adults: a comparison of two methods. Environmental Entomology, 12: 1623-1627.
HAWTHORNE, A., 1995. Validation of the use of pitfall traps to study carabid populations in cereal field headlands. In: S. Toft & W. Riedel (eds.). Arthropod natural enemies in arable land. I density, spatial heterogeneity and dispersal. Acta Jutlandica LXX: 2, Aarhus University Press. Aarhus: 61-75.
HENDERSON, I. E. F. & WHITAKER, T. M., 1977. The effi-ciency of an insect suction sampler in grassland. Ecological Entomology, 2: 57-60.
JAROSÍK, V., 1992. Pitfall trapping and species-abundan-ce relationships: a value for carabid beetles (Coleoptera, Carabidae). Acta Entomologica Bohemoslovaka, 88: 273-279.
LUFF, M. L., 1968. Some effects of formalin on the
num-bers of Coleoptera caugh in pitfall traps. The Entomologist´s Monthly Magazine, 104: 115-116. MACLEOD, A., SOTHERTON, N. W., HARWOOD, R. W. J. &
WRATTEN, S. D., 1995. An improved suction
sam-pling device to collect aphids an their predators in agroecosystems In: S. Toft & W. Riedel (eds.). Arthropod natural enemies in arable land. I den-sity, spatial heterogeneity and dispersal. Acta Jutlandica LXX: 2, Aarhus University Press. Aarhus: 125-131.
MACLEOD, A., WRATTEN, S. D. & HARWOOD, J., 1994. The efficiency of a new lightweight suction sampler for sampling aphids and their predators in arable land. Annals of Applied Biology, 124: 11-17. MELBOURNE, B. A., 1999. Bias in the effect of habitat
structure on pitfall traps: an experimental evaluation. Australian Journal of Ecology, 24, 228-239.
MELBOURNE, B. A., GULLAN, P. J. & SU, Y .N., 1997. Interpreting data from pitfall-trap surveys: crickets and slugs in exotic and native grassland of the Australian capital territory. Memoirs of the Museum of Victoria, 56: 361-367.
MORRIS, M. G., 1973. The effects of seasonal grazing on the Heteroptera and Auchenorhyncha (Hemiptera) of chalk grassland. Journal of Applied Ecology, 10: 761-780.
MORRIS, M. G., 1990a. The Hemiptera of two sown cal-careous grasslands. I. Colonization and early succes-sion. Journal of Applied Ecology, 27: 367-378. MORRIS, M. G., 1990b. The Hemiptera of two sown
cal-careous grasslands. II. Differences between treat-ments. Journal of Applied Ecology, 27: 379-393. MORRIS, M. G., 1990c. The Hemiptera of two sown
cal-careous grasslands. III. Comparisons with the Auchenorhyncha faunas of other grasslands. Journal of Applied Ecology, 27: 394-409.
NAGEL, H. G., 1979. Analysis of invertebrate diversity in
a mixed prairie ecosystem. Journal of the Kansas Entomological Society, 52: 777-786.
OLIVER, I. & BEATTIE, A. J., 1996. Invertebrate morp-hospecies as surrogates for species: a case study. Conservation Biology, 10: 99-109.
POWELL, W., WALTON, M. P. & JERVIS, M. A., 1996. Populations and communities. In: M. Jervis & N. Kidd (eds.). Insect Natural Enemies - Practical approaches to their study and evaluation. Chapman & Hall. London: 223-292.
PRUESS, K. P. & WHITMORE, R. W., 1976. A D-Vac Calibration Technique. Journal of Economic Entomology, 69: 51-52.
SCHOTZKO, D. J. & O´KEEFFE, I. E., 1989. Comparison of Sweep Net, D-vac, and absolute sampling, and diel variation of sweep net sampling estimates in lentils for pea aphid (Homoptera: Aphididae), nabids (Hemiptera: Nabidae), lady beetles (Coleoptera: Coccinellidae), and lacewings (Neuroptera: Chrysopidae). Journal of Economic Entomology, 82: 491-506.
SIMONET, D. E., PIENKOWSKI, R. L., MARTÍNEZ, D. G. &
BLAKESLEE, R. D., 1979. Evaluation of sampling
techniques and development of a sampling program for potato leafhopper adults on alfafa. Environmental Entomology, 8: 397-399.
SMITH, J. W., STADELBACHER, E. A. & GANTT, C. W.,
1976. A comparison of techniques for sampling beneficial arthropod populations associated with cot-ton. Environmental Entomology, 5: 435-444. SORENSEN, L. L., CODDINGTON, J. A. & SCHARFF, N.,
2002. Inventorying and estimating subcanopy spider diversity using semiquantitative sampling methods in an afromontane forest. Environmental Entomology, 31: 319-330.
SOUTHWOOD, T. R. E., 1978. Ecological Methods. 2nd edn. Chapman & Hall. London. 524 pp.
SOUTHWOOD, T. R. E., BROWN, V. K. & READER, P. M., 1979. The relationships of plant and insect diversi-ties in succession. Biological Journal of the Linnean Society, 12: 205-216.
SOUTHWOOD, T. R. E. & HENDERSON, P. A., 2000. Ecological Methods. 3rd edn. Blackwell Science. London. 575 pp.
STANDEN, V., 2000. The adequacy of collecting techniques for estimating species richness of grassland inverte-brates. Journal of Applied Ecology, 37: 884-893. STEWART, A. J. A. & WRIGHT, A. F., 1995. A new
inex-pensive suction apparatus for sampling arthropods in grassland. Ecological Entomology, 20: 98-102. SUMMERS, C. G., GARRETT, R. E. & ZALOM, F. G., 1984.
New suction device for sampling arthropod popula-tions. Journal of Economic Entomology, 77: 817-823.
SUNDERLAND, K. D., DESNOO, G. R., DINTER, A., HANCE,
T., HELENIUS, J., JEPSON, P., KROMP, B., LYS, J.-A.,
SAMU, F., SOTHERTON, N. W., TOFT, S. & ULBER, B.,
1995. Density estimation for invertebrate predators in agroecosytems. In: S. Toft & W. Riedel (eds.). Arthropod natural enemies in arable land. I density, spatial heterogeneity and dispersal. Acta Jutlandica LXX: 2, Aarhus University Press. Aarhus: 133-162. SUNDERLAND, K. D. & TOPPING, C. J., 1995. Estimating
population densities of spiders in cereals. In: S. Toft & W. Riedel (eds.). Arthropod natural enemies in arable land. I density, spatial heterogeneity and dis-persal. Acta Jutlandica LXX: 2, Aarhus University Press. Aarhus: 13-22.
TOFT, S. & RIEDEL, W. (eds.), 1995. Arthropod natural
enemies in arable land. I density, spatial heteroge-neity and dispersal. Acta Jutlandica LXX: 2, Aarhus University Press. Aarhus. 314 pp.
TOPPING, C. J. & SUNDERLAND, K. D., 1992. Limitations to the use of pitfall traps in ecological studies exem-plified by a study of spiders in a field of winter wheat. Journal of Applied Ecology, 29: 485-491. TÖRMÄLÄ, T., 1982. Evaluation of five methods of
sam-pling field layer arthropods, particularly the leafhop-per community, in grassland. Annales Entomologici Fennici, 48: 1-16.
TOTI, D. S., COYLE, F. A. & MILLER, J. A., 2000. A
struc-tured inventory of Appalachian grass bald and heath bald spider assemblages and a test of species richness estimator performance. Journal of Arachnology, 28: 329-345.
YAMAMURA, K., 1999. Transformation using (x + 0.5) to stabilize the variance of populations. Research in Population Ecology, 41: 29-234.
ZAR, J. H., 1984. Biostatistical analysis. 2nd edn.