ECOLOGY, BEHAVIOR AND BIONOMICS
Arthropod Recolonization in the Restoration of a Semideciduous Forest in
Southeastern Brazil
M
ARAP P
AIS1, E
LENICEM V
ARANDA21Instituto Chico Mendes de Conservação da Biodiversidade, Estrada da Bocaina s/n, Centro, São José do Barreiro, SP, Brasil; [email protected], [email protected]
2Centro de Estudo e Extensão Florestal da USP - CEEFLORUSP, Depto de Biologia, FFCLRP, Univ de São Paulo, Av Bandeirantes 3900, 14040-901 Ribeirão Preto, SP, Brasil; [email protected]
Edited by Wesley A C de Godoy – ESALQ/USP Neotropical Entomology 39(2):198-206 (2010)
ABSTRACT - The use of arthropods for monitoring habitat changes has grown widely in the last decades. In Brazil, however, most of the studies in restored areas have involved only vegetation changes. The present study aimed at investigating recolonization patterns of epigeic arthropods in recently restored sites of semideciduous forests in southeastern Brazil. We compared the community structure of adjoining sites 5, 17, 29 and 36 months old with that at a nearby forest remnant (reference site). We also determined the most abundant species and looked for ecological indicator species of each site age. Arthropods were sampled using pitfall traps, and their assemblages were described and compared with multi- and univariate statistical methods. Species abundance and richness equivalent to the reference site were reached at fi ve months after planting, however species composition was very distinctive not only in relation to the reference site, but also among restored sites. Some of the main species found in this restoration stage are common in agroecosystems or cerrado vegetation. Nevertheless, there was a clear trend of arthropod fauna in restored sites moving toward the fauna in the forest remnant over time. Our results also highlighted ants and termites because of their abundance and ants because of their high value as ecological indicators of restoration age.
KEY WORDS: Formicidae, seasonal forest, monitoring, ecological indicator
The landscape of southeastern Brazil has been entirely transformed over time by human activities (Dean 1997). Changes were especially dramatic in the inner lands originally covered by mesophytic seasonal forests (deciduous and semideciduous forests) since their soils are particularly suitable for agriculture (Oliveira-Filho & Ratter 2002). Such forests are now restricted to few small patches in the agricultural-urban matrix. Some attempts of restoration have been made in the last decades, but their effectiveness has not been properly evaluated. Long-term monitoring of sites where attempts have already been performed is necessary for evaluating restoration success and improving restoration protocols. If techniques involve tree planting, special attention should be dispensed to the fi rst years of the restored site, when the greatest habitat changes occur due to the fast growing of pioneer trees.
Most of the studies in restored areas are concerned with recovery and development of vegetation, especially tree species (Amador & Viana 2000, Souza & Batista 2004), whereas fauna is usually ignored (but see Majer 1992).
Because of the high turnover and growth rates for most species, arthropods serve as probes that quickly respond to environmental changes. Another special attribute lies in their microgeographic distribution, which may refl ect fi ne-scale heterogeneity in habitats to which most vertebrates are
insensitive (Mattoni et al 2000). Arthropods often provide a more sensitive indication than plants of the overall state of the ecosystem in which they occur (Rosenberg et al 1986, Andersen & Sparling 1997). In addition, their assay is inexpensive and can be performed with a few simple trapping methods (Mattoni et al 2000). Pitfall trapping is a well-known method for sampling epigeic arthropods, which can be performed in almost any terrestrial habitat, making it very useful in comparing sites.
The aim of the present study was therefore to follow the recolonization of epigeic arthropods in restored sites representing the fi rst three years after planting. Recolonization patterns were assessed by (1) comparisons of arthropod abundance, richness and diversity, (2) estimates of similarity, (3) detection of species that could be considered as ecological indicators for each site age. A forest remnant was included in the sampling design as a reference site.
Material and Methods
Study sites. The study was carried out in Ribeirão Preto
maximum temperatures are respectively 19.2°C in June and July and 24.4°C in February. Mean annual rainfall is 1,468 mm concentrated in October-March (Kotchetkoff-Henriques et al 2005). The region is included in the Cerrado biome (IBGE & MMA 2004) or in the Cerrado – Tropical Atlantic transition (Ab´Sáber 1977). In fact, it is situated in an ecological tension zone (IBGE 1993), originally covered by a mosaic of cerrado (savannah) on sandy soils, and mesophytic seasonal forests on more fertile soils originating from basalt (Romariz 1964, Oliveira-Filho & Fontes 2000, Oliveira-Filho & Ratter 2002). The landscape currently comprises crop fi elds and urban areas (Kotchetkoff-Henriques 2003). The natural vegetation is reduced to only 3.89% of the municipality area and is dispersed over 102 patches ranging from 247 ha to less than 10 ha, most of them isolated and under different degrees of disturbance (Kotchetkoff-Henriques et al 2005).
Our focus was on the seasonal semideciduous forest. We selected two different systems: a 75 ha revegetated area (REV) at the University of São Paulo campus anda 78 ha forest remnant (FOR), located on Santa Adelaide Farm. FOR is an isolated forest remnant surrounded by sugar cane plantations and bordered by a highway on one side. The FOR site was characterized by three layers and a canopy about 10-15 m high with high vertical and horizontal heterogeneity. The number of tree species is around 68, with Schyzolobium parahyba (guapuruvu), Cariniana estrellensis (jequitibá), and Galesia integrifolia (pau-d’alho) as typical species in the area (Kotchetkoff-Henriques 2003). FOR was chosen as best fi tting the reference site concept (Hobbs & Harris 2001, SER 2004), i.e., it occurs in the same life zone, semideciduous forest, reddish purple latosol soils (Oliveira & Prado 1983); it is close to the restoration project (about fi ve kilometers); and it is exposed to similar natural disturbances. Although it may have been affected by selective logging and fi re in the past, FOR has a high conservation value when compared to other forest patches in the region (Kotchetkoff-Henriques 2003).
The restoration project was established in an 11-year-old abandoned fi eld dominated by the exotic grasses Panicum maximum and Brachiaria decumbens (Poaceae). The area was previously occupied by sugar cane plantations (17 years) and prior to that by coffee plantations (decades). The project was initiated by planting seedlings of about 60 different tree species that are typical of the semideciduous forest, such as Guazuma ulmifolia, Trema micrantha, Cecropia pahystachya, Cederela fissilis, Chorisia speciosa, S. parahyba, C. estrellensis, and G. integrifolia. Pre-planting management of land included clearing, ploughing and chemical fertilizer input, and after planting there was periodic slashing for weed control. The revegetated area is also surrounded by sugar cane plantations, abandoned fi elds, mixed vegetation of the campus (native and exotic trees and shrubs in a grassy matrix, gardens) and residential areas.
We adopted the “chronosequence approach” (Majer 1997) in which a range of sites which represent known ages after planting is sampled at the same time. The resulting differences are then taken to be representative of different stages in the restoration process. This strategy was well suited to the study of our sites, since they were originally part of a continuum and therefore had similar characteristics and also because the restoration procedures were standardized. In the
revegetated area, we selected four adjoining sites: REV1, 36 months old, with 12 ha; REV2, 29 months old, with 16.6 ha; REV3, 17 months old, 1 ha; and REV4, 5 months old, with 5.6 ha. At sampling time, REV sites had a canopy 3-6 m high comprised with two layers, the fi rst one composed by grasses and small saplings, and the second with the more developed saplings.
Sampling. Each of the fi ve sites (FOR, REV1, REV2, REV3
and REV4) was sampled in fi ve 10 x 10 m replicated quadrats, so that we had 25 sampling units. Quadrats were placed 50 m apart in a straight line and at least 10 m from the edge. At each quadrat, eight pitfall traps were set out on a grid design, which originally resulted in 40 traps/site. During sampling some traps were destroyed by animals so that the effective number of traps was 32, 38, 38, 40 and 39 respectively at FOR, REV1, REV2, REV3 and REV4. Pitfall traps consisted of double plastic cups (75 mm diameter, 250 ml), dug into the ground so that the cup border was fl ush with the soil surface. Each pitfall was fi lled with approximately 150 ml of saturated NaCl solution, which preserves the trapped specimens and does not attract the fauna (Brändle et al 2000). Some drops of detergent were added to the solution to break the surface tension, causing the specimens to sink. After traps were dug in, they were left in the fi eld for one week prior to trapping, to avoid a digging-in effect (Greenslade 1973). Traps were then left sampling for seven days during May, in the early dry season.
All arthropods collected were classifi ed according to the morphospecies concept recommended by Oliver and Beattie (1996). A code number was assigned to each morphospecies. When possible, their families were determined. Some of the most abundant and indicator morphospecies were identifi ed by taxonomists.
Data analysis. A species accumulation curve was obtained
for each site by taking the number of pitfall traps as sampling effort. Sample order was randomized 100 times in order to eliminate sampling error and heterogeneity among the units sampled, and the mean and standard deviation of S(n) (the number of species discovered) computed for each value of n between 1 and 40. Expected number of species E(S) and standard deviations SD were calculated using the Chao 2 classic formula (Colwell & Coddington 1994).
Individuals of each morphospecies trapped in the same sampling quadrat were grouped for calculations of species abundance, richness and Shannon diversity. In order to avoid bias due to the loss of some pitfalls, only six pitfalls (instead of eight) were considered per quadrat. Differences in the three variables among sites were evaluated using one-way ANOVAs and Student-Newman-Keuls test.
The same transformed matrix was used for detrended correspondence analysis (DCA), producing a biplot in which sites and species were ordinated simultaneously (Gauch 1982). Characteristic species (indicator species) were identified for each site using the indicator value method (Dufrêne & Legendre 1997). The Monte Carlo test was used to determine the signifi cance of the maximum IndVal recorded for each species. Those morphospecies with signifi cant IndVals greater than 70% (subjective benchmark adopted by van Rensburg et al 1999, McGeogh et al 2002, Nakamura et al 2007) were then regarded as indicator species for the site in question.
The species accumulation curve and Chao 2 estimation were performed using the software EstimateS (Colwell 2006). SigmaStat (Jandel Scientifi c 1995) was used for ANOVA and post hoc tests. Cluster analysis and ANOSIM were performed with PAST software (Hammer et al 2001), while DCA, indicator species analysis and Monte Carlo test were performed with PC-ORD software (McCune & Mefford 1999).
Results
Community structure. Pitfall traps captured a total of
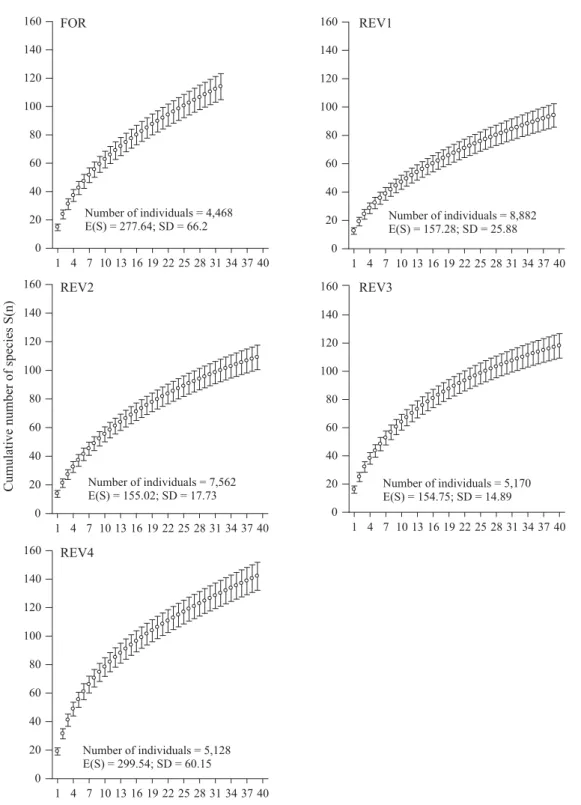
28,643 arthropods (no less than 4,000 per site) of 288 morphospecies. In spite of the high number of arthropods collected, the accumulation curves did not reach a plateau after around 40 samples/site and between 94 (REV1) and 142 (REV4) species captured (Fig 1). According to Chao 2 analysis, a plateau was expected to be achieved at estimated 278, 157, 155, 155 and 299 species at FOR, REV1, REV2, REV3 and REV4, respectively.
Abundance was not different among sites (Table 1). REV4 and FOR had the highest levels of species richness. Diversity did not differ much among sites. The only clear difference was between FOR (2.24) and REV1 (1.70) (Table 1).
Arthropod assemblage differed significantly among all sites (Table 2). In spite of being considered one of the most reliable coeffi cient performers, typically Bray-Curtis similarities tend to increase with increasing severity of matrix transformation (Clarke 1993). The absolute similarity levels (Fig 2) should thus be interpreted with some caution. In this case, it is the relative levels which have a natural interpretation.
Cluster analysis showed higher similarity among quadrats from the same site than among quadrats from different sites (Fig 2). β-diversity across sites was clearly represented in the dendrogram. Arthropods divided sites fi rstly into two clusters: FOR and REV (ANOSIM, r = 0.9705, P < 0.0001). From the REV cluster, in turn, REV4 and REV1 were progressively detached, and REV2 and REV3 were the most similar sites. The distance separating REV4 from the other REV sites was larger than the distance separating REV1, REV2 and REV3 from each other (Fig 2).
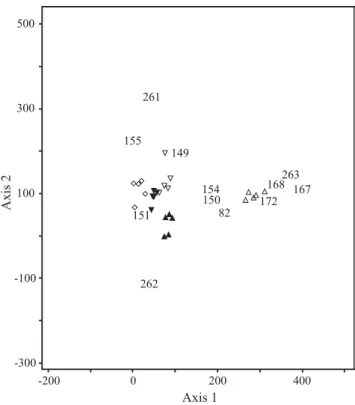
As seen in cluster analysis (Fig 2), DCA of the morphospecies abundance by sample matrix resulted in strong clustering of the samples along the fi rst axis into two clusters, representing REV and FOR (Fig 3). Within the REV
cluster, ordination discriminated the successional gradient on the fi rst axis reaching from REV4 to REV1-REV2 samples. The second DCA axis discriminated the REV1 from REV2 samples. The eigenvalue for the fi rst axis was 0.551, and for the second and third it was 0.180 and 0.123, respectively.
The most abundant species. Fig 3 also shows the DCA
species scores for the 12 most abundant species (see Online Supplementary Material for the identifi cation and abundance data for each species code). Nine out of the 12 most abundant species were ants (Formicidae), and they accounted for 73-88% of total abundance of epigeic arthropods per site, with the lowest and highest percentage at FOR and REV2, respectively. Termites (Termitidae) were also well represented, with three species whose abundances, summed up, represented an increasing percentage of total number of arthropods: 0.55% in REV4 to around 7% in REV1, and more than 8% in FOR. Phoridae sp1 accounted for no more than 3% in FOR and REV1, where it was more abundant.
Typically, many of the species found at the center of the DCA ordination are ubiquitous species, bimodally distributed species, or species whose distribution otherwise departs from a unimodal response curve (Ter Braak & Prentice 1988). Atta sp. (154) was a good example of this phenomenon (Fig 3). Despite its higher occurrence at REV2, this species was abundant at all sites sampled. The same occurred with Megalomyrmex sp. (150) and Phoridae sp. (82), even though they were a little more abundant at REV1. Camponotus rufi pes Fabr. (151) was representative of the entire REV complex, with the exception of REV4, where its abundance was very low. In contrast, species found at the edges of the ordination diagram are generally abundant only at a given site. Typical species of the forest patch were Camponotus sp. (167), Camponotus sericeiventris (Guérin) (168), Pheidole sp. (172) and Velocitermes sp. (263). Syntermes nanus Constantino (262) was found predominantly in the REV1 cluster. Another species complex including Crematogaster sp. (149) and Syntermes grandis (Rambur) (261) had ordination optima within REV2-REV3 (Fig 3).
As Formicidae was the most abundant group among the epigeic arthropods, we decided to compare the structure of this subset of arthropod community among sites in the same way as done for the entire assemblage. As a result, the abundance of Formicidae did not differ among sites whereas species richness was higher at FOR in comparison with the REV sites (Table 3). The highest diversity levels were found at FOR, REV2 and REV3, and the lowest at REV4 (Table 3).
Indicator species. FOR and REV4, both extremes in the
Fig 1 Species accumulation curves for arthropods from pitfall traps in the forest remnant (FOR) and at restored sites (REV1, REV2, REV3, REV4). Each point represents the mean of 100 randomizations of sample pooling order. Error bars are the corresponding standard deviations. Expected number of species E(S), and standard deviations (SD) were calculated using the Chao 2 formula.
FOR
1 4 7 10 13 16 19 22 25 28 31 34 37 40 0
20 40 60 80 100 120 140
160 REV1
1 4 7 10 13 16 19 22 25 28 31 34 37 40 0
20 40 60 80 100 120 140 160
REV2
Number of pitfal traps pooled (n) 1 4 7 10 13 16 19 22 25 28 31 34 37 40
0 20 40 60 80 100 120 140
160 REV3
1 4 7 10 13 16 19 22 25 28 31 34 37 40 0
20 40 60 80 100 120 140 160
REV4
1 4 7 10 13 16 19 22 25 28 31 34 37 40 0
20 40 60 80 100 120 140 160
Number of individuals = 4,468 E(S) = 277.64; SD = 66.2
Number of individuals = 5,170 E(S) = 154.75; SD = 14.89
Number of individuals = 8,882 E(S) = 157.28; SD = 25.88
Number of individuals = 5,128 E(S) = 299.54; SD = 60.15
Number of individuals = 7,562 E(S) = 155.02; SD = 17.73
Cumulative number of species S(n)
Discussion
Despite the large number of individuals captured, the species accumulation curves suggested that we did not sample all the species available. Species accumulation curves of
never generates curves that completely fl atten out and reach a plateau (Fisher 1999). Furthermore, several important epigeic taxa such as ants and termites have patchy distribution (Soares & Schoereder 2001, Nakamura et al 2003, 2007), which results in new species being found sporadically.
We did not actually intend to compile a species inventory but to achieve adequate spatial replication (Grimbacher et al 2007). Also, sampling was not seasonal, i.e.our data were obtained within a month. Therefore, our conclusions about arthropod communities and indicator species may not apply
throughout the year as the measured parameters usually change with seasonality. Nevertheless we were successful in showing measurable assemblage-level responses to restoration age and reference habitat.
Among the attributes that demonstrate an appropriate trajectory of restored areas towards the intended goals or reference ecosystem, the fi rst one is “similar assemblage of species and community structure” (SER 2004). In this study, we focused on this attribute, i.e., we analyzed community structure of composition of arthropods at the initial stage of the restoration process.
Abundancens Richness Diversity FOR 792.6 ± 268.9 46.4 ± 5.8 ab 2.24 ± 0.3 a REV1 1095.8 ± 319.2 31 ± 10.4 c 1.70 ± 0.2 b REV2 1181.2 ± 556.5 36.8 ± 7.4 bc 1.77 ± 0.2 ab REV3 932.2 ± 336.5 39.8 ± 3.4 bc 2.06 ± 0.1 ab REV4 964.6 ± 291.3 54.6 ± 3.4 a 2.06 ± 0.4 ab
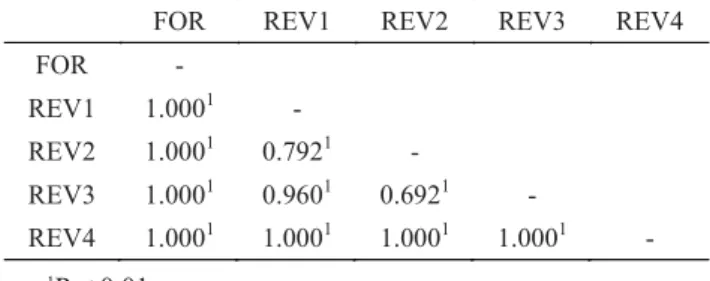
FOR REV1 REV2 REV3 REV4 FOR -
REV1 1.0001 -
REV2 1.0001 0.7921 -
REV3 1.0001 0.9601 0.6921 - REV4 1.0001 1.0001 1.0001 1.0001 -
Table 2 ANOSIM pairwise comparisons (R statistic) of sites using the Bray-Curtis similarity matrix produced for the arthropod assemblage in the forest remnant (FOR) and at restored sites (REV1-REV4).
1P < 0.01 Table 1 Comparison of species abundance, richness and
diversity means (± SD) of epigeic arthropods in the forest remnant (FOR) and at restored sites (REV1-REV4).
ANOVA, n = 5. Student-Newman-Keuls Test. Values followed by different letters in the same column are different (P < 0.05); nsnon signifi cant.
Fig 2 Dendrogram for hierarchical agglomerative clustering of arthropod samples in the forest remnant (FOR) and at restored sites (REV1-REV4), based on Bray-Curtis similarity matrices.
0 3 6 9 12 15 18 21 24
Samples 0
0,1 0,2 0,3 0,4 0,5 0,6 0,7 0,8 0,9 1
Bray-Curtis Similarity
Our results showed that even a 5-month-old restored site can reach arthropod abundance equivalent to that observed at the forest and that these levels do not necessarily change during the fi rst three years after revegetation. Hamburg et al (2004) found a humped relationship between total ant abundance and rehabilitation age, with peak levels far higher than those at natural sites. However, the peak only occurred after 5-7 years, a period not sampled in our study.
Species richness, in turn, was also high in the fi rst months after planting, with levels equivalent to that of the forest remnant. Even though species richness is considered to be the most easily restored component of biodiversity, recovery of species richness usually takes longer periods, e.g., around
20-40 years for several animal taxa (Dunn 2004) or up to 5-15 years for ground-active beetles in rainforest restoration (Grimbacher et al 2007).
After the five-month peak, richness decreased systematically with revegetation age. This finding was unexpected since, at least for ants, the opposite has been reported (Majer 1992, Bisevac & Majer 1999, Andersen et al 2003, Hamburg et al 2004). Sometimes, species richness at rehabilitation sites even exceeds reference sites in mid-succession (Jackson & Fox 1996). Even when a break in increasing richness occurs, it happens only after fi ve years (Majer 1996). In our study, ant richness did not follow the decreasing pattern observed for the entire arthropod assemblage nor did it increase as reported in the above-mentioned studies, but showed a continuous level that was low in relation to the reference site.
Which process within the system could explain these patterns? Considering that the initial colonists of a site represent regional pool species and that a site is more likely to be colonized by abundant species than by rare species (Schowalter 2000), the explanation can be possibly found in the regional pool of arthropod species in the surrounding habitats such as cultivated lands and abandoned fi elds. Such areas serve as population sources of open-habitat or opportunistic arthropods, providing a fast input of species to the recently restored site, a habitat composed basically of tree samplings scattered in a sparse herb layer. One example is Dorymyrmex sp., which was abundant at the 5-month-old site and successively decreased in number with age of site. This species belongs to a genus that is typical of open areas (Shattuck & Barnett 2005). Some of the indicator species of the 5-month-old site, e.g.,Agalliana sticticollis (Stål) (Cicadellidae) and Astylus variegatus (Germar) (Melyridae), are widespread insects with occurrence in crop systems indeed (Bennett 1967, Ferreira & Barrigossi 2006).
As habitat attributes change rapidly due mainly to the vegetation growing, these species are substituted by others more adapted to the new conditions. This conclusion is supported by the high turnover (β-diversity) of epigeic arthropod species found across all sites. Considering that there is no forest remnant in the close surroundings (the nearest one is our reference site, about 5 km away), the rate of colonization by forest species would be much slower, which explains the decline in species richness.
In fact, the vegetation structure of the 1- to 3-year-old sites resembled more that of a savannah than of a forest. Taking this into account and also the fact that the region of study is situated in a tension zone between cerrado and forest (IBGE 1993), it is not surprising that some of the main species found in this restoration stage are typical or common in cerrado vegetation. This is the case of the termites Syntermes grandis and S. nanus (Constantino 2005).
Despite the high dissimilarity between the forest patch and the revegetated area, epigeic arthropod assemblages of revegetated sites moved toward the forest patch score over time. It does not mean, however, that restored sites will ever achieve the same species composition of the forest remnant. Restored sites all over the world have not reached species composition of different living groups from reference sites, even several decades after restoration (Majer 1992, 1996,
Abundancens Richness Diversity FOR 652.8 ± 250.2 17.4 ± 3.36 a 1.82 ± 0.27 a REV1 947.8 ± 309.3 9.8 ± 2.17 b 1.46 ± 0.16 b REV2 1060.6 ± 517.8 11.8 ± 3.03 b 1.61 ± 0.16 ab REV3 830.8 ± 313.8 11.0 ± 2.34 b 1.76 ± 0.12 a REV4 780.4 ± 330.7 8.4 ± 1.67 b 1.22 ± 0.16 c
Table 3 Comparison of species abundance, richness and diversity means (± SD) of epigeic ants in the forest remnant (FOR) and at restored sites (REV1-REV4).
ANOVA, n = 5. Student-Newman-Keuls Test. Values followed by different letters in the same column are different (P < 0.05); nsnon signifi cant.
Fig 3 Ordination diagram of the fi rst two axes of detrended correspondence analysis (DCA), showing sites and the 12 most abundant species. Species codes are related to the identifi cation in Table 2. △= forest remnant, ▲ = REV1, ▽ = REV2, ▼ = REV3;
◇ = REV4 (all morphospecies included in the analysis).
82 149
150
154 168 167 172
263
151 155
262 261
-200 -300
0 200 400
-100 100 300 500
Axis 1
Burger et al 2003, Grimbacher et al 2007). One of the few exceptions seems to be a rehabilitation site in Australia, which grouped with reference sites in multivariate analysis of ant assemblage (Andersen et al 2003).
The most abundant epigeic arthropods were ants and termites both in the restored sites and forest remnant, but with different species. The leaf-cutting ants (Atta sp.) were exceptions since they were equally abundant everywhere. The nine most abundant species of Formicidae accounted for more than 70% of total abundance of arthropods at all the sites studied. We did not determine, however, if ants in the restored area and mature forest were playing equivalent roles. On the other hand, termites found both in the restored sites (S. grandis and S. nanus) and reference site (Velocitermes sp.) interact with habitat in the same way, foraging for leaf litter (Constantino 2005). A proportional abundance of termites rose slower over time in comparison to ants, but in three years abundance of S. nanus approached abundance levels of Velocitermes sp. at the reference site.
Besides ants and termites, the only other very abundant species was a Phoridae, and it was probably linked to ant abundance, since the majority of parasitoid species of Phoridae attack adults of Formicidae (Feener Jr & Brown 1997).
Based on pitfall sampling, this study pointed to ants as the main local indicator taxa among epigeic arthropods, with seven out of 12 species being representative of the forest remnant, our restoration target. This fi nding corroborates the increasing recognition of ants as a useful group for land managers to monitor changes in terrestrial ecosystems (Majer & Kock 1992, Andersen & Sparling 1997, Hamburg et al 2004, Santos et al 2006). According to these researchers, ants are suitable for biomonitoring because of their a) high richness, diversity, abundance and biomass; b) ecological importance at all trophic levels; c) critical ecological role in soil turnover and structure, nutrient cycling, plant protection, seed dispersal and seed predation; d) easy sampling; e) wide geographic distribution; f) sensitivity to environmental changes; and f) relatively well-known taxonomy and dynamics within the community.
The main goal in the restoration of semideciduous forests in southeastern Brazil is for restored sites to resemble the small patches of mature forest that have resisted deforestation. These patches are disturbed in a variety of degrees (Nascimento et al 1999, Almeida 2000, Tabanez & Viana 2000) as a result of being submitted to a long period of isolation and to pressures from the anthropized matrix. Nevertheless, they are the only reference that persists of what were once magnifi cent seasonal forests. Our study contributes to the conservation efforts for this highly threatened ecosystem as it provides baseline information for understanding the dynamics of colonization of a subset of its biota at the fi rst restoration stage.
Acknowledgments
We are grateful to the owner of Santa Adelaide Farm for permission to work on its reserve. Thanks go to Reginaldo Constantino, Sônia Fraga, Antonio Brescovit, Luciano
Moura, Gabriel Mejdalani, Ana Gonçalves, Regina Zonta-de-Carvalho, Sonia Lazzari, Nicolas Albuquerque, Patrícia Romano, Maria Isabel Balbi, and Luiz Antônio Costa for arthropod identifi cation. Also, gratitude is extended to Odair Fernandes, Júlio Louzada, Benedita Aglai da Silva and Alexandre Adalardo de Oliveira for comments on a previous version of this manuscript. FAPESP (State of São Paulo Research Foundation) provided fi nancial support (Process number 99/00836-2).
References
Ab’Sáber A N (1977) Os domínios morfoclimáticos na América do Sul: primeira aproximação. Geomorfologia 52: 1-22.
Almeida D S de (2000) Recuperação ambiental da mata atlântica. Editus, Ilhéus, 130p.
Amador D B, Viana V M (2000) “Low forests” dynamics in a forest remnant restoration. Sci For 57: 69-85.
Andersen A N, Hoffmann B D, Somes J (2003) Ants as indicators of minesite restoration: community recovery at one of eight rehabilitation sites in central Queensland. Ecol Manage Restor 4: 12-19.
Andersen A N, Sparling G P (1997) Ants as indicators of restoration success: relationship with soil microbial biomass in the Australian seasonal tropics. Restor Ecol 5: 109-114.
Bennett C W (1967) Epidemiology of leafhopper-transmitted viruses. Annu Rev Phytopathol 5: 87-108.
Bisevac L, Majer J D (1999) Comparative study of ant communities of rehabilitated mineral sand mines and heathland, Western Australia. Restor Ecol 7: 117-126.
Brändle M, Durka W, Altmoos M (2000) Diversity of surface dwelling beetle assemblages in open-cast lignite mines in Central Germany. Biodiv Conserv 9: 1297-1311.
Burger J C, Redak R A, Allen E B, Rotenberry J T, Allen M F (2003) Restoring arthropod communities in coastal sage scrub. Conserv Biol 17: 460-467.
Clarke K R (1993) Non-parametric multivariate analysis of changes in community structure. Aust J Ecol 18: 117-143.
Clarke K R, Warwick R M (1994) Change in marine communities: an approach to statistical analysis and interpretation. Natural Environment Research Council, Swindon, 172p.
Colwell R K (2006) EstimateS: statistical estimation of species richness and shared species from samples. Version 8. University of Connecticut. Accessed on November 2007. URL: http:// viceroy.eeb.uconn.edu/estimates.
Colwell R K, Coddington J A (1994) Estimating terrestrial biodiversity through extrapolation. Philos Trans R Soc Lond, Ser B: Biol Sci 345: 101-118.
Dean W (1997) A ferro e fogo - a história e a devastação da mata atlântica brasileira. Companhia das Letras, São Paulo, 484p.
Dufrêne M, Legendre P (1997) Species assemblages and indicator species: the need for a fl exible asymmetrical approach. Ecol Monogr 67: 345-366.
Dunn R T (2004) Recovery of faunal communities during tropical forest regeneration. Conserv Biol 18: 302-309.
Feener Jr D H, Brown B V (1997) Diptera as parasitoids. Annu Rev Entomol 42: 73-97.
Ferreira E, Barrigossi J A F (2006) Insetos orizívoros da parte subterrânea. Embrapa Arroz e Feijão, Santo Antônio de Goiás, 52p.
Fisher B L (1999) Improving inventory effi ciency: a case study of leaf-litter ant diversity in Madagascar. Ecol Appl 9: 714-731.
Gauch H G (1982) Multivariate analysis in community ecology. Cambridge University Press, Cambridge, 298p.
Greenslade P J M (1973) Sampling ants with pitfall traps: digging-in effects. Insectes Soc 20: 343-353.
Grimbacher P S, Catterall C P, Kanowski J, Proctor H C (2007) Responses of ground-active beetle assemblages to different styles of reforestation on cleared rainforest land. Biodivers Conserv 16: 2167-2184.
Hamburg H V, Andersen A N, Meyer W J, Robertson H G (2004) Ant community development on rehabilitated ash dams in the South African Highveld. Restor Ecol 12: 552-558.
Hammer Ø, Harper D A T, Ryan P D (2001) PAST: palaeontological statistics software package for education and data analysis. Paleontol Eletronica 4, 9p.
Hobbs R J, Harris J A (2001) Restoration ecology: repairing the earth’s ecosystems in the new millennium. Restor Ecol 9: 239-246.
IBGE – Instituto Brasileiro de Geografi a e Estatística (1993) Mapa de vegetação do Brasil, IBGE, Rio de Janeiro.
IBGE – Instituto Brasileiro de Geografi a e Estatística and MMA – Ministério do Meio Ambiente (2004) Mapa dos biomas do Brasil. IBGE, Rio de Janeiro. URL: http://mapas.ibge.gov.br/ biomas2/viewer.htm. Accessed on August 2007.
Jackson G P, Fox B J (1996) Comparison of regeneration following burning, clearing or mineral sand mining at Tomago, NSW. II. Succession of ant assemblages in a coastal forest. Aust J Ecol 21: 200-216.
Jandel Scientifi c (1995) SigmaStat statistical user’s manual, version 2.0. San Rafael, California.
Kotchetkoff-Henriques O (2003) Characterization of the natural vegetation in Ribeirão Preto, SP: bases for Conservation. PhD thesis, USP, Ribeirão Preto, 221p.
Kotchetkoff-Henriques O, Joly C A, Bernacci L C (2005) Soil and
fl oristic composition of native vegetation remnants relationship in the municipality of Ribeirão Preto, SP. Rev Bras Bot 28: 541-562.
Majer J D (1992) Ant recolonization of rehabilitated bauxite mines of Poços de Caldas, Brazil. J Trop Ecol 8: 97-108.
Majer J D (1996) Ant recolonization of rehabilitated bauxite mines at Trombetas, Pará, Brazil. J Trop Ecol 12: 257-273.
Majer J D (1997) Invertebrates assist the restoration process: an Australian perspective, p.212-237. In Urbanska K M, Webb N R, Edwards P J (eds) Restoration ecology and sustainable development. Cambridge University Press, Cambridge, 397p.
Majer J D, Kock A E (1992) Ant recolonization of sand mines near Richards Bay, South Africa: an evaluation of progress with rehabilitation. S Afr J Sci 88: 31-36.
Mattoni R, Longcore T, Novotný V (2000) Arthropod monitoring for fi ne-scale habitat analysis: a case study of the El Segundo sand dunes. Environ Manage 25: 445-452.
McCune B, Mefford M J (1999) PC-ORD. Multivariate analysis of ecological data. Version 4. MjM Software Design, Gleneden Beach, Oregon.
McGeoch M A, van Rensburg B J, Botes A (2002) The verifi cation and application of bioindicators: a case study of dung beetles in a savanna ecosystem. J Appl Ecol 39: 661-672.
Nakamura A, Catterall C P, House A P N, Kitching R L, Burwell C J (2007) The use of ants and other soil and litter arthropods as bio-indicators of the impacts of rainforest clearing and subsequent land use. J Insect Conserv 11: 177-186.
Nakamura A, Proctor H, Catterall C P (2003). Using soil and litter arthropods to assess the state of rainforest restoration. Ecol Manage Restor 4: 20-28.
Nascimento H E M, Dias A S, Tabanez A A J, Viana V M (1999) Tree populations structure and dynamics of a semideciduous seasonal forest fragment in the Piracicaba region, São Paulo state, Brazil. Rev Bras Biol 59: 329-342.
Novotný V, Basset Y (2000) Rare species in communities of tropical insect herbivores: pondering the mystery of singletons. Oikos 89: 564-572.
Oliveira J B, Prado H (1983) Levantamento pedológico semi-detalhado do estado de São Paulo - Quadrícula de Ribeirão Preto, escala 1:100.000. Convênio Embrapa - Secretaria de Agricultura e Abastecimento do estado de São Paulo, Coordenadoria da Pesquisa Agropecuária e Instituto de Agronomia - Seção de Pedologia, Campinas, Brasil.
Oliveira-Filho A T, Fontes M A L (2000) Patterns of fl oristic
differentiation among Atlantic forests in south-eastern Brazil, and the infl uence of climate. Biotropica 32: 793-810.
Oliveira-Filho A T, Ratter J A (2002) Vegetation physiognomies and wood fl ora of the cerrado biome, p.91-120. In Oliveira P S, Marquis R J (eds) The cerrados of Brazil. Columbia University Press, New York, 398p.
Oliver I, Beattie A J (1996) Designing a cost-effective invertebrate survey: a test of methods for rapid assessment of biodiversity. Ecol Appl 6: 594-607.
Price P W, Diniz I R, Morais H C, Marques E S A (1995) The abundance of insect herbivore species in the tropics: the high local richness of rare species. Biotropica 27: 468-478.
Brasil, a terra e o homem, vol. I. Companhia Editora Nacional, São Paulo, 571p.
Rosemberg D M, Danks H V, Lehmhuhl D M (1986) Importance of insects in environmental impact assessment. Environ Manage 10: 773-783.
Santos M S, Louzada J N C, Dias N, Zanetti R, Delabie J H C, Nascimento I C (2006) Litter ants richness (Hymenoptera, Formicidae) in remnants of a semi-deciduous forest in the Atlantic rain forest, Alto do Rio Grande region, Minas Gerais, Brazil. Iheringia, Ser Zool 96: 95-101.
Schowalter T D (2000) Insect ecology: an ecosystem approach. Academic Press, San Diego, California, 483p.
SER – Society for Ecological Restoration International Science & Policy Working Group (2004) The SER International Primer on Ecological Restoration. www.ser.org & Tucson: Society for Ecological Restoration International.
Shattuck S, Barnett N (2005) Dorymyrmex. Specimen database of the Australian National Insect Collection, CSIRO (Commonwealth Scientifi c and Industrial Research Organization) Entomology. URL: http://anic.ento.csiro.au/database/biota_details. aspx?BiotaID=35686. Accessed on November 2007.
Soares S M, Schoereder J H (2001) Ant-nest distribution in a remnant of tropical rainforest in southeastern Brazil. Insectes Soc 48: 280-286.
Souza F M, Batista J L F (2004) Restoration of seasonal semideciduous forest in Brazil: infl uence of age and restoration design on forest structure. For Ecol Manage 191: 185-200.
Tabanez A J, Viana V M (2000). Patch structure within Brazilian Atlantic forest fragments and implications for conservation. Biotropica 32: 925-933.
Ter Braak C J F, Prentice I C (1988) A theory of gradient analysis. Adv Ecol Res 18: 271-317.
van Rensburg B J, McGeoch M A, Chown S L, van Jaarsveld A S (1999) Conservation of heterogeneity among dung beetles in the Maputaland Centre of Endemism, South Africa. Biol Conserv 88: 145-153.
Pais M P, Varanda E M (2010) Arthropod Recolonization in the Restoration of a Semideciduous Forest in Southeastern Brazil.
Neotrop Entomol 39(2): 198-206.
Number of individuals per site of the 12 most abundant species of epigeic arthropods in the forest remnant (FOR) and at restored sites (REV1-REV4).
Species code Taxon Abundance
FOR REV1 REV2 REV3 REV4
Diptera, Phoridae
82 Phoridae sp. 124 199 59 59 73
Hymenoptera, Formicidae
149 Crematogaster sp. 62 313 802 567 51
150 Megalomyrmex sp. 1092 1766 1446 1289 1416
151 Camponotus rufipes 0 1287 911 617 16
154 Atta sp. 878 1959 2696 329 379
155 Dorymyrmex sp. 0 29 763 1127 1973
167 Camponotus sp. 428 0 0 0 0
168 Camponotus sericeiventris 251 0 0 0 0
172 Pheidole sp. 237 35 25 0 46
Isoptera, Termitidae
261 Syntermes grandis 0 0 274 26 0
262 Syntermes nanus 0 481 18 2 29
263 Velocitermes sp. 334 0 2 9 0
Neotrop Entomol 39(2): 198-206.
Percentage indicator values (IndVal > 70%) of epigeic arthropod species in the forest remnant (FOR) and at restored sites (REV1-REV4).
Species code Taxon Site IndVal P1
Araneae, Theridiidae
10 Coleosoma floridanum FOR 80.0 0.0040
Dictyoptera, Blattelidae
23 Xestoblatta sp. FOR 80.0 0.0010
Coleoptera, Melyridae
41 Astylus variegatus REV4 78.1 0.0010
Coleoptera, Tenebrionidae
56 Tenebrionidae sp. REV4 74.1 0.0040
Diptera, Phoridae
78 Hypocera sp. FOR 80.0 0.0010
Diptera, Drosophilidae
93 Drosophilidae sp. FOR 80.0 0.0040
Hemiptera, Miridae
116 Phylini sp. REV4 86.5 0.0010
128 Miridae sp. REV4 80.0 0.0030
Hemiptera, Cicadellidae
142 Agalliana sticticollis REV4 77.6 0.0010
Hemiptera, Aphididae
143 Aphis sp. REV4 90.4 0.0010
Hymenoptera, Formicidae
167 Camponotus sp. FOR 100.0 0.0010
168 Camponotus sericeiventris FOR 100.0 0.0010
170 Linepithema sp1 FOR 80.0 0.0020
176 Linepithema sp2 FOR 100.0 0.0010
171 Cyphomyrmex sp. FOR 92.2 0.0010
173 Odontomachus sp. FOR 100.0 0.0010
182 Wasmannia sp. FOR 72.6 0.0040
Hymenoptera, Chalcidoidea
203 Chalcidoidea sp 1 FOR 100.0 0.0010
244 Chalcidoidea sp 2 REV4 100.0 0.0010
Hymenoptera, Sphecidae
220 Prionyx chilensis REV4 77.2 0.0020
Hymenoptera, Halictidae
234 Pereirapis sp. REV4 79.5 0.0010
Isoptera, Termitidae
262 Syntermes nanus REV1 73.2 0.0010
Thysanoptera
286 Thysanoptera sp. REV4 73.3 0.0010