MODELLING LAND USE AND LAND COVER
CHANGES IN PORTUGAL:
A MULTI-SCALE AND MULTI-TEMPORAL APPROACH
Bruno M. Meneses1 eusébio reis2 Maria J. Vale3 rui reis3
ABSTRACT – Portuguese territory has experienced relevant land use and land cover
changes (LUCC) in recent decades. The revision of existing land use and land cover (LUC) datasets and the production of new datasets have allowed us to better understand LUCC over time. This study furthers that analysis by using the most recent LUC datasets, which cover the entirety of the Portuguese continental area from 1990 to 2012 and presents innovative know-ledge that aids in the understanding of LUC dynamics within that period. This study shows that the trends that have induced spatial variations within different LUC classes have changed over time, revealing different spatial and temporal dynamics of those LUCC in the Portuguese territory. The main LUCC are related to reductions in forests and certain types of agricultural areas and increases in urban areas, but the main LUCC assume different dynamics when taken at the regional scale (nUts ii). future tendencies of LUCC were also estimated using Cellular automata-Markov (Ca-Markov), and the results show the increasing and decreasing tenden-cies of the LUC types previously mentioned. The areas of LUC datasets with different proper-ties were compared, and large area discrepancies were observed for some LUC classes. These assessments provide relevant results for the evaluation and understanding of LUCC for Portu-guese planning processes in the near future.
Keywords: Land use and land cover (LUC); LUC geoinformation properties; LUC changes (LUCC); LUCC projection; mainland Portugal.
recebido: julho 2017. aceite: outubro 2017.
1 investigador associado do Centro de estudos Geográficos do instituto de Geografia da Universidade de Lisboa, r. Branca
edmée Marques, 1600-276, Lisboa, Portugal. e-mail: [email protected]
2 Professor auxiliar e investigador efetivo do Centro de estudos Geográficos do instituto de Geografia da Universidade de
Lisboa, r. Branca edmée Marques, 1600-276, Lisboa, Portugal. e-mail: [email protected]
3 investigador da Direção Geral do território, r. da artilharia 1, 107, 1099-052, Lisboa, Portugal. e-mail: mvale@dgterritorio.
RESUMO – MODeLaÇÃO Das aLteraÇÕes De UsO e OCUPaÇÃO DO sOLO
eM POrtUGaL. UMa aBOrDaGeM MULtiesCaLa e MULtiteMPOraL. em Por-tugal ocorreram grandes transições de Uso e Ocupação do solo (UOs) nas últimas duas décadas. a revisão da cartografia de UOs e a produção de nova cartografia vem permitir o estudo das alterações de UOs ao longo do tempo. este estudo apresenta avanços na análise destas alterações (de 1990 a 2012) utilizando a cartografia mais recente para o território português (cobertura integral), mas também um conhecimento inovador que ajuda a perce-ber essas alterações. as tendências de variação espacial dos vários tipos de UOs não são constantes ao longo do tempo, revelando as diferentes dinâmicas espaciais e temporais des-tas alterações no território em análise. sobressai a redução de área florestal e de determina-dos tipos de áreas agrícolas, e o aumento das áreas urbanas. no entanto, as variações obser-vadas assumem diferentes dinâmicas a nível regional (nUts ii). as futuras alterações de UOs foram estimadas através de autómatos celulares (Ca-Markov), revelando os resultados tendência para o aumento e redução dos tipos de UOs anteriormente referidos. a área de UOs foi comparada com outra cartografia de UOs (com diferentes propriedades), obser-vando-se grande discrepância de área em algumas classes de UOs. estas avaliações são importantes para se compreender as alterações de uso e ocupação do solo relevantes para o planeamento do território em Portugal num futuro próximo.
Palavras-chave: Uso e ocupação do solo (UOs); propriedades da geoinformação de UOs; alterações UOs; projeções de UOs; Portugal Continental.
RÉSUMÉ – Les tYPes D’UtiLisatiOn et D’OCCUPatiOn DO sOL aU
POrtU-GaL. Une MÉtHODOLOGie MULti-sCaLaire etMULti-teMPOraLe. au cours des deux dernières décennies, le Portugal a enregistré de grands changements dans l’utilisation et l’occupation du sol (UOs). La révision des données existantes et la production de données nouvelles permettent de mieux comprendre les changements subis par l’UOs. On utilise ici des données allant de 1990 à 2012. elles permettent non seulement de cartographier tout le territoire mais montrent aussi des aspects nouveaux, car la tendance de variation des divers types d’utilisation du sol s’est modifiée dans le temps. On note surtout la réduction de l’aire forestière et de certains types agricoles, et l’amplification des aires urbaines. Mais ces variations ont des dynamiques régionales (nUts ii) différenciées. Pour évaluer les futures tendances de l’UOs, on a utilisé des automates cellulaires (Ca-Markov). On constate ainsi des différences importantes, qu’on a comparées avec les résultats obtenus par d’autres méthodes cartographi-ques. Les résultats seront à prendre en compte dans les processus de planification du territoire qui seront mises prochainement en œuvre.
Mots clés: Utilisation et occupation du sol (UOs); Propriété de la Géo-information de l’UOs; Changements de l’UOs; Projection de l’UOs; Portugal Continental.
i. intrODUCtiOn
1. Land use and land cover
The study of the evolution of land use and land cover (LUC) has been of general concern in many territories due to observed transitions that reflect spatiotemporal
dynamics (shi, Chen, & Pan, 2000; nunes, serra, Pons, & saurí, 2008; almeida, & Coelho, 2011; König et al., 2013). in these approaches, the factors at the origin of the largest land use and land cover changes (LUCC) are the most important for the obser-ved negative impacts (e.g., water erosion due to forest losses, catastrophic phenomena such as floods that are related to increases in impermeable surfaces, and reductions in surface water quality) (fearnside, 1995; Hansen, stehman, & Potapov, 2010; schoene & Bernier, 2012).
studies of LUCC are essential to the understanding of many presently observed phe-nomena, especially climate changes (Li et al., 2017; tasser, Leitinger, & tappeiner, 2017), biological (Moreira et al., 2012; song & Deng, 2017) and environmental perturbations (Kim et al., 2017), landscape fragmentation (nurwanda, Zain, & rustiadi, 2016), human health impacts (Patz & Olson, 2017) and the growth of urban areas (Du & Huang, 2017), among others.
LUC in Portugal has also suffered major changes over the past few decades. Those changes can be retrieved and documented through the analysis of the country’s diverse thematic cartography, thereby documenting the past (Meneses, saraiva, reis, & Vale, 2014; Meneses, Vale, & reis, 2014). Other LUCC studies on the Portuguese territory have been developed by other authors in past years. for example: Moreira et al. (2012) evalu-ated the impacts of LUCC on the biodiversity of agricultural landscapes in four alentejo regions; freire, santos and tenedório (2009) studied recent urbanization and LUCC in Portugal, emphasizing the influence of coastlines and coastal urban centres; and abran-tes, fonabran-tes, Gomes and rocha (2016) studied the compliance of land cover changes with municipal land use planning in the Lisbon region.
With the latest LUC cartography (full coverage), it will be possible to obtain new and more accurate results for the Portuguese territory. The comparison and analysis of this cartography with older cartography is crucial for understanding LUCC dynamics (Pôças, Cunha, Marcal, & Pereira, 2011; teixeira, teixeira, & Marques, 2014) and will allow com-parisons of different spatio-temporal LUCC realities. The Corine Land Cover (CLC) car-tography, which was recently produced for 2012 and is available from the european envi-ronment agency (eea), allows this type of analysis of LUC evolution for a longer period (1990-2012). since the criteria and specifications remained constant over this period, the analysis of LUC evolution can be consistently and systematically undertaken, allowing analyses at a detailed level.
The LUCC for Portugal were analysed in the Landyn research project for 1980, 1995 and 2010, based on a sampling methodology that used 1279 LUC samples (the area for
each sample was 4 km2). in that project, the areas occupied by 32 classes of LUC in
main-land Portugal were estimated for the above years through the extrapolation of sample observations (DGt, 2013b; Meneses, Vale, et al., 2014).
Based on the estimated areas, LUCC in Portugal were evaluated. The results showed large area variations between each type of LUC (emphasizing reductions in agricultural land), which allowed us to perceive some transition dynamics (Meneses et al., 2014; Vale, reis, & Meneses, 2014).
Other studies have been undertaken in this territory using LUC geoinformation. for example, the work used to support the reporting of emissions and carbon seques-tration in the land-use sector (and respective changes) within the framework of the Kyoto Protocol (DGt, 2014) was based on LUC cartography (consisting of 19 classes) as a result of a Land Cover Mapping program (COs) in Portugal covering the years 1995, 2007 and 2010 that was prepared by the General Directorate for territorial Deve-lopment (DGt).
The driving forces and some implications arising from LUCC in this territory have been analysed. We highlight the expansion of agricultural land resulting from the cons-truction of dams (alentejo region) or the conversion of coniferous woods to eucalyptus woods associated with the trend towards increased gross value added and employment in industry and forestry (Meneses, reis, Pereira, Vale, & reis, 2017).
The methodologies used in the evaluations of LUCC are essentially based on transitions between various times using dynamic or transition tables (shi et al., 2000; Yu, Zang, Wu, Liu, & na, 2011). LUCC modelling is typically performed using LUC themes transformed into raster data. This process can lead to deviations in the results derived from the resulting generalizations from the conversion process of the initial geoinformation (vector data). These deviations can be even more expressive when country-level modulation is undertaken, as in mainland Portugal (approximately
89,000 km2).
available geoinformation with certain properties is used for LUCC modelling, and as a result will give specific results, but these will vary if we use different datasets with different properties. in this sense, it is necessary to understand the influence of geoin-formation properties on the results and also to avoid or at least to minimize errors, especially propagation errors (Veregin & Hargitai, 1995; Howard Veregin, 1998; Duckham, Mason, stell, & Worboys, 2001).
Many LUCC models are available for evaluating LUCC. for example, the erOs team (UsGs) developed the fOrecasting sCenarios of Land-use Change (fOre-sCe) modelling framework to provide spatially explicit projections of future LUCC, and that model was used to produce LULC scenarios for part of the U.s. (sohl et al., 2014; sohl, Wimberly, radeloff, Theobald, & sleeter, 2016). The Maxent model has also been used for the multi-temporal modelling of LUCC (amici, Marcantonio, La Porta, & rocchini, 2017), among other uses. On the other hand, software packages for LUCC modelling have appeared, especially for projecting LUCC. We highlight the following: CLUe-s, DinaMiCa eGO, Cellular automata-Markov (Ca-Markov) and Land Change Modeler (both available in iDrisi) (Mas, Kolb, Paegelow, Camacho Olmedo, & Houet, 2014). Ca-Markov has been used in many studies of LUCC and provides good results (Myint & Wang, 2006; Kamusoko, aniya, adi, & Manjoro, 2009; Memarian et al., 2012; Chen, Yu, & Zhang, 2013; shafizadeh-Moghadam & Helbich, 2013; sayemuzzaman & Jha, 2014; aburas, Ho, ramli, & ash’aari, 2017; Ghosh et al., 2017).
This study presents an innovative LUCC framework for mainland Portugal (past and future) and compares the results obtained by LUC datasets with different properties.
2. Objectives
The main objectives of this research are to analyse LUCC in Portugal over different periods (1990-2000, 2000-06 and 2006-12) using cartography that provides full coverage of the territory (CLC) and to analyse LUCC at the regional level. The secondary objecti-ves are to assess the dynamics and LUCC and to determine future LUCC using cellular automata (Ca-Markov). These results integrate the validation process, that is, the compa-rison of the expected LUC vs. published and validated LUC. The third objective is the comparison of the LUC obtained using CLC and COs, in order to evaluate the discrepan-cies between LUC datasets with different properties.
ii. stUDY area, Data, anD MetHODs
The study area employed in this research was mainland Portugal (88,962.50 km2).
This territory is divided into five nUts ii units: north (23.8% of the area), Centre (31.6%), Lisbon (3.6%), alentejo (35.4%) and algarve (5.6%).
to determine the LUCC, CLC cartography for several years (1990, 2000, 2006 and 2012) was used; the maps are available on the european environment agency (eea) and DGt websites.
to assess the dynamics of changes between the various types of LUC, i.e., to deter-mine whether there have been area losses or gains in certain LUC types when comparing the beginnings and ends of each period, transition tables were computed using the CLC data for different years (1990 and 2012). These data (vector format) were analysed using the arcGis 10.3 software platform, which allowed the identification of the areas where changes occurred and those where the LUC did not suffer modifications. subsequently, all of the results obtained using Gis (geographic information systems) were exported to alphanumeric databases to allow calculations of the areal changes and their statistical analysis.
to analyse the LUC at the regional level, we used LUC disaggregated at the third level (that is, at the most detailed level possible). to create the CLC projections, we used CLC level two (primarily due to limitations of the software used for modelling using all the data for mainland Portugal). Level two was also used to compare the results obtained from the LUC datasets with different properties.
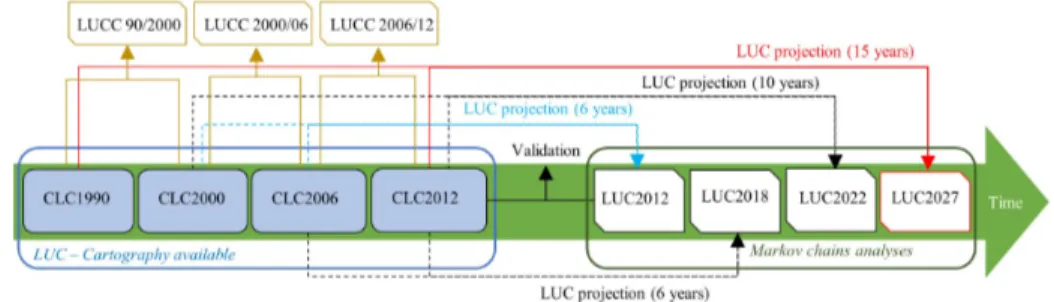
The LUCC forecasts were obtained by projecting the geoinformation (fig. 1). The
LUC projection period (tj) never exceeded twice ti due to the increased uncertainty for
more extended periods. The LUCC projection was determined using the iDrisi 17.0 Markov-Markovian transition estimator and Land Change Modeler (LCM) tools. to rea-lize the modelling using that software, it was necessary to convert all the geoinformation to rasters (pixel 25x25m).
fig. 1 – Conceptual model of LUCC and LUC projection. Colour figure available online.
Fig. 1 – Modelo concetual das alterações de uso e ocupação do solo e projeção futura. Figura a cores disponível online.
The Ca-Markov tool integrates two techniques (sayemuzzaman & Jha, 2014): Markov
chains and cellular automata. a Markov chain is a sequence of random variables x1, x2, x3, …
that possesses the Markov property, and random process X(t) is the Markov process for
any moment in time such that t1<t2<…<tn<tn+1 (Markov, 1971). according to Markov
(1971) and Memarian et al. (2012), if X[k] is a Markov chain with states {x1, x2, x3, ···}, the
probability of a transition from state i to state j in one time instant is (eq. 1).
Pi,j = Pr(X[k + 1] = j | X[k] = i) (1)
When a Markov chain has a finite number of states, i.e., n, the transition probability matrix can be obtained (eq. 2), but if the transition probabilities vary with time, the matrix needs to be explicitly written as a function of k (Memarian et al., 2012).
(2) n n n n n n P P P P P P P P P , 2 , 1 , , 2 2 , 2 1 , 2 , 1 2 , 1 1 , 1 ... ... ... ... ... ... ...
Cellular automata underline the dynamics of changing events based on the concept of proximity such that regions closer to existing areas of the same class will more proba-bly change to a different class (Memarian et al., 2012).
for the LUCC modelling using Ca-Markov, we considered constraint variables, in particular the road layer and the elevation model, assuming that they influence LUCC (Mas, Kolb, Paegelow, Olmedo, & Houet, 2014).
The results of the projection of LUC from 2000-2006 to 2012 (six years) were inte-grated into the validation process, i.e., the results were cross-compared with the CLC 2012 cartography, resulting in a transfer matrix that allowed us to calculate total accu-racy and Kappa coefficients (Congalton & Green, 2009; Jiang, Cheng, Li, Zhao, & Huang, 2014).
at the end of this paper, we will present a brief discussion of the LUC geoinformation properties, comparing the areas of major LUC classes of CLC and those of the official LUC Maps of Portugal (COs) provided by DGt. The COs map legends are compatible with those of the CLC for the first three levels (iGP, 2010).
iii. LUC Of POrtUGaL
1. Past LUC in Portugal: spatiotemporal LUCC analysis
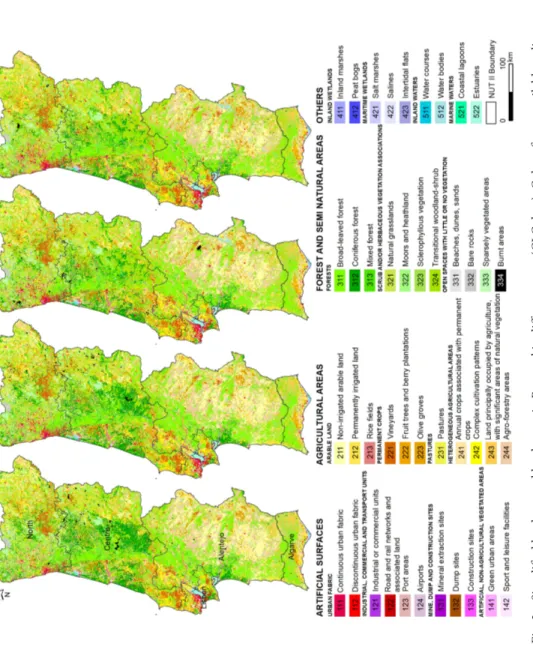
The five nUts ii units into which the territory was divided had very different areal distributions of LUC classes in the CLC mapping (fig. 2).
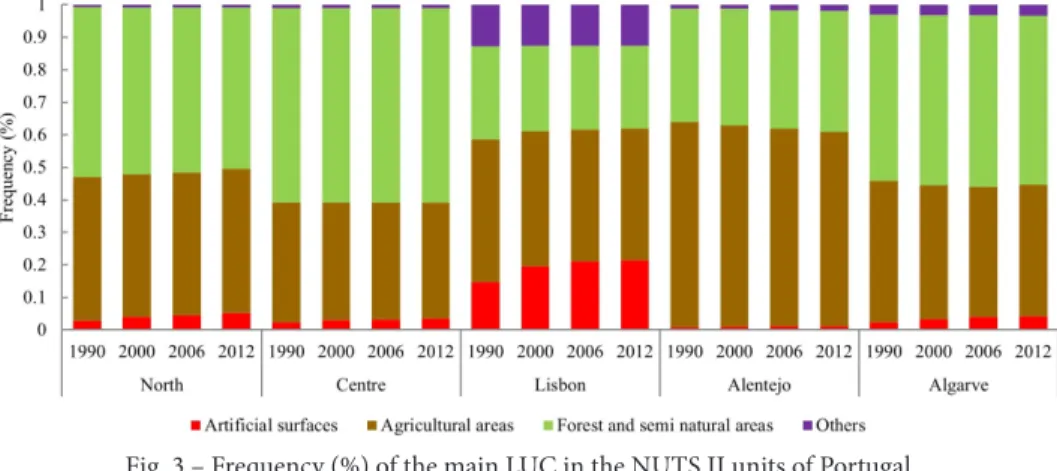
Over the period from 1990 to 2012, the artificial land increased in all nUts ii units, with emphasis on the north, which experienced the greatest increase (in absolute terms) (fig. 2). During that period, new urban areas emerged throughout the territory, especially along the coast and on the outskirts of existing major urban areas (Lisbon and Oporto). The most important of the LUCC was the increase in discontinuous urban fabric, which assumed a greater importance in the north of Portugal.
Overall, soils dedicated to agriculture have decreased, with the exception of nUts ii north, where there was a small increase (fig. 3). The decrease was due primarily to the abandonment of agricultural fields in recent decades, as soils were covered by natural vegetation, including shrublands (DGt, 2013a, 2013b).
When analysing in detail the areas for each subclass of agricultural land (fig. 4), the area of annual crops associated with permanent crops stood out in alentejo, but there was also a pronounced reduction of that type of LUC (agricultural land) (in absolute terms) in the region between 1990 and 2012. However, the reduction in area occupied with this LUC type was widespread throughout mainland Portugal, but to a lesser per-centage when compared with alentejo, where an increase in olive groves was observed between 2006 and 2012.
in contrast, the land occupied mainly by agriculture, with significant areas of natural vegetation, has increased in recent years (especially in the north), with the exception of alentejo, where agroforestry systems have predominated (LUC reduction between 1990 and 2012). The complex cultivation patterns in the Centre and north were notable due to the occupied area, but the absolute variation in this LUC was small from 1990 to 2012.
The large forest areas of mainland Portugal are located in the Centre and north (fig. 3). The areas covered in coniferous forests were most important in the Centre (fig. 4), and LUC suffered major transitions during the total period under analysis, on the one hand, due to forest fires that occurred there in past years (Meneses, 2013a) and also due to the planting of other forest species (e.g., eucalyptus trees). in the period under review, high losses were observed in the forest area in those nUts units, including Lisbon. alentejo and algarve showed slight increases in forest area, but in the case of the latter, there was also a reduction in forest area between 2006 and 2012.
fig . 2 – sim plifie d l an d u se a nd l an d co ver in P or tuga l in diff er en t y ea rs (CL C d at a). C olo ur figur e a va ila ble o nlin e. Fi g. 2 – R ep re sen ta çã o s im pl ifi ca da d o u so e o cu pa çã o d o s ol o d e P or tu ga l em d ifer en te s a no s (d ad os CL C). F ig ur a a c or es d isp on ív el o nl in e.
fig. 3 – frequency (%) of the main LUC in the nUts ii units of Portugal. Colour figure available online.
Fig. 3 – Frequência (%) das principais classes de uso e ocupação do solo em cada NUTS II (Portugal). Figura a cores disponível online.
fig. 4 – LUC area by nUts ii unit in Portugal in different years. see description CLC iD in figure 2. Colour figure available online.
Fig. 4 – Uso e ocupação do solo por NUTS II (Portugal) em diferentes anos. Ver descrição do ID CLC na figura 2. Figura a cores disponível online.
The other LUC types presented in figure 2 increased except in the Lisbon region, where a slight decrease was observed (fig. 3). This LUC includes water body class (iD 512), and the largest increase in this type of land cover was observed in the alentejo region due to the construction of the alqueva dam during the period under analysis, during which a wide area was flooded by the reservoir.
2. Relative LUCC in NUTS II
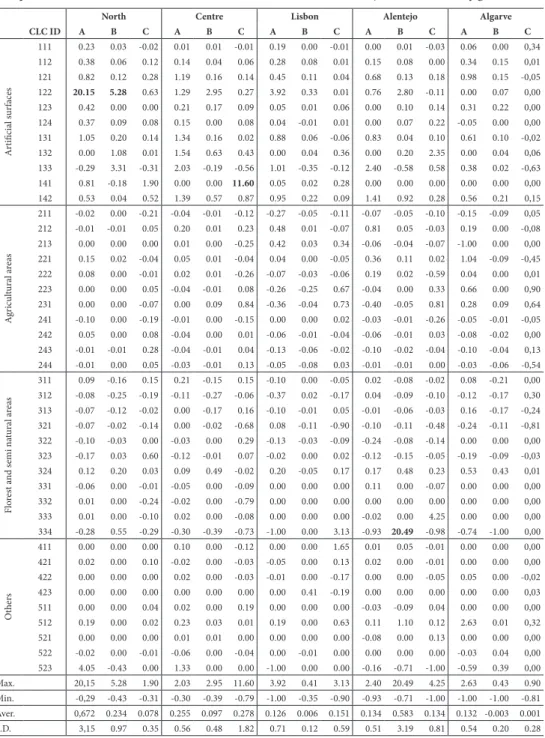
The detailed analysis of the relative LUCC per nUts ii unit (obtained using the CLC data) showed different spatial and temporal dynamics (table i).
for example, the road and rail networks and spaces associated with them experien-ced relative increases in the north and in Lisbon between 1990-2000 – reflecting, in part, the investments made in new road infrastructures (estradas de Portugal, 2015) – whereas the largest increases in this LUC type in the 2000-2006 period were observed in the Centre, alentejo and algarve.
The area of industrial or commercial units increased in every nUts unit in the first period, but the increases were more pronounced in the north, specifically during the last period. These regions showed reversals of the general trend of decreasing area occupied by this LUC type observed in the other nUts units.
The artificial surfaces showed an increase of 20.15% in discontinuous urban fabric during the first period, with a strong reduction in that growth in the following periods. in contrast, the green urban areas increased in the Centre during the most recent period (11.6%).
Changes between certain agricultural LUC types were also observed in this rese-arch, namely, between non-irrigated arable land and irrigated land. The decade of the 1990s registered an increase in permanently irrigated land, especially in alentejo, where the construction of the alqueva dam resulted in greater water availability (quan-tity) and allowed the installation of irrigation systems. This case highlights the influence of anthropogenic interventions on the territory and their contributions to high LUCC over a relatively short period.
in the forested lands, the relative changes in the classes included in this LUC type were small in most cases (<1%), with the exception of burned (iD 334) and sparsely vegetated areas (iD 333) in alentejo. The class of burned areas for the 2000-2006 period increased by approximately 20% in the same nUts unit, but in the remaining periods it decreased. Moreover, an increase in sparsely vegetated areas was seen, reflecting, in part, the natural regeneration of vegetation at sites affected by forest fires or by the abandonment of agricultural land. However, it is important to remember that the redu-ced values in relative LUCC presented in table i represent many hectares due to the areas comprised by each nUts unit. to illustrate this, the Centre region is a good example, where there was a high absolute reduction in coniferous forests (fig. 4) that did not appear in the relative analysis.
table i – relative LUCC (%) in mainland Portugal by nUts ii unit for the periods 1990-2000 (a), 2000-2006 (B) and 2006-2012 (C). see description CLC iD in figure 2.
Quadro I – Variações relativas de uso e ocupação do solo (%) em Portugal Continental, por NUTS II, nos períodos 1990-2000 (A), 2000-2006 (B) e 2006-2012 (C). Ver descrição do ID CLC na figura 2.
North Centre Lisbon Alentejo Algarve
CLC ID A B C A B C A B C A B C A B C a rt ifici al s ur faces 111 0.23 0.03 -0.02 0.01 0.01 -0.01 0.19 0.00 -0.01 0.00 0.01 -0.03 0.06 0.00 0,34 112 0.38 0.06 0.12 0.14 0.04 0.06 0.28 0.08 0.01 0.15 0.08 0.00 0.34 0.15 0,01 121 0.82 0.12 0.28 1.19 0.16 0.14 0.45 0.11 0.04 0.68 0.13 0.18 0.98 0.15 -0,05 122 20.15 5.28 0.63 1.29 2.95 0.27 3.92 0.33 0.01 0.76 2.80 -0.11 0.00 0.07 0,00 123 0.42 0.00 0.00 0.21 0.17 0.09 0.05 0.01 0.06 0.00 0.10 0.14 0.31 0.22 0,00 124 0.37 0.09 0.08 0.15 0.00 0.08 0.04 -0.01 0.01 0.00 0.07 0.22 -0.05 0.00 0,00 131 1.05 0.20 0.14 1.34 0.16 0.02 0.88 0.06 -0.06 0.83 0.04 0.10 0.61 0.10 -0,02 132 0.00 1.08 0.01 1.54 0.63 0.43 0.00 0.04 0.36 0.00 0.20 2.35 0.00 0.04 0,06 133 -0.29 3.31 -0.31 2.03 -0.19 -0.56 1.01 -0.35 -0.12 2.40 -0.58 0.58 0.38 0.02 -0,63 141 0.81 -0.18 1.90 0.00 0.00 11.60 0.05 0.02 0.28 0.00 0.00 0.00 0.00 0.00 0,00 142 0.53 0.04 0.52 1.39 0.57 0.87 0.95 0.22 0.09 1.41 0.92 0.28 0.56 0.21 0,15 a gr ic ul tura l a re as 211 -0.02 0.00 -0.21 -0.04 -0.01 -0.12 -0.27 -0.05 -0.11 -0.07 -0.05 -0.10 -0.15 -0.09 0,05 212 -0.01 -0.01 0.05 0.20 0.01 0.23 0.48 0.01 -0.07 0.81 0.05 -0.03 0.19 0.00 -0,08 213 0.00 0.00 0.00 0.01 0.00 -0.25 0.42 0.03 0.34 -0.06 -0.04 -0.07 -1.00 0.00 0,00 221 0.15 0.02 -0.04 0.05 0.01 -0.04 0.04 0.00 -0.05 0.36 0.11 0.02 1.04 -0.09 -0,45 222 0.08 0.00 -0.01 0.02 0.01 -0.26 -0.07 -0.03 -0.06 0.19 0.02 -0.59 0.04 0.00 0,01 223 0.00 0.00 0.05 -0.04 -0.01 0.08 -0.26 -0.25 0.67 -0.04 0.00 0.33 0.66 0.00 0,90 231 0.00 0.00 -0.07 0.00 0.09 0.84 -0.36 -0.04 0.73 -0.40 -0.05 0.81 0.28 0.09 0,64 241 -0.10 0.00 -0.19 -0.01 0.00 -0.15 0.00 0.00 0.02 -0.03 -0.01 -0.26 -0.05 -0.01 -0,05 242 0.05 0.00 0.08 -0.04 0.00 0.01 -0.06 -0.01 -0.04 -0.06 -0.01 0.03 -0.08 -0.02 0,00 243 -0.01 -0.01 0.28 -0.04 -0.01 0.04 -0.13 -0.06 -0.02 -0.10 -0.02 -0.04 -0.10 -0.04 0,13 244 -0.01 0.00 0.05 -0.03 -0.01 0.13 -0.05 -0.08 0.03 -0.01 -0.01 0.00 -0.03 -0.06 -0,54 flo res t a nd s emi n at ura l a re as 311 0.09 -0.16 0.15 0.21 -0.15 0.15 -0.10 0.00 -0.05 0.02 -0.08 -0.02 0.08 -0.21 0,00 312 -0.08 -0.25 -0.19 -0.11 -0.27 -0.06 -0.37 0.02 -0.17 0.04 -0.09 -0.10 -0.12 -0.17 0,30 313 -0.07 -0.12 -0.02 0.00 -0.17 0.16 -0.10 -0.01 0.05 -0.01 -0.06 -0.03 0.16 -0.17 -0,24 321 -0.07 -0.02 -0.14 0.00 -0.02 -0.68 0.08 -0.11 -0.90 -0.10 -0.11 -0.48 -0.24 -0.11 -0,81 322 -0.10 -0.03 0.00 -0.03 0.00 0.29 -0.13 -0.03 -0.09 -0.24 -0.08 -0.14 0.00 0.00 0,00 323 -0.17 0.03 0.60 -0.12 -0.01 0.07 -0.02 0.00 0.02 -0.12 -0.15 -0.05 -0.19 -0.09 -0,03 324 0.12 0.20 0.03 0.09 0.49 -0.02 0.20 -0.05 0.17 0.17 0.48 0.23 0.53 0.43 0,01 331 -0.06 0.00 -0.01 -0.05 0.00 -0.09 0.00 0.00 0.00 0.11 0.00 -0.07 0.00 0.00 0,00 332 0.01 0.00 -0.24 -0.02 0.00 -0.79 0.00 0.00 0.00 0.00 0.00 0.00 0.00 0.00 0,00 333 0.01 0.00 -0.10 0.02 0.00 -0.08 0.00 0.00 0.00 -0.02 0.00 4.25 0.00 0.00 0,00 334 -0.28 0.55 -0.29 -0.30 -0.39 -0.73 -1.00 0.00 3.13 -0.93 20.49 -0.98 -0.74 -1.00 0,00 O th ers 411 0.00 0.00 0.00 0.10 0.00 -0.12 0.00 0.00 1.65 0.01 0.05 -0.01 0.00 0.00 0,00 421 0.02 0.00 0.10 -0.02 0.00 -0.03 -0.05 0.00 0.13 0.02 0.00 -0.01 0.00 0.00 0,00 422 0.00 0.00 0.00 0.02 0.00 -0.03 -0.01 0.00 -0.17 0.00 0.00 -0.05 0.05 0.00 -0,02 423 0.00 0.00 0.00 0.00 0.00 0.00 0.00 0.41 -0.19 0.00 0.00 0.00 0.00 0.00 0,03 511 0.00 0.00 0.04 0.02 0.00 0.19 0.00 0.00 0.00 -0.03 -0.09 0.04 0.00 0.00 0,00 512 0.19 0.00 0.02 0.23 0.03 0.01 0.19 0.00 0.63 0.11 1.10 0.12 2.63 0.01 0,32 521 0.00 0.00 0.00 0.01 0.01 0.00 0.00 0.00 0.00 -0.08 0.00 0.13 0.00 0.00 0,00 522 -0.02 0.00 -0.01 -0.06 0.00 -0.04 0.00 -0.01 0.00 0.00 0.00 0.00 -0.03 0.04 0,00 523 4.05 -0.43 0.00 1.33 0.00 0.00 -1.00 0.00 0.00 -0.16 -0.71 -1.00 -0.59 0.39 0,00 Max. 20,15 5.28 1.90 2.03 2.95 11.60 3.92 0.41 3.13 2.40 20.49 4.25 2.63 0.43 0.90 Min. -0,29 -0.43 -0.31 -0.30 -0.39 -0.79 -1.00 -0.35 -0.90 -0.93 -0.71 -1.00 -1.00 -1.00 -0.81 aver. 0,672 0.234 0.078 0.255 0.097 0.278 0.126 0.006 0.151 0.134 0.583 0.134 0.132 -0.003 0.001 s.D. 3,15 0.97 0.35 0.56 0.48 1.82 0.71 0.12 0.59 0.51 3.19 0.81 0.54 0.20 0.28
3. LUC comparison between CLC and COS data
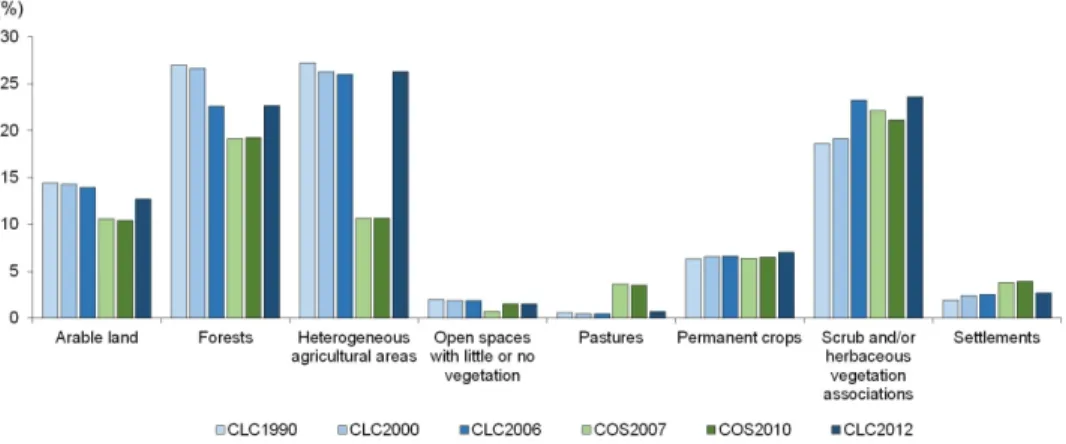
When evaluating LUCC, it is also important to analyse geoinformation properties because different properties may yield different results (nunes, 2007). for example, the integrated analysis of LUC obtained using COs aggregated data, when compared with that using CLC aggregated data (fig. 5), showed that there were large discrepancies between the total area in some LUC classes, particularly in forested and heterogeneous agricultural areas.
fig. 5 – Percentages of the areas of the main LUC classes in Portugal obtained from the CLC and COs datasets. Colour figure available online.
Fig. 5 – Percentagem de área das principais classes de uso e ocupação do solo em Portugal, segundo os dados CLC e COS. Figura a cores disponível online.
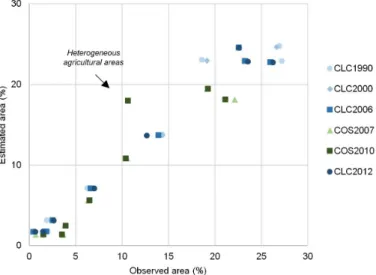
Overall, the resulting total areas in the temporal sequence presented in figure 5 for each LUC class in the CLC and COs datasets were not in agreement. in the analysis of the expected areas for each type of LUC (fig. 6), it was observed that the class “heterogeneous agricultural areas” from COs 2007 presented greater variations in relation to the obser-ved area, i.e., a 7.3% increase in area was expected.
in this case, the discrepancy between the area observed in each LUC class can be explained by differences in the geoinformation properties, i.e., the COs was more detai-led (1:25 000) in comparison with CLC (1:100 000), and the minimum mapping units also differed (1ha versus 25ha, respectively).
fig. 6 – Observed versus estimated areas of the main LUC classes in Portugal (CLC and COs datasets). Colour figure available online.
Fig. 6 – Área observada e estimada das principais classes de uso e ocupação do solo em Portugal, segundo os dados CLC e COS. Figura a cores disponível online.
iV. LUCC in POrtUGaL: Main DYnaMiCs anD fUtUre LUCC
1. Main LUCC
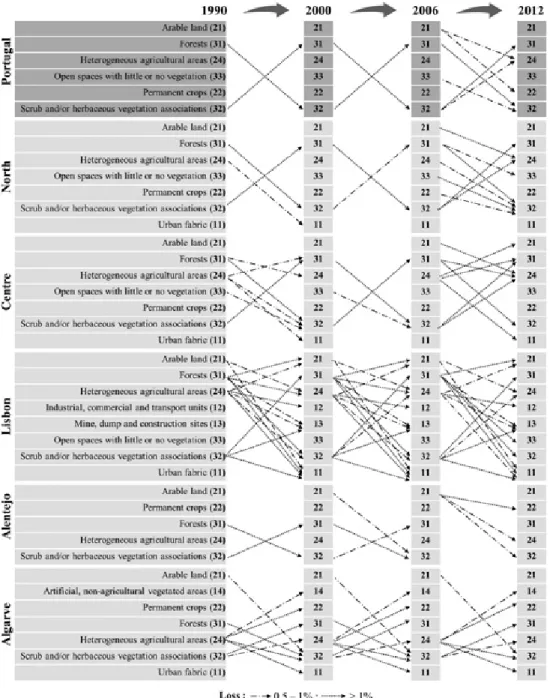
The LUC in Portugal were highly variable between the years corresponding to the avai-lable geoinformation (fig. 7), both in the transitions between the various classes and in the transition areas for each period. some LUC classes were of greater importance with respect to the transition areas between the various periods, including the transition from “scrub and/or herbaceous vegetation associations” to “forests” and the loss of “arable land” to “Permanent crops” and “Heterogeneous agricultural areas” in the period 2006-2012.
The 1990-2000 and 2000-2006 periods showed less significant variations between the different LUC classes (level ii) in relation to the other periods, with only LUC dynamics (gains and losses) in the forest and scrub classes and/or herbaceous vegetation associa-tions (changes >1% of total area, i.e., >89,258.2ha).
analysing in detail each nUts unit (fig. 7), the north and the Centre nUts units presented primary LUCC very similar to those observed in the total area (mainland Por-tugal). However, the Lisbon and algarve nUts units stood out, with greater variations in the main LUCC (>0.5% area of each nUts unit) in comparison with other classes, espe-cially the transitions to urban fabric and heterogeneous agricultural areas. in alentejo, large LUCC were observed during the two initial periods (between forests and scrub and/ or herbaceous vegetation associations), but between 2006 and 2012, the arable land tran-sitions stand out among the other classes, including the trantran-sitions to permanent crops (48,293.6ha), heterogeneous agricultural areas (17,864.4ha) and scrub and/or herbaceous vegetation associations (22,087.8ha).
fig. 7 – Main LUC dynamics in mainland Portugal (% area of the total territory) and nUts units (% area of each nUts unit).
Fig. 7 – Principais dinâmicas do uso e ocupação do solo de Portugal Continental (% de área do territorio total) e NUTS (% de área de cada NUTS).
The heterogeneous agricultural areas are those that had higher LUCC in the nUts units, both as transitions from other types of LUC (gains) and in losses of area for other LUC types.
However, this LUC class does not excel when used to analyse the LUCC in Portugal, revealing the importance of undertaking LUCC evaluations at different scales.
2. LUCC in Portugal: future trends
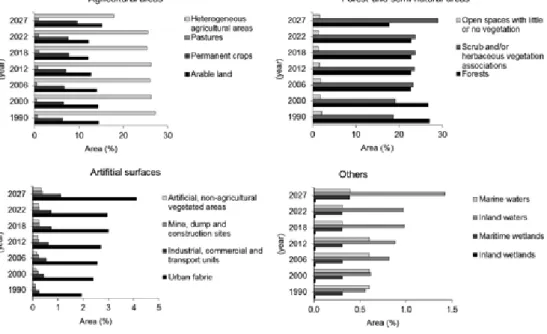
in the results obtained using Ca-Markov, it was observed that the LUCC were pre-dicted to be highly variable until 2027 in Portugal, with some LUC classes expected to greatly increase, and others were expected to greatly diminish in absolute terms (fig. 8).
fig. 8 – LUC areas in mainland Portugal in the past (CLC data, level ii) and the LUC projections to 2018, 2022 and 2027.
Fig. 8 – Uso e ocupação do solo em Portugal Continental no passado (dados CLC) e a projeção para 2018, 2022 e 2027.
in the group of agricultural classes, the most significant trend involved the heteroge-neous agricultural areas that had the largest land covers but that presented a high like-lihood to reduce until 2027. The arable land varied over the several years of the projection but maintained a balance at the end of the total projection period. The LUC classes with smaller areas tended to increase slightly.
The most important facts regarding the subclasses within the forest and semi natural areas were the increase in the scrub and/or herbaceous vegetation associations and the
reduction in the forests (mainly coniferous forests). reduced variations were seen in the open spaces with little or no vegetation.
The “others” LUC group was not very expressive when considering area. However, there was a high probability for an increase in artificial surfaces, with the most relevant fact being the increase up to double in areas of urban fabric and industrial, commercial and transport units. This LUC group showed an increase in inland waters.
3. Validation of the LUC projections
Based on the intersection between CLC 2012 and LUC2012 as a result of the projec-tions of the CLC data for 2000 and 2006, we obtained a high level of concordance between the two maps. The overall accuracy and Kappa coefficient were high: 90.3% and 87.9%, respectively.
However, there were inconsistencies between CLC 2012 and LUC projected to 2012 (approximately 10% of the total area). The largest observed discrepancies were mostly in the forests and scrub and/or herbaceous vegetation associations.
The projected forest areas presented approximately 2% less area and an increase of 4% when compared with the areas of those classes in CLC 2012. The class of scrub and/ or herbaceous vegetation associations presented the opposite situation (a reduction of 4% and an increase of 2%). from the transition matrix obtained from CLC 2012 and projec-ted LUC to 2012, it was observed that a large part of the inconsistency in the areas belon-ged to the sub-classes of these two main LUC types (forests and scrub and/or herbaceous vegetation).
V. DisCUssiOn
in this research, large LUCC were observed in the Portuguese territory, and those changes were also very different at the regional level, highlighting the existing territorial idiosyncrasies.
at a worldwide level, forests have suffered large LUCC in past decades, especially the gross reductions between 2000 and 2005 (13.5 million ha per year) (faO & JrC, 2012), and Portugal has contributed to those large losses in forests. The successive reduction of forest area in mainland Portugal is the most important fact to retain from the results of the absolute LUCC analysis, with emphasis on the coniferous forest in the Centre region. also notable are the large LUCC between sub-classes that make up the main forest class.
forests in Portugal have been decimated by the high recurrence of forest fires (Mene-ses, 2013b) and by the extent of events that have caused the loss of large forest patches (Gomes, 2006; Oliveira, Pereira, & Carreiras, 2012). forest regeneration in this territory is complex because most of the burned areas were composed of resinous trees. Given the very short recurrence times of these events, the regeneration of this type of vegetation becomes more difficult and depends on factors such as fire severity (Maia, Pausas,
Vas-ques, & Keizer, 2012), post-fire environmental conditions (Calvo et al., 2008). Most parts of the burned areas have primarily given way to scrub and/or herbaceous vegetation asso-ciations.
The reductions of conifer forest also contributed nematodes of Pinus pinaster, which have affected large extensions of the forests (autoridade florestal nacional, 2012).
However, as we highlighted from the LUC projection results, there was a predicted trend of high reductions in forest area until 2027 (approximately -10% of the total area of Portugal). These results are a consequence of the tendency of LUCC that have occurred in recent years, namely, the reduction in forested areas in the Portuguese territory. Howe-ver, these results do not consider the driving forces that led to past LUCC, which could vary if there was a way to integrate them in these projections. it should also be noted that the uncertainties associated with LUCC increase when increase the projection period.
The discrepancies observed between the projected CLC2012 and the LUC2012 can reflect natural or anthropic phenomena that have occurred in the territory, for example the interference of forest fires, as those events were not considered in the Ca-Markov modelling but have been responsible for large LUCC in this territory.
The model presents some limitations with regards to LUC projection, i.e., the trends that were derived from the input data (LUC) were considered, but integrated socioecono-mic, environment or other types of data that impact LUCC were not considered. The LUCC are spatio-temporally very dynamic, and depending on the projection period, there could be other driving forces to consider (e.g., economic assistance, the founding of communities, and new technologies) (Meneses et al., 2017) or catastrophic events (e.g., forest fires) (regos, ninyerola, Moré, & Pons, 2015). The projected LUCC obtained using only LUC could not be predicted with absolute accuracy. if the model integrated this extra information, the projected LUC might change. some limitations of this type of modelling were also referred to in Memarian et al. (2012), in particular the complex variability within the land cover categories, limitations resulting from using only two land cover maps for calibration, and the limitations caused by Ca that affect spatial but not temporal distributions.
The urban fabric and the industrial, commercial and transport units featured increa-sed probabilities, continuing the growth in the trends recorded in past years and follo-wing the tendency of increased artificial areas reported by eea (2017). However, urban sprawl is very dependent on other variables such as socio-economic factors (Carballada & Marques, 2016), the supply and demand of goods and services, and territorial manage-ment instrumanage-ments (salvati, sateriano, & Bajocco, 2013; Meneses, Vale, et al., 2014). in this research, we also observed incongruities in the results of the relative LUCC of the regions, namely, in continuous urban fabric between 2006 and 2012, which presented negative values (table i). This result (though the numbers involved were small) may reflect the different guidelines used in the creation of CLC 2012 and its associated validation, the influence of human factors when creating specific cartographic works in the same way (different photointerpretation teams), or errors in photointerpretation, because other studies using different LUC datasets have presented increasing tendencies in past decades
(Meneses, Vale, reis, & saraiva, 2013; Meneses, saraiva, et al., 2014; Vale et al., 2014; Caetano, igreja, Marcelino, & Costa, 2017).
Large LUCC was observed in agricultural land, especially in the alentejo region, where the construction of the alqueva dam resulted in the planting of new agricultural crops (extensively) and the development of other activities such as rural tourism and agritourism (roca & Leitão, 2005; Daniel, 2010; Meneses et al., 2017, 2013). This region has seen the largest increase in olive groves, essentially due to irrigation, which was only possible due to the large capacity of water released from the dam referred to earlier (DraPa, 2013). The other regions also exhibited LUCC in agricultural areas, many of which were planted with different types of crops, but there were also transitions for other LUC types (e.g., forests or urban areas). in the north, the difficulties small farms have faced when adapting to agricultural markets, low education or training, the ageing popu-lation and the lack of financial resources have led to a lack of investment and ultimately to the abandonment of this activity (amorim, 1993).
The economic crisis of recent years in Portugal also contributed to the observed LUCC, namely, to declines in urban growth and the demand for rural agricultural areas derived from the migration of the “new rural” that are part of the process of urban exodus (ribeiro, 2013), i.e., the return of some urban populations to cultivate agricultural fields which were previously abandoned or occupied by LUC types other than agriculture. However, many of these abandoned agricultural areas are also the result of emigration in rural areas that has occurred in recent years (Jacinto & ramos, 2010; ribeiro, 2013). shortages of work, poorly paid work, a lack of opportunities and other socio-economic factors have led to rural emigration and should therefore be considered as factors that have contributed to the increase in the abandonment of agricultural areas (Dayton-John-son, Pfeiffer, schuettler, & schwinn, 2009).
in past spatial LUCC analyses and projections, there were limitations because the models were not fully prepared to integrate data from the driving forces that are at the base of certain LUCC (Pang, Li, Wang, & Hu, 2010; Yu et al., 2011; Kanianska, Kizeková, nováček, & Zeman, 2014; aroengbinang, 2015). On the other hand, LUCC are not linear in time or space (Pang et al., 2010). for example, forest losses can result from seve-ral factors such as a succession of catastrophic events (e.g., forest fires in hot and dry years), increasing demand for forest materials (wood or other), or simply by conversion to artificial land resulting from an urban growth process (e.g., buildings and road networks).
The complexity of the integration of driving forces (e.g., economic, social, and politi-cal) in the determination of future LUCC has also been referred to in the Portuguese context (ribeiro, Vale, & reis, 2014). for example, the simple construction of the large alqueva dam (inaugurated in 2004) culminated in large LUCC in the alentejo region in the last decade, particularly transitions from non-irrigated to irrigated agricultural land (Meneses et al., 2017). in this case, it would not be possible to predict and spatially deter-mine the LUCC derived from the construction of the dam using only the LUC inputs from 1990 and 2000 (CLC) until 2006 (the year of the CLC cartography).
The comparisons of the total areas of the main CLC and COs classes revealed some discrepancies in area in the time series presented in figure 5. although these two types of LUC cartography were prepared with different purposes, they are frequently used in eva-luations of LUCC, but it must be realized that different results and, consequently, diffe-rent interpretations of LUCC can be obtained depending on the properties of the geoin-formation integrated into models for evaluating LUCC. Therefore, when comparing LUCC described in several studies (e.g., Pôças et al., 2011; DGt, 2014; teixeira et al., 2014; Meneses, reis, Vale, & saraiva, 2015), it must be quite clear what kind of LUC geoinformation was used in the analyses.
Vi. COnCLUsiOns
in Portugal, large LUCC have occurred in recent years, especially in forested and agricultural lands. in general, the spatio-temporal LUCC have been very diverse in this territory. some LUC classes featured high reductions in area in one period but in subse-quent periods revealed that the reductions slowed, or vice versa. On the other hand, it was observed that the LUCC were not spatially proportional. for example, whereas the Lisbon region presented strong artificial land increases, in other regions the same LUC type increased slowly (e.g., alentejo). in the case of the forests in the Centre, there were high losses, whereas alentejo presented a slight increase in forest area; in algarve, there was an increase in the initial period and a reduction in the final period.
in relative terms, the LUCC were also quite variable temporally and spatially, but this analysis has provided evidence of more specific LUCC, both in area losses and in increa-ses in area of LUC types relative to the initial situations. for example, for the relative increases observed in areas occupied by road and rail networks and associated land, industrial or commercial units and in burned areas observed in certain nUts units, the LUCC obtained was irrelevant when employing an absolute analysis. However, relative analyses of LUCC are important to understand in detail certain LUCC resulting from certain driving forces, such as the high investments in the road network in recent years.
LUC dynamics are very specific to the times used when deriving conclusions for some study areas. The 1990-2000 period was characterized by large transitions of “scrub and/or herbaceous vegetation associations” to other classes of LUC (e.g., forest), which illustrates this statement, but a similar situation was observed during 2006-2012 for other LUC classes. The case of forest land is also notable for those periods, primarily because forest lands increased due to the transition from “scrub and/or herbaceous vegetation associations”, but at the same time there was a loss of forest areas to “open spaces with little or no vegetation”. in the second period, however, the major losses and gains were essentially the results of transitions between “forests” and “scrub and/or herbaceous vege-tation associations”.
The projections of the LUC results showed a high tendency for the reduction of hete-rogeneous agricultural areas and forests and increases in open spaces with little or no
vegetation. However, modelling using Ca-Markov presented limitations in the projec-tions of LUCC because the driving forces data (e.g. socioeconomic and environmental data, policies, and others) at the base of the determined LUCC were not considered.
LUC area discrepancies were observed between the main classes of CLC and COs, highlighting the different properties of each LUC dataset. in this sense, the properties of geoinformation that integrate the models to LUCC assessments are also important because LUC datasets with different properties can lead to different results, which in turn lead to different interpretations and conclusions regarding the LUCC in the same territory. aCKnOWLeDGMents
Bruno M. Meneses was financed through a grant of the institute of Geography and spatial Planning of the University of Lisbon (instituto de Geografia e Ordenamento do território da Universidade de Lisboa, iGOt-ULisboa) (BD2015). This work was also financed by national funds through fCt-Portu-guese foundation for science and technology, i.P., under the framework of the project fOrLanD--Hydro-geomorphologic risk in Portugal: driving forces and application for land use planning (PtDC/ atPGeO/1660/2014).
referenCes
abrantes, P., fontes, i., Gomes, e., & rocha, J. (2016). Compliance of land cover changes with munici-pal land use planning: evidence from the Lisbon metropolitan region (1990-2007). Land Use
Policy, 51, 120-134.
https://doi.org/10.1016/j.lan-dusepol.2015.10.023
aburas, M. M., Ho, Y. M., ramli, M. f., & ash’aari, Z. H. (2017). improving the capability of an integrated Ca-Markov model to simulate spatio-temporal urban growth trends using an analytical Hierar-chy Process and frequency ratio. International
Journal of Applied Earth Observation and Geoin-formation, 59, 65-78. https://doi.org/10.1016/j.
jag.2017.03.006
amici, V., Marcantonio, M., La Porta, n., & rocchini, D. (2017). a multi-temporal approach in Maxent modelling: a new frontier for land use/land cover change detection. Ecological Informatics, 40(april), 40-49. https://doi.org/10.1016/j.ecoinf.2017.04.005 amorim, C. (1993). Agricultura na Região Norte: um
retrato estrutural [agriculture in the north
region: a structural portrait]. Lisboa: ine. aroengbinang, B. W. (2015). Driving force analysis of
Landuse and Cover Changes in Cimandiri and
Cibuni Watersheds. Procedia Environmental
Sciences, 24, 184-188. https://doi.org/10.1016/j.
proenv.2015.03.024
autoridade florestal nacional. (ed.). (2012). Nemátodo
da madeira do pinheiro – Atividades realizadas no âmbito do seu controlo [Pine wood nematode
– activities carried out under its control]. Lis-boa, Portugal.
Caetano, M., igreja, C., Marcelino, f., & Costa, H. (2017). Estatísticas e dinâmicas territoriais
mul-tiescala de Portugal Continental 1995 -2007--2010 com base na Carta de Uso e Ocupação do Solo (COS) [statistics and territorial dynamics
of continental Portugal 1995-2007-2010 based on the Land Use and Land Cover Map (COs)]. Lisboa.
Calvo, L., santalla, s., Valbuena, L., Marcos, e., tárrega, r., & Luis-Calabuig, e. (2008). Post-fire natural regeneration of a Pinus pinaster forest in nW spain. Plant Ecology, 197(1), 81-90. https://doi. org/10.1007/s11258-007-9362-1
Carballada, Á. M., & Marques, t. M. (2016). Urban areas in the iberian Peninsula. The delineation exercise. Geograifa, 62, 1-3.
Chen, X., Yu, s. X., & Zhang, Y. P. (2013). evaluation of spatiotemporal Dynamics of simulated Land Use/Cover in China Using a Probabilistic Cellular automata-Markov Model. Pedosphere,
23(2), 243-255.
https://doi.org/10.1016/s1002-0160(13)60013-2
Congalton, r., & Green, K. (2009). Assessing the
Accu-racy of Remotely Sensed Data: Principles and Practices. 2nd edition. CrC/taylor & francis,
Boca raton.
Daniel, a. C. M. (2010). Caracterização do sector turís-tico em Portugal [Characterization of the tou-rism sector in Portugal]. Revista de Estudos
Politécnicos, VIII(14), 255-276.
Dayton-Johnson, J., Pfeiffer, a., schuettler, K., & schwinn, J. (2009). Migration and employment. in OeCD (ed.), Promoting pro-poor growth
employment (pp. 149-177).
Direção-Geral do território. (DGt). (2013a). LANDYN
– Alterações de uso e ocupação do solo em Portu-gal Continental: caracterização, forças motrizes e cenários futuros [Land use and Land Cover
Changes in continental Portugal: characteriza-tion, driving forces and future scenarios].
Relató-rio Anual [annual report] 2012-2013. Lisboa.
Direção-Geral do território. (DGt). (2013b). LANDYN
– Alterações de uso e ocupação do solo em Portu-gal Continental: caracterização, forças motrizes e cenários futuros [Land use and Land Cover
Changes in continental Portugal: characteriza-tion, driving forces and future scenarios]. relató-rio nUts ii. [nUts ii report] Lisboa: Direção--Geral do território.
Direção-Geral do território. (DGt). (2014). Land Use
and Land Cover Evolutions in Continental Portu-gal. Work to support reporting of emissions and carbon sequestration in the sector use and land use changes. Kyoto Protocol and United nations
framework Convention on Climate Changes. Lisbon.
Direção regional de agricultura e Pescas do alentejo. (DraPa). (2013). Caracterização Agrícola do
Alentejo Central [agricultural Characterization
of Central alentejo. region]. Direção Regional de
Agricultura e Pescas do Alentejo [regional
Direc-tion of agriculture and fisheries of the alen-tejo]. Évora: Direção regional de agricultura e Pescas do alentejo. retrieved from http://www. drapal.min-agricultura.pt/drapal/images/divul-gacao/Caracterizacao_agricola_do_alentejo_ Central.pdf
Du, X., & Huang, Z. (2017). ecological and environ-mental effects of land use change in rapid urba-nization: The case of hangzhou, China. Ecological
Indicators, 81, 243-251. https://doi.org/10.1016/j.
ecolind.2017.05.040
Duckham, M., Mason, K., stell, J., & Worboys, M. (2001). a formal approach to imperfection in geographic information. Computers,
Environ-ment and Urban Systems, 25, 89-103. https://doi.
org/10.1016/s0198-9715(00)00040-5
eea. (2017). Landscapes in Transition. An account of 25
years of land cover change in Europe. eea report
| no 10/2017. Luxembourg.
estradas de Portugal. (2015). Planeamento de
Investi-mentos 2020 [investment Planning
2015--2020]. almada: estradas de Portugal.
faO, & JrC. (2012). Global forest land -use change
1990--2005. in e. J. Lindquist, r. D’annunzio, a.
Ger-rand, K. MacDicken, f. achard, r. Beuchle,… H.-J. stibig (eds.), FAO Forestry Paper No. 169. rome: food and agriculture Organization of the United nations and european Commission Joint research Centre. retrieved from http://www.fao. org/docrep/017/i3110e/i3110e.pdf
fearnside, P. M. (1995). Potential impacts of climatic change on natural forests and forestry in Brazilian amazo-nia. Forest Ecology and Management, 78(1-3), 51-70. https://doi.org/10.1016/0378-1127(95)03597-3 freire, s., santos, t., & tenedório, J. a. (2009). recent
urbanization and land use/land cover change in Portugal – the influence of coastline and coastal urban centers. Journal of Coastal Research,
2009(56), 1499-1503. retrieved from http://
www.scopus.com/inward/record.url?eid=2-s2.0-80053247672&partneriD=tZOtx3y1
Ghosh, P., Mukhopadhyay, a., Chanda, a., Mondal, P., akhand, a., Mukherjee, s… Hazra, s. (2017). application of Cellular automata and Markov--chain model in geospatial environmental mode-ling- a review. Remote Sensing Applications:
Society and Environment, 5 64-77. https://doi.
org/10.1016/j.rsase.2017.01.005
Gomes, J. f. P. (2006). forest fires in Portugal: how they happen and why they happen. International
Jour-nal of Environmental Studies, 63(2), 109-119.
https://doi.org/10.1080/00207230500435304 Hansen, M. C., stehman, s. V., & Potapov, P. V. (2010).
Quantification of global gross forest cover loss.
Proceedings of the National Academy of Sciences of the United States of America, 107(19), 8650-5.
instituto Geográfico Português. (iGP). (2010). Carta de
Uso e Ocupação do Solo de Portugal Continental para 2007 (COS2007) [Land Use and Land Cover
Map for 2007 (COs2007)]. Memória descritiva [Descriptive memory] (1st ed.). Lisboa, Portu-gal: instituto Geográfico Português / Direção Geral do território.
Jacinto, a., & ramos, P. (2010). Movimentos migrató-rios regionais do interior português: quem saiu e quem entrou? [regional migratory movements of the Portuguese interior: who left and who entered?]. Revista Portuguesa de Estudos
Regio-nais, 71-85. retrieved from http://www.apdr.pt/
siterper/numeros/rPer24/24.5.pdf
Jiang, P., Cheng, L., Li, M., Zhao, r., & Huang, Q. (2014). analysis of landscape fragmentation processes and driving forces in wetlands in arid areas: a case study of the middle reaches of the Heihe river, China. Ecological Indicators, 46, 240-252. https://doi.org/10.1016/j.ecolind.2014.06.026 Kamusoko, C., aniya, M., adi, B., & Manjoro, M.
(2009). rural sustainability under threat in Zim-babwe – simulation of future land use/cover changes in the Bindura district based on the Markov-cellular automata model. Applied
Geo-graphy, 29(3), 435-447. https://doi.org/10.1016/j.
apgeog.2008.10.002
Kanianska, r., Kizeková, M., nováček, J., & Zeman, M. (2014). Land-use and land-cover changes in rural areas during different political systems: a case study of slovakia from 1782 to 2006. Land
Use Policy, 36, 554-566. https://doi.org/10.1016/j.
landusepol.2013.09.018
Kim, i., arnhold, s., ahn, s., Le, Q. B., Kim, s. J., Park, s. J., & Koellner, t. (2017). Land use change and ecosystem services in mountai-nous watersheds: Predicting the consequences of environmental policies with cellular auto-mata and hydrological modeling.
Environmen-tal Modelling and Software. https://doi.
org/10.1016/j.envsoft.2017.06.018
König, H. J., Uthes, s., schuler, J., Zhen, L., Purusho-thaman, s., suarma, U… Wiggering, H. (2013). regional impact assessment of land use sce-narios in developing countries using the foPia approach: findings from five case stu-dies. Journal of Environmental Management,
127 Suppl, s56 – 64. https://doi.org/10.1016/j.
jenvman.2012.10.021
Li, Z., Wu, W., Liu, X., fath, B. D., sun, H., Liu, X… Cao, J. (2017). Land use/cover change and regional
climate change in an arid grassland ecosystem of inner Mongolia, China. Ecological Modelling,
353, 86-94.
https://doi.org/10.1016/j.ecolmo-del.2016.07.019
Maia, P., Pausas, J. G., Vasques, a., & Keizer, J. J. (2012). fire severity as a key factor in post-fire regenera-tion of Pinus pinaster (ait.) in Central Portugal.
Annals of Forest Science, 69(4), 489-498. https://
doi.org/10.1007/s13595-012-0203-6
Markov, a. (1971). extension of the limit theorems of probability theory to a sum of variables connec-ted in a chain. in r. Howard (ed.), Dynamic
Pro-babilistic Systems (Volume 1, pp. 552-577). John
Wiley and sons.
Mas, J. f., Kolb, M., Paegelow, M., Camacho Olmedo, M. t., & Houet, t. (2014). inductive pattern--based land use/cover change models: a com-parison of four software packages.
Environmen-tal Modelling and Software, 51, 94-111. https://
doi.org/10.1016/j.envsoft.2013.09.010
Memarian, H., Balasundram, s. K., talib, J. Bin, teh, C., sung, B., sood, a. M., & abbaspour, K. (2012). Validation of Ca-Markov for simula-tion of Land Use and Cover Change in the Lan-gat Basin, Malaysia. Journal of Geographic
Infor-mation System, 4(December), 542-554. https://
doi.org/10.4236/jgis.2012.46059
Meneses, B. M. (2013a). The impact of forest fires on soil Loss from Water erosion in serra de santa Helena. Revista Geográfica de América Central,
51, 215-232.
Meneses, B. M. (2013b). The influence of forest fire on
water quality of São Domingos stream located in the Western Region of Portugal. High
insti-tute of agronomy – Universidade de Lisboa. retrieved from https://www.repository.utl.pt/ b i t s t r e a m / 1 0 4 0 0 . 5 / 6 4 8 9 / 1 / Me n e s e s _ BM_2013_Dissertacao.pd
Meneses, B. M., reis, e., Pereira, s., Vale, M., & reis, r. (2017). Understanding Driving forces and implications associated with the Land Use and Land Cover Changes in Portugal. Sustainability,
9(3), 351. https://doi.org/10.3390/su9030351
Meneses, B. M., reis, r., Vale, M. J., & saraiva, r. (2015). Land use and land cover changes in Zêzere watershed (Portugal) – Water quality implications. Science of the Total Environment,
527-528, 439-447.
https://doi.org/10.1016/j.sci-totenv.2015.04.092
Meneses, B. M., saraiva, r., reis, r., & Vale, M. J. (2014). a importância da avaliação das transições de uso
e ocupação do solo na compreensão da evolução da paisagem [The importance of the land use and land use transitions evaluation to understanding the landscape evolution]. in r. Jacinto (ed.),
Espaços de Fronteira, Territórios de Esperança: Das Vulnerabilidades às Dinâmicas de Desenvol-vimento [Borderlands, territories of Hope: from
Vulnerabilities to Development Dynamics] (pp. 79-92). Guarda: iberografias, Centro de estudos ibéricos.
Meneses, B. M., Vale, M. J., & reis, r. (2014). Uso e ocu-pação do solo [Land Use and Land Cover]. in Direção Geral do território (ed.), Uso e
Ocupa-ção do Solo em Portugal Continental: AvaliaOcupa-ção e Cenários Futuros. Projeto LANDYN [Land Use
and Land Cover of Portugal: assessment and future scenarios. LanDYn Project] (pp. 16-52). Lisboa, Portugal: Direção-Geral do território. Meneses, B. M., Vale, M. J., reis, r., & saraiva, r. (2013).
Metodologias para a avaliação das alterações do uso e ocupação do solo em Portugal Continental nas últimas três décadas [Methodologies for the evaluation of land use and land cover changes in continental Portugal over the last three decades.].
CIDADES, Comunidades e Territórios, 27, 50-60.
Moreira, f., silva, J. P., estanque, B., Palmeirim, J. M., Lecoq, M., Pinto, M… Delgado, a. (2012). Mosaic-level inference of the impact of land cover changes in agricultural landscapes on bio-diversity: a case-study with a threatened Grass-land bird. PLoS ONE, 7(6), 1-10. https://doi. org/10.1371/journal.pone.0038876
Myint, s. W., & Wang, L. (2006). Multicriteria decision approach for land use land cover change using Markov chain analysis and a cellular automata approach. Canadian Journal of Remote Sensing,
32(6), 390-404. https://doi.org/10.5589/m06-032
nunes, a. n., de almeida, a. C., & Coelho, C. O. a. (2011). impacts of land use and cover type on runoff and soil erosion in a marginal area of Por-tugal. Applied Geography, 31(2), 687-699. https:// doi.org/10.1016/j.apgeog.2010.12.006
nunes, V. (2007). Comparação entre cartografias de
ocu-pação e ou uso do solo para a produção de um mapa de incerteza temática [Comparison
between land use and land cover cartography for a production of a thematic uncertainty map]. Lisboa: instituto superior de estatística e Gestão de informação da Universidade nova de Lisboa. nurwanda, a., Zain, a. f. M., & rustiadi, e. (2016).
analysis of Land Cover Changes and Landscape
fragmentation in Batanghari regency, Jambi Province. Procedia – Social and Behavioral
Scien-ces, 227(november 2015), 87-94. https://doi.
org/10.1016/j.sbspro.2016.06.047
Oliveira, s. L. J., Pereira, J. M. C., & Carreiras, J. M. B. (2012). fire frequency analysis in Portugal (1975-2005), using Landsat-based burnt area maps. International Journal of Wildland Fire,
21(1), 48-60. https://doi.org/10.1071/Wf10131
Pang, a., Li, C., Wang, X., & Hu, J. (2010). Land use/cover change in response to driving forces of Zoige County, China. Procedia Environmental Sciences,
2(5), 1074-1082.
https://doi.org/10.1016/j.pro-env.2010.10.119
Patz, J. a., & Olson, s. H. (2017). Land Use/Land Change and Health. International Encyclopedia
of Public Health, 2, 358-363. https://doi.org/
https://doi.org/10.1016/B978-0-12-803678-5.00246-0
Pôças, i., Cunha, M., Marcal, a. r. s., & Pereira, L. s. (2011). an evaluation of changes in a mountai-nous rural landscape of northeast Portugal using remotely sensed data. Landscape and Urban
Plan-ning, 101(3), 253-261. https://doi.org/10.1016/j.
landurbplan.2011.02.030
regos, a., ninyerola, M., Moré, G., & Pons, X. (2015). Linking land cover dynamics with driving forces in mountain landscape of the northwestern ibe-rian Peninsula. International Journal of Applied
Earth Observation and Geoinformation, 38, 1-14.
https://doi.org/10.1016/j.jag.2014.11.010 ribeiro, M., Vale, M. J., & reis, r. (2014). identificação
das principais forças motrizes: abordagem quan-titativa [identification of the main driving forces: quantitative approach]. in Direção Geral do ter-ritório (ed.), Uso e Ocupação do Solo em Portugal
Continental: Avaliação e Cenários Futuros [Land
Use and Land Cover in Continental Portugal: assessment and future scenarios]. Projeto
LAN-DYN (pp. 81-88). Lisboa: Direção-Geral do
ter-ritório. retrieved from http://www.dgterritorio. pt/static/repositor y/2015-01/2015-01- 29115800_54ab20bb-0b19-4b78-b3b7- 038c54e07421$$466C622B-84e8-4957-B11e- 25B916C851fB$$a483D82f-a1De-40D3-916e-Ce72268e2CC3$$file$$pt$$1.pdf ribeiro, P. J. (2013). Êxodo urbano, gentrificação rural e
o futuro da paisagem [Urban exodus, rural
gen-trification and the future of the landscape]. insti-tuto superior de agronomia – Universidade de Lisboa.
roca, M. n. O., & Leitão, n. (2005). População e susten-tabilidade da paisagem agrícola em Portugal: uma tipologia de concelhos [Population and sus-tainability of the agricultural landscape in Portu-gal: a typology of municipalities]. in P. Pedro--rego, & M. V. Henriques (eds.), X Colóquio
Ibérico de Geografia “A Geografia Ibérica no Con-texto Europeu” [iberian Geography Colloquium
“iberian Geography in the european Context”] (pp. 1-18). Évora, Portugal: Universidade de Évora. retrieved from http://www.apgeo.pt/ sites/default/files/actas_indice_x_cig_evora_0. pdf
salvati, L., sateriano, a., & Bajocco, s. (2013). to grow or to sprawl? Land Cover relationships in a Mediterranean City region and implications for land use management. Cities, 30(1), 113-121. https://doi.org/10.1016/j.cities.2012.01.007 sayemuzzaman, M., & Jha, M. K. (2014). Modeling of
future Land Cover Land Use Change in north Carolina Using Markov Chain and Cellular automata Model. American Journal of
Enginee-ring and Applied Sciences, 7(3), 295-306. https://
doi.org/10.3844/ajeassp.2014.295.306
schoene, D. H. f., & Bernier, P. Y. (2012). adapting forestry and forests to climate change: a chal-lenge to change the paradigm. Forest Policy and
Economics, 24, 12-19. https://doi.org/10.1016/j.
forpol.2011.04.007
serra, P., Pons, X., & saurí, D. (2008). Land-cover and land-use change in a Mediterranean landscape: a spatial analysis of driving forces integrating biophysical and human factors. Applied
Geogra-phy, 28(3), 189-209. https://doi.org/10.1016/j.
apgeog.2008.02.001
shafizadeh-Moghadam, H., & Helbich, M. (2013). spa-tiotemporal urbanization processes in the mega-city of Mumbai, india: a Markov chains-cellular automata urban growth model. Applied
Geogra-phy, 40, 140-149. https://doi.org/10.1016/j.
apgeog.2013.01.009
shi, P., Chen, J., & Pan, Y. (2000). Land use change mechanism in shenzhen City. Acta Geographica
Sinica, 67(2), 151-160.
sohl, t. L., sayler, K. L., Bouchard, M. a., reker, r. r., friesz, a. M., Bennett, s. L… Van Hofwegen, t. (2014). spatially explicit modeling of 1992-2100 land cover and forest stand age for the
contermi-nous United states. Ecological Applications,
24(5), 1015-1036.
https://doi.org/10.1890/13-1245.1
sohl, t. L., Wimberly, M. C., radeloff, V. C., Theobald, D. M., & sleeter, B. M. (2016). Divergent projec-tions of future land use in the United states ari-sing from different models and scenarios.
Ecolo-gical Modelling, 337, 281-297. https://doi.
org/10.1016/j.ecolmodel.2016.07.016
song, W., & Deng, X. (2017). Land-use/land-cover change and ecosystem service provision in China.
Science of the Total Environment, 576, 705-719.
https://doi.org/10.1016/j.scitotenv.2016.07.078 tasser, e., Leitinger, G., & tappeiner, U. (2017).
Cli-mate change versus land-use change – What affects the mountain landscapes more? Land
Use Policy, 60, 60-72. https://doi.org/10.1016/j.
landusepol.2016.10.019
teixeira, Z., teixeira, H., & Marques, J. C. (2014). syste-matic processes of land use / land cover change to identify relevant driving forces: implications on water quality. Science of the Total
Environ-ment, 471, 1320-1335.
Vale, M. J., reis, r., & Meneses, B. M. (2014). a carate-rização do uso e ocupação do solo de Portugal Continental [The characterization of land use and land cover of continental Portugal]. in DGt (ed.), Uso e Ocupação do Solo em Portugal
Conti-nental: Avaliação e Cenários Futuros [Land Use
and Land Cover in Continental Portugal: asses-sment and future scenarios]. Projeto LANDYN (pp. 1-5). Lisboa: Direção-Geral do território. Veregin, H. (1998). Data Quality Measurement and
Assessment. NCGIA Core Curriculum in GIS-cience. santa Barbara: University of California at
santa Barbara: national Centre for Geographic information and analysis. retrieved from http:// www.ncgia.ucsb.edu/giscc/units/u100/u100. html
Veregin, H., & Hargitai, P. (1995). an evaluation matrix for geographical data quality. in s. C. Guptill, & J. L. Morrison (eds.), Elements of spatial data
qua-lity (pp. 167-188). Oxford: elsevier.
Yu, W., Zang, s., Wu, C., Liu, W., & na, X. (2011). analyzing and modeling land use land cover change (LUCC) in the Daqing City, China.
Applied Geography, 31(2), 600-608. https://doi.