Private Label Branding Strategies:
The Impact on Perceived Quality and the Hedonic and
Utilitarian Dimensions of Consumer Attitudes
Hans Lucas Cesar
Dissertation written under the supervision of
Prof. Paulo Romeiro
Dissertation submitted in partial fulfilment of requirements for the MSc
in Management with Specialization in Strategic Marketing, at the
ABSTRACT
Title: “Private Label Branding Strategies: The Impact on Perceived Quality and the Hedonic
and Utilitarian Dimensions of Consumer Attitudes”
Author: Hans Lucas Cesar
Most major grocery retailers have developed multi-tier private label offerings in almost every single product category. There might be benefits to associating with some of the tiers and disassociating from others.
This study asks how consumers’ perception of quality and product attitudes are affected by branding strategies that either associate with or disassociate with the retail brand across different private label tiers. To this end, the research questions ask which quality-cues that separate a standard private label from a premium private label and, if there are any differences in perceptions of quality and product attitudes between the store-branded strategy and the stand-alone branded strategy for the two tiers.
To answer the research questions, the two private label tiers are defined based on prior research. Secondly, an online experimental survey divides respondent into two conditions: standard private label and premium private label, each with two levels: store-branding and stand-alone branding. The results show that the premium private label is perceived both higher in quality and product attitudes than the standard private label. However, there is no significant difference between store-branding and stand-alone branding for either tier.
On this basis, the paper recommends that retail managers focus on creating strong brands through investments in packaging, advertising, and ingredients regardless of the branding strategy. Further research should investigate if results apply to other product categories.
SUMÁRIO
Titulo: “Estratégias da marca própria: O impacto na perceção de qualidade e as dimensões
hedónicas e utilitárias da atitude dos consumidores.”
Autor: Hans Lucas Cesar
A maior parte dos grandes retalhistas alimentares têm desenvolvido ofertas de marca própria em praticamente todas as categorias de produtos. Poderão haver benefícios em associar a marca à algumas das gamas, e desassociar de outras.
O presente estudo tem por âmbito compreender a perceção do consumidor em relação à qualidade de um produto e atitudes que são influenciadas pelas estratégias de marca. A pesquisa relaciona-se com a investigação da perceção de qualidade que separa uma marca própria de uma premium, e se há ou não diferenças entre elas.
Primeiramente as duas gamas da marca própria foram definidas com base em investigação prévia. Um questionário experimental online dividiu os participantes do inquérito em dois cenários: um com perguntas relacionadas com a gama regular e outro sobre a gama de qualidade superior, com cada cenário a ter dois níveis: estratégia com marca visível, e estratégias sem a marca estar visível. Os resultados mostram que a marca própria de gama premium é melhor percecionada, tanto a nível de qualidade como de atitudes relativas ao produto. Contudo, não há diferenças significativas entre as estratégias com e sem marca visível, em nenhuma das gamas da marca própria.
Segundo os resultados, é recomendado que os gestores de retalho se foquem em criar marcas fortes através de investimentos em embalagens, em promoção e nos próprios ingredientes dos produtos, independentemente do tipo de estratégia de marca. Em termos de futura pesquisa, a mesma deve investigar se os resultados obtidos são aplicáveis a outras categorias de produtos.
ACKNOWLEDGMENTS
This thesis dissertation marks the end of not just my master’s degree but a 20-year journey of school. A journey that started in Lyngby, Denmark and ended in Lisbon, Portugal and which has taken me countless places on its way. I am very thankful for being granted such a privileged life with such vast amount of opportunities.
I could not have finished writing this thesis dissertation without the help and support from my family and close friends, and I want to thank all of them for helping me. Especially, I want to thank my parents for their endless support and guidance and my girlfriend, Jenna for always bringing out the best in me.
I would also like to express my gratitude to my supervisor Professor Paulo Romeiro for his guidance and patience. His feedback both helped me being on the right track and encouraged me to work hard.
the area between the brain and the soul is divided many times apart by experience-- some lose all mind and become soul: insane. some lose all soul and become mind: intellectual. some lose both and become: accepted. - Charles Bukowski, Lifedance
TABLE OF CONTENTS
ABSTRACT ... II SUMÁRIO ... III ACKNOWLEDGMENTS ... IV TABLE OF CONTENTS ... V TABLE OF FIGURES ... IX TABLE OF TABLES ... X GLOSSARY ... XI CHAPTER 1: INTRODUCTION ... 1 1.1BACKGROUND... 11.2PURPOSE STATEMENT AND RESEARCH QUESTIONS ... 4
1.3RELEVANCE ... 5
1.4RESEARCH METHODS ... 6
1.5DISSERTATION OUTLINE ... 6
CHAPTER 2: LITERATURE REVIEW ... 7
2.1CUE UTILIZATION THEORY ... 7
2.1.1 Predictive Value & Confidence Value ... 7
2.1.2 Intrinsicness & Extrinsicness ... 8
2.1.3 Price ... 8
2.1.4 Packaging ... 9
2.1.5 Advertising ... 9
2.1.6 Ingredients ... 9
2.2.1. Price ... 10
2.2.2 Packaging ... 10
2.2.3 Advertising ... 11
2.2.4 Ingredients ... 11
2.2.5 Overview of Standard PLs and Premium PLs ... 11
2.3PERCEIVED QUALITY AND PRODUCT ATTITUDES ... 12
2.3.1 Perceived Quality ... 12
2.3.2 Product Attitudes ... 12
2.4STORE-BRANDING &STAND-ALONE BRANDING ... 13
2.4.1 SB Strategy and SAB Strategy ... 13
2.5STORE IMAGE PERCEPTION AND STORE ATTITUDES ... 15
2.6HYPOTHESES ... 16 2.6.1 Hypothesis 1 ... 16 2.6.2 Hypothesis 2 ... 16 2.6.3 Hypothesis 3 ... 16 2.6.4 Hypothesis 4 ... 17 2.6.5 Hypothesis 5 ... 17 2.6.6 Hypothesis 6 ... 17 2.7CONCEPTUAL FRAMEWORK ... 18 CHAPTER 3: METHODOLOGY ... 19
3.1RESEARCH APPROACH AND SECONDARY DATA ... 19
3.2SURVEY RESEARCH DESIGN ... 20
3.2.1 Population ... 21
3.2.2 Sampling Methods ... 21
3.2.4 Data Analysis ... 26
CHAPTER 4: RESULTS AND DISCUSSION ... 27
4.1RESULTS ... 27
4.1.1 Sample Characterization ... 27
4.1.2 Reliability Analysis and Validity Analysis ... 28
4.1.3 Descriptive Statistics ... 30
4.1.4 Manipulation Check ... 31
4.1.5 Hypotheses Testing ... 31
4.1.6 Further Analysis ... 43
4.2DISCUSSION ... 46
CHAPTER 5: CONCLUSIONS AND LIMITATIONS ... 48
5.1MAIN FINDINGS &CONCLUSIONS ... 48
5.1.1 RQ1 ... 48
5.1.2 RQ2 ... 49
5.1.3 RQ3 ... 49
5.2MANAGERIAL AND ACADEMIC IMPLICATIONS ... 50
5.2.1 Managerial Implications ... 50
5.2.2 Academic Implications ... 51
5.3LIMITATIONS AND FURTHER RESEARCH ... 51
BIBLIOGRAPHY ... 53
APPENDICES ... 58
APPENDIX 1–THE SURVEY QUESTIONNAIRE ... 58
APPENDIX 2–ROTATED COMPONENT MATRIX FROM FACTOR ANALYSIS ... 67
APPENDIX 4–PERCEIVED QUALITY BY PLTYPE ... 68
APPENDIX 5–PERCEIVED QUALITY BY BRANDING TYPE ... 70
APPENDIX 6–PERCEIVED QUALITY BY PLTYPE AND BRANDING TYPE ... 71
APPENDIX 7–STORE ATTITUDES AND PRODUCT ATTITUDES ... 72
APPENDIX 8–PRODUCT ATTITUDES BY PL TYPE ... 74
APPENDIX 9-PRODUCT ATTITUDES BY BRANDING TYPE ... 76
APPENDIX 10–PRODUCT ATTITUDES BY PLTYPE AND BRANDING TYPE ... 79
TABLE OF FIGURES
Figure 1 – Conceptual Framework………18
Figure 2 – Perceived Quality and Store Image Correlation………..33
Figure 3 – Perceived Quality by PL Type……….34
Figure 4 – Perceived Quality by Branding Type………..35
Figure 5 – Perceived Quality by PL Type and Branding Type………..…………...36
Figure 6 – Product Attitudes by PL Type………...38
Figure 7 – Product Attitudes by Branding Type………...40
Figure 8 – Product Attitudes by PL Type and Branding Type……….42
TABLE OF TABLES
Table 1 – Overview of Standard PLs and Premium PLs by Cues………11
Table 2 – Survey Research Design………...20
Table 3 – Construct Measurement Overview………...25
Table 4 – Overview of the Four PL Products………...25
Table 5 – Sample Characterization by Group………...28
Table 6 – Factor Analysis Results……….29
Table 7 – Reliability Analysis………...29
Table 8 – Overview of Variables by Group………..30
Table 9 – Perceived Quality by PL Type………..33
Table 10 – Perceived Quality by Branding Type………..34
Table 11 – Perceived Quality by PL Type and Branding Type………36
Table 12 – Product Attitudes by PL Type……….38
Table 13 – Product Attitudes by Branding Type………..39
Table 14 – Product Attitudes by PL Type and Branding Type……….41
Table 15 – Results of Hypotheses Testing………42
Table 16 – Segment Characteristics………..44
Table 17 – Product Perceptions by Segment Type………...44
GLOSSARY
Private Label – PL Store-branded – SB Stand-alone-branded – SAB National Brand - NB Consumer-packaged-goods – CPG Research Question - RQ Confidence Value – CV Predictive Value – PVMultivariate Analysis of (Co)variance – MAN(C)OVA Analysis of (Co)variance – AN(C)OVA
Kaiser-Meyer-Olkin Measure – KMO Independent Variable – IV
CHAPTER 1: INTRODUCTION
1.1 Background
As the private label (PL) market share across the world continues to rise, and PL branding strategies become more complex and sophisticated, academic research on the topic of PLs has never been more critical (Ailawadi, Pauwels, & Steenkamp, 2008; Kumar & Steenkamp, 2007; Lamey, Deleersnyder, Dekimpe, & Steenkamp, 2007). In Europe, the most developed region for PL products for consumer-packaged-goods (CPG), consumers spend more than 1 out of 3 euros on PL products (Nielsen, 2014). Recent predictions have also estimated that the total PL share worldwide will reach 50% by 2025 (Nenycz-Thiel & Romaniuk, 2016).
Today, every major grocery retailer has developed a PL offering in almost every product category (Geyskens, Gielens, & Gijsbrechts, 2010). Within many of the product categories, grocery retailers are also offering multiple PL tiers that target different consumer segments (Kumar & Steenkamp, 2007). The different PL tiers are distinguished between based on the level of quality: the economy PL (i.e., value or budget) has the lowest quality-level; the standard PL (i.e., regular PL) has a mid-quality level; and the premium PL has the highest quality-level (Geyskens et al., 2010; Kumar & Steenkamp, 2007).
Historically, PL products started as being generic products of low-quality and copycat products that plagiarized innovations and features of national brands (NBs) (Kumar & Steenkamp, 2007). Today, PLs are evolving into strong, successful brands in and of themselves such as the British retailer Tesco’s “Tesco’s Finest,” or Dutch retailer Albert Heijn’s “AH Excellent” (Braak, Geyskens, & Dekimpe, 2014; Nenycz-Thiel & Romaniuk, 2016).
As the PL landscape is becoming more complex, it has become a top priority for retail managers to understand the impact of different retail branding strategies on consumers’ perceptions of PL products (Ailawadi & Keller, 2004). As an example, retailer managers must decide how closely their PL products should associate with their retail brand (Conn, 2005). Generally, retailers have two options: 1) associating with their PL products through a store-branded (SB) strategy (i.e. store brands, sub-brands, or own name brands); or 2) disassociating with their PL products through a stand-alone branded (SAB) strategy (i.e., pseudo-branding or non-endorsed branding) (Ailawadi & Keller, 2004; K. O. Keller, Dekimpe, & Geyskens, 2016; Kumar & Steenkamp, 2007). As more retailers are moving towards offering PL products in several tiers, retailers might benefit from associating with some of their PL products and disassociating from others (Conn, 2005). Whether retailers should associate with some tiers and not others is potentially dependent on the positioning of the retailer, since consumers prefer economy PLs at low-priced grocery stores and premium PLs at high-priced grocery stores (Schnittka, 2015).
Although previous research has found that an SB strategy positively associates with a retailer’s PL share, almost no research has investigated how grocery retailers’ different branding strategies affect consumers’ perceptions of the products differently (Ailawadi & Keller, 2004; S. K. Dhar & Hoch, 1997). This lack in research is a problem since the propensity for retailers to use either an SB strategy or a SAB strategy is driven primarily by decisions made in the past or what competing retailers do and not on consumer-insights (K. O. Keller et al., 2016).
Since the PL tiers differentiate between based on their quality-levels, retailers could benefit from understanding if/how consumers’ perception of quality varies depending on which branding strategy they use (Geyskens et al., 2010; K. O. Keller et al., 2016). Moreover, an extensive body of literature has emphasized the importance of increasing consumers’ perceived
quality for the success of PL products (Bao, Bao, & Sheng, 2011; Hoskins, 2016; Steenkamp, Van Heerde, & Geyskens, 2010). Increasing the perceived quality of PL products has been associated with larger market share, higher willingness to pay, more satisfaction, and increased store loyalty (Corstjens & Lal, 2000; Pauwels & Srinivasan, 2004; Richardson, Dick, & Jain, 1994; Richardson, Jain, & Dick, 1996). In fact, the most important driver for PL share is its perceived quality (Ailawadi & Keller, 2004). Thus, understanding how consumers’ perceived quality is affected by PL branding decisions should be an objective in and of itself.
Besides understanding how consumers’ perceived quality is affected by their branding decisions, retailers might also have an interest in understanding how the utilitarian and hedonic dimensions of consumers’ product attitudes (hereafter just referred to as ‘product attitudes’) are affected (Batra & Ahtola, 1991). Measuring consumers’ product attitudes on a two-dimensional scale is more comprehensive than a single-dimensional and could help explain a more significant proportion of the variance of how consumers perceive products (Voss, Spangenberg, & Grohmann, 2003).
Ultimately, this research aims to provide recommendations to European retail managers, regarding which type of PL branding strategy they should adopt for their new PL product introductions. Recommendations are based on the answer to this study’s research problem: “How do consumers’ perception of quality and product attitudes differ based on the type of PL branding strategy (store-branding and stand-alone branding) and type of PL (standard PL and premium PL), in a European context?”
1.2 Purpose Statement and Research Questions
The purpose of this dissertation is to compare the effects of store-branding and stand-alone branding on consumers’ perceived quality and product attitudes, for a standard PL tier and a premium PL tier. The purpose statement substantiates itself in the following research questions:
RQ1: Based on literature related to cue utilization theory, how do grocery retailers’ standard
PLs differ from their premium PLs?
The purpose of this RQ is two-fold: 1) to obtain a thorough understanding of the standard PL and premium PL tiers, 2) to understand the process through which consumers perceive products and make inferences about product quality.
RQ2: Are there differences on perceived quality by the type of branding (SB and SAB) and the
type of PL (standard PL and premium PL) after controlling for store image perceptions?
The purpose of this RQ is to analyze how consumers’ quality perceptions are affected by the type of PL branding strategy and by the type of PL tier while controlling for consumers’ store image perceptions. The control variable, store image perception, is chosen because of its known effect on consumers’ perception of quality (Bao et al., 2011; Collins-dodd & Lindley, 2003;
Grewal, Krishnan, Baker, & Borin, 1998). The purpose is to partial out the effect of store image
perception on perceived quality to determine if the effects strictly are due to consumers’ store image perceptions or if the differences are independent of that covariate.
RQ3: Are there differences on product attitudes (utilitarian and hedonic) by the type of
branding (SB and SAB) and the type of PL (standard PL and premium PL) after controlling for store attitudes (utilitarian and hedonic)?
The purpose of this RQ is to analyze how consumers’ product attitudes are affected by the type of PL branding strategy and by the type of PL tier while controlling for their attitude towards the store. The control variable, store attitudes, is chosen because of its known effect on consumers’ product attitudes (Corstjens & Lal, 2000; Inman, Shankar, & Ferraro, 2004; Lee &
Hyman, 2008). The purpose is to partial out the effect of store attitudes on product attitudes to
determine if the effects strictly are due to consumers’ store attitudes or if the differences are independent of that covariate.
1.3 Relevance
Academically, this dissertation addresses the topic of PL branding strategies, a very under-researched topic, which academics repeatedly have recommended for future research (Ailawadi & Keller, 2004; Geyskens et al., 2010; Nenycz-Thiel & Romaniuk, 2016). More specifically, it addresses the retailers’ branding choice between stand-alone branding and store-branding: “retailers may have an interest in adopting stand-alone branding strategies for either upscale or downscale introductions, an issue that has yet to be explored in academic studies” (Geyskens et al., 2010, p. 805). Theoretically, this research is relevant as it expands upon the research carried out within the cross-field of cue utilization theory and PLs (Richardson et al., 1994). Managerially, this research is important as the retail landscape practices are undergoing much change which requires new insights:
“PLs have changed drastically over the last decade and are making the transition to brands in their own rights. In light of this development, retailers have to decide how closely their store brands should be associated with their retail banners” (K. O. Keller et al., 2016, p. 1).
1.4 Research methods
This research uses secondary data, primarily journal articles but also some market research reports, conference proceedings as well as relevant books to answer RQ1. Moreover, this research uses primary data obtained through an online survey questionnaire to answer RQ2 and RQ3. The primary statistical analyses which are used to answer the RQs are Analysis of Covariance (ANCOVA) and Multivariate Analysis of Covariance (MANCOVA). The study’s population of interest is European grocery retail consumers.
1.5 Dissertation Outline
The following chapter reviews the literature related to the research problem and RQs. Afterward, the methodology chapter explains the rationale behind the research approach and research design. The following chapter, the results, and discussion, presents the results of the survey questionnaire and hypotheses testing and discusses them. Finally, the conclusion sums up the main findings and outlines the managerial and academic implications as well as the limitations of this research and suggestions for further research.
CHAPTER 2: LITERATURE REVIEW
This chapter presents a literature review of the topics which relate to the RQs and research topic. The first part of the literature review focuses primarily on the theory of cue utilization theory which provides a theoretical understanding of how consumers perceive and evaluate products. After a short review of the essential aspects of cue utilization theory, this chapter discusses the differences between a standard PL and a premium PL in relation to their cues. Next, this chapter presents the concepts of perceived quality and product attitudes. The following part discusses the concepts of store-branding and stand-alone branding. Finally, the literature review presents the concept of store image perception. Based on the literature review, this chapter concludes by presenting several hypotheses that the subsequent chapter tests.
2.1 Cue Utilization Theory
Cue utilization theory has often been used as a framework to assess consumers’ perception of products in marketing and consumer behavior research and to understand the quality perception process of retailers’ PL products (Bao et al., 2011; Dodds, Monroe, & Grewal, 1991; Nenycz-Thiel & Romaniuk, 2016; Olson & Jacoby, 1972; Richardson et al., 1994). According to the theory, products and brands consist of cues such as price and packaging that form the basis for consumers’ impressions of the products (Cox, 1967; Jacoby, Olson, & Haddock, 1971). The following sections outlines the main ideas from the theory and then discusses four cues that previously have been found to significantly affect consumers’ perception of quality. 2.1.1 Predictive Value & Confidence Value
Olson & Jacoby (1972), argue that any cue can be described in terms of its predictive value (PV), confidence value (CV) and whether or not the cue is intrinsic/extrinsic to the product. A cue’s PV relates to the degree to which it is associated with product quality – if the PV is high,
the cue is very indicative of product quality (Richardson et al., 1994). A cue’s CV is “the degree to which a consumer is confident in his ability to accurately perceive and judge that cue” (Olson & Jacoby, 1972). Thus, if a consumer believes, and is self-confident, in his/her ability to make accurate assessments and judgements about a cue, the CV would be high. Generally, only when cues have a high PV as well as a high CV, are they used in the quality-judgment of a product (Olson & Jacoby, 1972).
2.1.2 Intrinsicness & Extrinsicness
The distinction between intrinsicness and extrinsicness of a cue has no effect on the cue utilization process but is useful in describing the nature of the cues. Intrinsic cues include the physical composition of products and cannot be altered without changing the nature of the product itself (Zeithaml, 1988). Extrinsic cues, on the other hand, are outside the product but product-related and can for example be the price or the packaging (Zeithaml, 1988). Intrinsic cues are for most product more indicative of product quality than extrinsic cues. However, when intrinsic information is scarce, not considered to be useful, or there is not an opportunity to use it, then extrinsic cues are more likely to be used to infer the quality of a product (Olson & Jacoby, 1972; Zeithaml, 1988).
2.1.3 Price
The extrinsic cue of price and its effect on perceived quality has been studied extensively (Dodds et al., 1991; Jacoby et al., 1971; Rao & Monroe, 1989; Teas & Agarwal, 2000). The majority of the research supports that an increased price also leads to an increased perception of quality (Rao & Monroe, 1989). The logic behind the positive price-quality relationship is that through the forces of supply and demand a natural ordering of products on a price scale is created, so the products with the highest prices also are the ones with the highest quality (Rao & Monroe, 1989).
2.1.4 Packaging
Packaging characteristics have also previously been associated with higher perceptions of quality for consumers as an extrinsic cue (McDaniel & Baker, 1977; Rigaux-Bricmont, 1982; Steenkamp, 1989). By investing in the quality of the packaging design and materials used, retailers can increase the perceptions of quality for their PL products (Richardson et al., 1994, 1996). Packaging characteristics are therefore used by consumers as an indicator of product quality and plays an important role in how consumers perceive of products (Steenkamp et al., 2010).
2.1.5 Advertising
The advertisement of a product is also an extrinsic cue which is used by consumers. When a product is advertised, it signals to the consumers that the retailer believes the product is worth advertising and therefore must be of higher quality (Gotlieb & Sarel, 1992; Rao, 2005; Zeithaml, 1988). Additionally, the amount spend on the advertising of a product also positively relates to consumers’ perceptions of product quality (Kirmani & Wright, 1989; Moorthy & Zhao, 2000).
2.1.6 Ingredients
Although extrinsic cues are used more often than intrinsic cues in the context of CPG, product ingredients are still used by consumers to evaluate the quality of products they are unfamiliar with (Gielens, 2012; Richardson et al., 1994). To differentiate products, unique and high-quality ingredients or flavors that are not found elsewhere can be used to signal innovativeness and product quality (Kumar & Steenkamp, 2007).
2.2 Standard PLs and Premium PLs
This section describes and compares the main characteristics of standard PLs and premium PLs in relation to their cues. The characterization is based on the four cues from Section 2.1: price, packaging, advertising, and ingredients.
2.2.1. Price
Traditionally, standard PLs are priced between 20-50% lower than NBs, whereas premium PLs are priced similar to or even sometimes slightly higher than NBs (Ailawadi & Harlam, 2004; Dawes & Nenycz-Thiel, 2013; Kumar & Steenkamp, 2007). There are several reasons which explain why premium PLs are priced higher than standard PLs. From the retailers’ perspective, there are increased marketing and production costs of producing premium PLs due to investments in innovation and product-quality which forces the retailers to increase the prices to cover the costs (Geyskens et al., 2010; ter Braak, Dekimpe, & Geyskens, 2013). Furthermore, pricing the premium PLs higher gives the retailers the opportunity to increase revenue and profit-margins substantially (Hökelekli, Lamey, & Verboven, 2017).
2.2.2 Packaging
One of the distinct features of premium PLs is the packaging. The packaging of premium PLs is used to differentiate the products and signal to the consumers that the products are of high quality (Kumar & Steenkamp, 2007). The retailers do that by investing more in the packaging design itself as well as by investing in quality materials for the packaging (Kumar & Steenkamp, 2007). The packaging of premium PLs is usually unique and distinct, so one retailers’ premium PL range’s packaging cannot be found elsewhere (Braak et al., 2014). Standard PLs, on the other hand, imitate and often copy the packaging of the leading NB (Kumar & Steenkamp, 2007).
2.2.3 Advertising
Another distinct feature of premium PLs is that they sometimes are featured in the retailers’ advertisements and that they receive increased advertising support (Kumar & Steenkamp, 2007; Nenycz-Thiel & Romaniuk, 2016). For instance, Albert Heijn, a Dutch retailer promotes their premium PLs in their advertisements (Semeijn, Riel, & Ambrosini, 2004). Premium PLs are also sometimes receiving celebrity endorsements, such as Jamie Oliver for Sainsbury (Nenycz-Thiel & Romaniuk, 2016). Standard PLs, on the other hand, are not featured in the retailers’ advertisements (Kumar & Steenkamp, 2007).
2.2.4 Ingredients
Besides offering ingredients with quality similar to NBs’, premium PLs also tend to contain ingredients that are somewhat unique or even offer flavors that cannot be found elsewhere (Geyskens et al., 2010; Kumar & Steenkamp, 2007). Standard PLs, on the other hand, imitate and offer the same quality and ingredients as mid-quality NBs (Geyskens et al., 2010).
2.2.5 Overview of Standard PLs and Premium PLs
Based on the characterization above, standard PLs and premium PLs differ significantly in terms of their cues. Table 1 below summarizes the main features of each of the PL tiers.
Cues: Standard PLs PL Type: Premium PLs
Price 20-50% lower than NBs Similar to NBs
Packaging Imitate and copy NBs Means of differentiation, unique, good-quality materials
Advertising Not featured in advertisements Advertising support and featured in advertisements
Ingredients Imitate and offer similar quality as NBs High-quality, unique, and distinct ingredients
2.3 Perceived Quality and Product Attitudes
The following section presents the two concepts of perceived quality and product attitudes which are used in the subsequent chapter as the DVs.
2.3.1 Perceived Quality
Zeithaml (1988, p. 3) has defined perceived quality as “the consumer’s judgment about a product’s overall excellence or superiority” and stresses that perceived quality is different from objective and absolute quality. Perceived quality is, therefore, a subjective evaluation which is contingent on the individual consumer’s needs, perceptions and own goals (Steenkamp, 1989). This view on quality is widely adopted in marketing and consumer behavior research as it stresses that quality lies in the eyes of the consumers (Steenkamp, 1989). Elsewhere, perceived quality has been defined as “fitness for use” which relates more to the functional abilities based on the needs of the consumers (Steenkamp, 1989, p. 58). Generally, though, perceived quality is considered as a higher-level abstraction which can be compared across various product categories (Zeithaml, 1988).
2.3.2 Product Attitudes
Many researchers have argued that consumers’ attitudes towards products inherently are two-dimensional (Batra & Ahtola, 1991; R. Dhar & Wertenbroch, 2000; Voss et al., 2003). The first, the hedonic dimension, is derived from the sensations of the experience with the product, whereas the utilitarian dimension is derived from the functions performed by the product (Voss et al., 2003). The utilitarian dimension mostly relates to the usefulness and instrumental value of a product, whereas the hedonic dimension mostly relates to the pleasantness associated with the product purchase (Batra & Ahtola, 1991). The two dimensions both contribute to the
goodness of a product and are not mutually exclusive (Batra & Ahtola, 1991). Generally,
product categories are distinguished between based on their hedonic and utilitarian nature but brands within a product category can also vary on their hedonic and utilitarian dimensions (R.
Dhar & Wertenbroch, 2000; Okada, 2005; Voss et al., 2003). The latter point is important because previous research has suggested that brands that are highly valued on the hedonic dimension are better able to charge a higher price and can increase purchase intention of consumers (R. Dhar & Wertenbroch, 2000; Voss et al., 2003). Leclerc et al (1994) also showed this by manipulating the brand name to sounding French, consumers’ hedonic perceptions of the product increased which positively influenced their attitudes towards the product. Additionally, both retail stores and products may be described, classified, and compared on their utilitarian and hedonic dimensions (Lee & Hyman, 2008). This means that not only are consumers’ attitudes towards products two-dimensional but so are their attitudes towards retail stores (Lee & Hyman, 2008).
2.4 Store-branding & Stand-alone Branding
The following section describes and defines the two PL branding strategies of store-branding and stand-alone branding and discusses theoretical implications.
2.4.1 SB Strategy and SAB Strategy
According to Keller et al. (2016), retailers can choose between two different types of branding strategies for their PL tiers: 1) Store branding and 2) Stand-alone branding. Store branding is a strategy where the retailer clearly associates with the PL products by displaying the logo/the retailer-name on the packaging. Stand-alone branding, on the other hand, is when the retailer delinks itself from the PL, by not making its logo nor its retail-name clearly visible on the packaging but instead gives it a separate brand-name (K. O. Keller et al., 2016).
Prior Research
When introducing a new PL product, should a retailer identify with the product through a SB strategy or should it detach itself through a SAB strategy? Previous research which has
investigated this question has concluded that the use of the retailer’s own name on its PL products enhances the retailer’s performance (S. K. Dhar & Hoch, 1997). Previous research has also found that a SB strategy could lead to favorable attitudes towards a retailer’s PLs, because of familiarity with the brand image (Semeijn et al., 2004).
SB Strategy as a Brand Extension
Because retailers can be considered as brands, their PLs can also be considered as brand extensions (Bao et al., 2011; Collins-dodd & Lindley, 2003; Lee & Hyman, 2008). Brand extensions are traditionally defined as the “use of established brand names to launch new products” (Völckner & Sattler, 2006, p. 18). Therefore, only a SB strategy and not a SAB strategy is considered a true brand extension (Collins-dodd & Lindley, 2003). Brand extensions are generally considered successful when the brand equity of the parent brand is transferred to the brand extension (Bao et al., 2011; K. L. Keller & Aaker, 1990). A SB strategy can thus be perceived as an attempt for the retailer to increase the equity of the PL (Beristain & Zorrilla, 2011). Here, brand equity is considered as being evident by the
differential effect that retail brand knowledge has on consumers’ responses to the marketing of
a SB PL strategy compared with a SAB PL strategy (Ailawadi & Keller, 2004; Leclerc et al., 1994).
SB Strategy as an Extrinsic Cue
In relation to cue utilization theory, brand name has repeatedly been found to be an extrinsic cue that positively affects consumers’ perceptions (Dodds et al., 1991; Rigaux-Bricmont, 1982; Teas & Agarwal, 2000). Brand name in this research context would translate into the SB strategy since that is where the retailer displays its store brand name to signal that they are associated. Such inferences are consistent with recent literature which argue that a retailer can be considered a brand (Ailawadi & Keller, 2004; Bao et al., 2011; Beristain & Zorrilla, 2011). Naturally, SAB PLs can also develop into strong brands over time, such as the Canadian retailer,
Loblaw’s “President Choice”, but that requires substantial and consistent investments and marketing support and would not apply for new product introductions (Sayman, Hoch, & Raju, 2002).
Cue Consistency and Perceived Fit
In brand extension literature, the fit between the parent brand and the product extension, i.e.
perceived fit, is one of the most important factors for success and positive attitudes toward the
product (K. L. Keller & Aaker, 1990; Völckner & Sattler, 2006). The reason is simply that “consumers should prefer good-fitting brand extensions to bad-fitting brand extensions” (Lee & Hyman, 2008, p. 219). Similar to the concept of perceived fit, cue consistency theory holds that “multiple sources of information are more useful when they provide corroborating information than when they offer disparate conclusions” (Miyazaki, Grewal, & Goodstein, 2005, p. 147). This entails that when cues are inconsistent, it could lead to negative product perceptions (Bao et al., 2011; Miyazaki et al., 2005). For example, for a discount retailer, consumers might perceive a premium PL with a SB strategy to be more inconsistent with each other than if the same retailer carried a premium PL with a SAB strategy (K. O. Keller et al., 2016; Schnittka, 2015). Hence, SB PLs should be more successful when they support the positioning and brand of the retailer, and SAB PLs should be more successful when they fall outside of the vision, mission and general brand positioning of the retailer (Conn, 2005).
2.5 Store Image Perception and Store Attitudes
Consumers have different perceptions of retailers (Bao et al., 2011), which is often conceptualized as retailers’ store image, and defined as: “the way a store is defined in a shopper’s mind” (Levy & Weitz, 2004, p. 721). The retailers’ store image is a result of their different attributes: 1) the location and distance a consumer must travel, 2) the in-store
environment, 3) the prices & promotions 4) the breadth of products, and 5) the depth of the assortment (Ailawadi & Keller, 2004; K. L. Keller, 2008). Overall, a favorable store image is important, because it affects the perceived quality of the products sold (Teas & Agarwal, 2000). Furthermore, grocery retailers position themselves differently in the market based primarily on their pricing format (Ailawadi & Keller, 2004). Ultimately, consumers’ attitudes towards the retailers’ PL products are affected by the retailers’ positioning (Ailawadi & Keller, 2004; K. O. Keller et al., 2016).
2.6 Hypotheses
Based on the literature review, the following hypotheses, which aim to answer the RQs, are proposed.
2.6.1 Hypothesis 1
H0 – There are no differences on perceived quality by the type of PL after controlling for store
image perceptions
Ha – Consumers perceive premium PLs to be of higher quality than standard PLs
2.6.2 Hypothesis 2
H0 – There are no differences on perceived quality by the type of branding after controlling for
store image perceptions
Ha – Consumers perceive a store-branded product to be of higher quality than a stand-alone
branded product 2.6.3 Hypothesis 3
H0 – The effect of branding type on consumers’ perception of quality is the same for a standard
Ha – The effect of branding type on consumers’ perception of quality will differ for a standard
PL and a premium PL 2.6.4 Hypothesis 4
H0 – There are no differences on product attitudes by the type of PL after controlling for store
attitudes
Ha – Consumers’ product attitudes towards premium PLs are significantly different from their
attitudes towards standard PLs 2.6.5 Hypothesis 5
H0 – There are no differences on product attitudes by the type of branding after controlling for
store attitudes
Ha – Consumers’ product attitudes towards a store-branded product are significantly different
from their attitudes towards a stand-alone branded product 2.6.6 Hypothesis 6
H0 – The effect of branding type on consumers’ product attitudes is the same for a standard PL
and a premium PL after controlling for store attitudes
Ha – The effect of branding type on consumers’ product attitudes will differ for a standard PL
2.7 Conceptual Framework
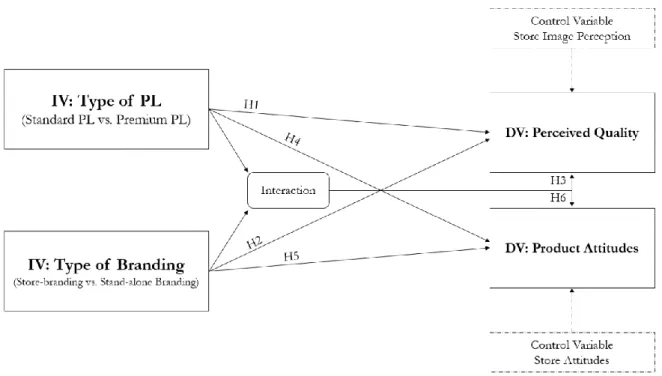
The conceptual framework below summarizes the expected relationships between the IVs and the DVs as well as the relationships between the control variables and the DVs.
Figure 1 - Conceptual Framework – The IVs Type of PL and Type of Branding are hypothesized to affect the DVs Perceived Quality and Product Attitudes. Additionally, it is hypothesized that the interaction between the two IVs affect the DVs. The study controls for the effects of store image perception and store attitudes.
CHAPTER 3: METHODOLOGY
This chapter presents the methodology which has been used to study the research problem and RQs. The first part of the chapter discusses the general approach which has been used to formulate the hypotheses and how the research applies secondary data. The second part of the chapter discusses in more detail the methodology of the survey design which includes an account of the rationale for survey research, the population characteristics, sampling methods, and operationalization of the constructs as well as a brief overview of the statistical tests used for the following hypotheses testing.
3.1 Research Approach and Secondary Data
As mentioned in Chapter 1, the purpose of this dissertation is to compare the effects of store-branding and stand-alone store-branding on consumers’ perceived quality and product attitudes for a standard PL tier and a premium PL tier. This research has used secondary data such as journal articles, market research reports, conference proceedings as well as relevant books to obtain a thorough understanding of the subject matter and to answer RQ1. The secondary sources thus provided foundational knowledge on the topic and are the basis for the development of the hypotheses and constructs.
Because the research set out to test the proposed hypotheses, it made use of a theory-testing approach as it a priori predicted what would happen in the real world and then tested it to detect statistically significant associations (De Vaus, 2002). With this approach, a postpositivist worldview is applied, which assumes that research can identify and assess the factors that influence the outcome by reducing ideas into smaller testable items (Creswell, 2009). Within this worldview, the scientific method starts with a theoretical understanding of the relationship and then collects data to either support or disprove the theory, typically through surveys and
experiments with close-ended questions and statistical procedures that include numeric data (Creswell, 2009).
Some of the central assumptions of this position are that evidence in research always is fallible, that research aims to create statements that are true, and that can describe causal relationships, and that objectivity is established by accounting for bias, i.e., reports of validity and reliability (Creswell, 2009). Therefore, the research deducted what was going to happen in the empirically observable data and analyzed the outcomes to infer implications for the theories used (De Vaus, 2002).
3.2 Survey Research Design
The research set up a statistical experimental survey design with two conditions: standard PL and premium PL, each with two levels: store-branding and stand-alone branding to test the proposed hypotheses quantitatively. The table below illustrates the 2 X 2 between-subjects factorial design. The survey randomly and even assigned the respondents to one of the four groups.
Branding Type: PL Type:
Standard PL Premium PL
Store-branded SB Standard PL SB Premium PL
Stand-alone branded SAB Standard PL SAB Premium PL
Table 2, Survey Research Design:2 X 2 Between-subjects Factorial Design, the two levels are standard PL, and Premium PL and the two conditions are store-branded and stand-alone branded.
The survey questionnaire (see Appendix 1) initiated by introducing the respondents to the survey, assuring them of the confidentiality and anonymity of the results and informing them about the approximate 2-3-minute duration. Secondly, three filter questions ensured that only respondents who were qualified to answer could participate in the survey. All respondents
answered questions regarding their self-familiarity with the chosen grocery retailer as well as questions regarding their store image perception and store attitudes. Next, the respondents saw one of the four PL products and were asked to indicate their quality-perceptions and product attitudes. In the last part of the survey, the respondents were asked to fill in demographic information about themselves. The survey was active from April 10, 2018, until April 25, 2018. The following sections detail the specifics of the survey research.
3.2.1 Population
Typically, the purpose of survey research is to generalize from a sample to a population, to make general inferences about the population of interest (Creswell, 2009; Saunders, Lewis, & Thornhill, 2008). In this research, the target population is European grocery retail consumers. The total size of the target population is difficult to narrow down but considered quite significant. In total, the survey yielded 304 recorded responses of which 236 finished the survey. Of the 236 respondents, only 187 were considered valid. The number of respondents is considered satisfactory and alike other studies with a similar research design (Grewal et al., 1998; Richardson et al., 1994; Schnittka, 2015).
3.2.2 Sampling Methods
An online-based survey questionnaire, through the survey-software Qualtrics, collected the data. It is the preferred type of data collection for this research as it enabled the collection of large amounts of data economically compared to other strategies (Saunders et al., 2008). Additionally, it had practical benefits as it enabled the collection of quantitative data in a structured way which was time-effective.
Individuals were selected based on the non-probability sample method of convenience sampling. This type of sampling method relies on respondents’ convenience and availability (Creswell, 2009). The research used this method because of the lack of sample frame, limited time and resources, and for its ability to obtain information quickly and inexpensively (Babbie,
1973). The sampling technique of convenience sampling causes severe limitations to the generalizability to the general population but can be considered reasonable when the researcher faces time constraints (Saunders et al., 2008). The results are ultimately biased and cannot be generalized to the total population (Aaker, Kumar, & Day, 1995)
3.2.3 Measurements
The following section describes the measurements for the constructs and the rationale for the design of the two IVs: PL type and branding type.
Throughout the survey, the order of the questions was randomized to prevent order bias and pictures were provided to aid the respondents.
Perceived Quality
To measure the respondents’ perceived quality, they were asked to rate four 7-point semantic differential scales, a construct developed by Bao et al. (2011) based on previous quality perception research (Grewal et al., 1998; K. L. Keller & Aaker, 1992).
Product Attitudes and Store Attitudes
The study used two identical sets of seven 7-point bipolar to measure product attitudes and store attitudes. The items were adapted from 5-point bipolar items to be consistent with the rest of the survey. The construct measure is taken from Lee & Hyman (2008) as they successfully have used the measurement for both product attitudes and store attitudes. It is an adapted version of Batra & Ahtola’s (1991) measure of hedonic and utilitarian sources of consumer attitudes. Three items represented the functional dimension, and four items represented the hedonic dimension.
Perceived Store Image
To measure the respondents’ perception of store image, they were exposed to 7 statements, developed by Bao et al. (2011). The measure originates from the perceived store image
construct by Grewal, Krishnan, Baker & Borin (1998). The items were measured on a Likert scale anchoring from 1 (“strongly disagree”) to 7 (“strongly agree”).
PL Type
Based on the characterization of standard PLs and premium PLs described in Section 2.2 and summarized in Table 1, two fictional PLs were created – the standard PL, and the premium PL. Due to limitations of this study, the study tested only one product category. The primary requirement for the product category was that other grocery retailers successfully had created both a standard PL and a premium PL within this product category. Additionally, it was a requirement for the product category that it had one well-known brand that the PLs could be compared against. By having one product that respondents could compare against, they were all anchored by the same product and had similar anchoring bias. The product category that met the two criteria was mayonnaise. The leading mayonnaise brand in Europe is Hellmann’s1,
which is owned by Unilever. In designing the products, three retailers with successful standard PLs and premium PL were considered: Sainsbury’s; Tesco; and Albert Heijn.
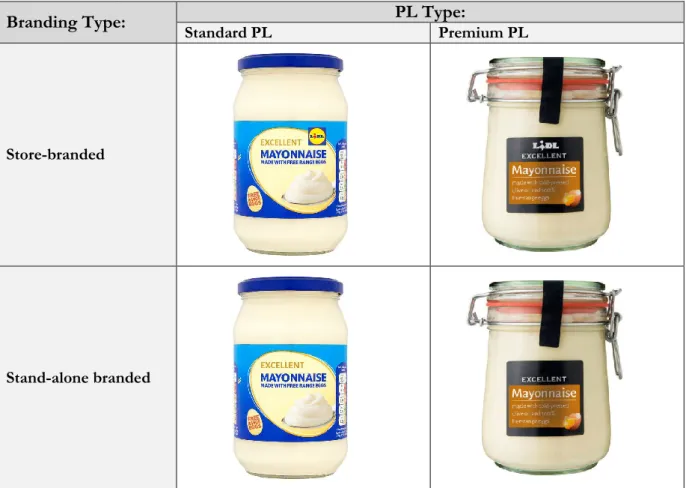
The price of the standard PL was set to €2 which was 35% lower than the €3 of the leading NB, Hellmann’s. Tesco’s standard-tier mayonnaise inspired the design of the packaging of the standard PL. This packaging design was chosen because it resembled the category-leader Hellman’s packaging.
The price of the premium PL was set to €3, matching the leading NB, Hellmann’s. Albert Heijn’s premium-tier mayonnaise inspired the packaging of the premium PL because it was the one considered to be the most unique and premium-looking of the three premium-tiers. The label on the packaging additionally wrote: “cold-pressed olive oil” to add a ‘unique’ ingredient
1https://www.statista.com/statistics/301878/leading-salad-cream-and-mayonnaise-brands-in-the-uk/ - based on
to the premium PL. The study also provided information for the respondents who saw the premium PL, that the retailer was advertising the product.
Both the standard PL and premium PL said they were made with 100% free range eggs on the labelling of the packages as that appeared to be an industry standard. To make sure respondents perceived the packaging as intended, they were asked to indicate their level of agreement on a 7-point Likert scale to the following two statements: “The packaging of the product is unique” and “I consider the packaging to be premium.” Colors and fonts were adjusted to fit the packaging.
Branding Type
Due to inherent limitations, this study only tested one grocery retailer. The main criteria for the retailer was that it was well-known across Europe. Based on Interbrand’s categorization of the best retail brands in Europe, the German retailer Lidl was picked as it was the grocery retailer with one of the highest brand equities and one of the most widely spread in Europe (Interbrand, 2014). The method of using Interbrand’s classification to determine if it is one of the most well-known retailers is commonly used (K. O. Keller et al., 2016).
The store-branded PLs displayed the Lidl logo next to a made-up brand-name “Excellent”. The stand-alone branded PLs only displayed the made-up brand-name “Excellent” (see Table 4).
Overview
The table below summarizes the measurements:
Construct Scale # of Items Source
Perceived Quality 7-Point Semantic Differential Scale 4 (Bao et al., 2011)
Product and Store
Attitudes 7-Point Semantic Differential Scale 7 (x2) (Lee & Hyman, 2008)
Perceived Store
Image 7-Point Likert Scale 7 (Bao et al., 2011)
Table 3 – Construct Measurement Overview – the measurements of the four constructs: perceived quality, product attitudes, store attitudes, as well as perceived store image
The table below shows the four PL products:
Branding Type: Standard PL PL Type:Premium PL
Store-branded
Stand-alone branded
3.2.4 Data Analysis
All quantitative data was analyzed with the statistical software SPSS. Before the hypothesis testing, the raw data was prepared for the data analysis by checking for obvious lack of cooperation (Aaker et al., 1995). Some variables were re-specified and transformed to prepare the variables for the hypothesis testing. All constructs were subject to reliability analysis of Cronbach Alpha, and the constructs of store attitudes and product attitudes were subject to a validity analysis through Factor Analysis. The following section reports frequency distributions and descriptive statistics of the data. Multiple statistical tests were carried out to test the hypotheses but the primary statistical tests to answer the RQs were ANCOVA and MANCOVA.
CHAPTER 4: RESULTS AND DISCUSSION
The following chapter presents the results of the survey and discusses the results. The first section presents a characterization of the sample, followed by descriptions of the reliability and validity analyses as well as an overview of the variables that were used in the hypotheses testing. The last part presents and discusses the results of the hypotheses testing.
4.1 Results
This section describes the sample, reliability and validity analyses, descriptive statistics, and the results of the hypotheses testing.
4.1.1 Sample Characterization
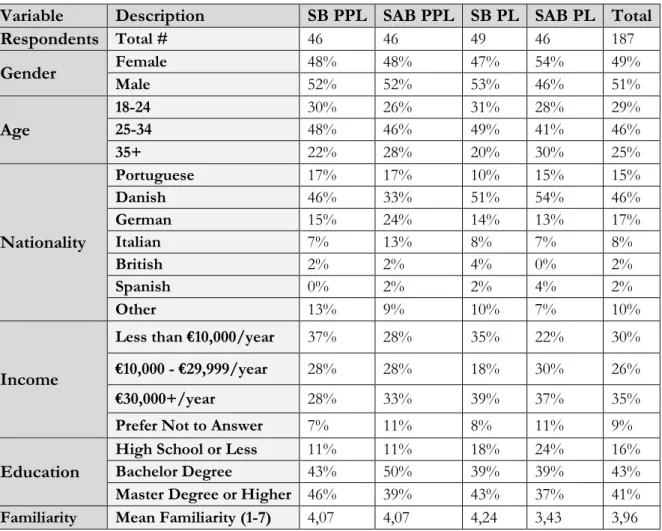
From a total of 236 respondents, 12 were excluded from participating in the survey because they had never lived in a European country. Additionally, five respondents were excluded because they answered that they did not do grocery shopping minimum once per month, and 32 respondents because they had never purchased mayonnaise. The table below presents the characteristics of the 187 valid respondents. The sample is grouped into fewer groups for age, income, and education. There is almost an equal distribution of respondents in each group for each of the demographic variables, making the groups homogenous. Because of the non-probability sampling, most respondents were Danish, between 25-34 years and relatively well-educated. “SB PPL” indicates the store-branded premium PL, “SAB PPL” indicates the stand-alone branded premium PL, “SB PL” indicates the store-branded standard PL, and “SAB PL” indicates the stand-alone branded standard PL.
Variable Description SB PPL SAB PPL SB PL SAB PL Total Respondents Total # 46 46 49 46 187 Gender Female 48% 48% 47% 54% 49% Male 52% 52% 53% 46% 51% Age 18-24 30% 26% 31% 28% 29% 25-34 48% 46% 49% 41% 46% 35+ 22% 28% 20% 30% 25% Nationality Portuguese 17% 17% 10% 15% 15% Danish 46% 33% 51% 54% 46% German 15% 24% 14% 13% 17% Italian 7% 13% 8% 7% 8% British 2% 2% 4% 0% 2% Spanish 0% 2% 2% 4% 2% Other 13% 9% 10% 7% 10% Income
Less than €10,000/year 37% 28% 35% 22% 30%
€10,000 - €29,999/year 28% 28% 18% 30% 26%
€30,000+/year 28% 33% 39% 37% 35%
Prefer Not to Answer 7% 11% 8% 11% 9%
Education
High School or Less 11% 11% 18% 24% 16%
Bachelor Degree 43% 50% 39% 39% 43%
Master Degree or Higher 46% 39% 43% 37% 41%
Familiarity Mean Familiarity (1-7) 4,07 4,07 4,24 3,43 3,96
Table 5 – Sample Characterization by Group
4.1.2 Reliability Analysis and Validity Analysis
Because consumers’ attitudes towards products and stores by nature are two-dimensional, the research initiated by carrying out a factor analysis of the measures of store attitudes and product attitudes for each of the groups (Batra & Ahtola, 1991). The purpose of the factor analysis was to validate with a principal component analysis (varimax rotation) and two fixed factors extracted, that each of the items would load on their corresponding factor (Aaker et al., 1995). In other words, that all hedonic items loaded on one factor and all utilitarian items loaded on another separate factor. This validation measure is similar to the methods of Lee & Hyman (2008) and can validate that the items measure what they are supposed to (Aaker et al., 1995). The table below shows the main results and the rotated component matrixes, presented in Appendix 2, show that all the items loaded on their corresponding factor. In all cases, Bartlett’s
Test of Sphericity was significant at p <0,001, Kaiser-Meyer-Olkin Measure (KMO) was above 0,8 (Malhotra & Birks, 2003).
Variable
Description KMO Bartlett's Test, Sig. Total Variance Explained Loaded Items Right
Store Attitudes 0,89 0,000 82,89% Yes
SB PPL Attitudes 0,80 0,000 76,26% Yes
SAB PPL Attitudes 0,87 0,000 83,29% Yes
SB PL Attitudes 0,83 0,000 79,57% Yes
SAB PL Attitudes 0,87 0,000 84,75% Yes
Table 6 – Factor Analysis Results – all hedonic items loaded on one factor and all utilitarian items loaded on a separate factor
Several analyses of internal consistency reliability were carried out to establish the reliability of the constructs. Below, the Cronbach alpha of all the constructs, split by the group, are reported. The constructs’ internal consistency reliability is considered satisfactory when the Cronbach alpha coefficient is > 0,6, good when > 0,8, and excellent when > 0,9 (Gliem & Gliem, 2003; Malhotra & Birks, 2003). The results in the table below show that all the constructs have good internal reliability, and most have excellent.
Variable Description # of Items Cronbach's Alpha
Store Image (All) 7 0,90
Store Attitude (Utilitarian) (All) 3 0,91
Store Attitude (Hedonic) (All) 4 0,92
SB PPL - Perceived Quality 4 0,90
SB PPL - Attitude (Utilitarian) 3 0,82
SB PPL - Attitude (Hedonic) 4 0,90
SAB PPL - Perceived Quality 4 0,93
SAB PPL - Attitude (Utilitarian) 3 0,89
SAB PPL - Attitude (Hedonic) 4 0,94
SB PL - Perceived Quality 4 0,86
SB PL - Attitude (Utilitarian) 3 0,85
SB PL - Attitude (Hedonic) 4 0,91
SAB PL - Perceived Quality 4 0,92
SAB PL - Attitude (Utilitarian) 3 0,93
SAB PL - Attitude (Hedonic) 4 0,92
4.1.3 Descriptive Statistics
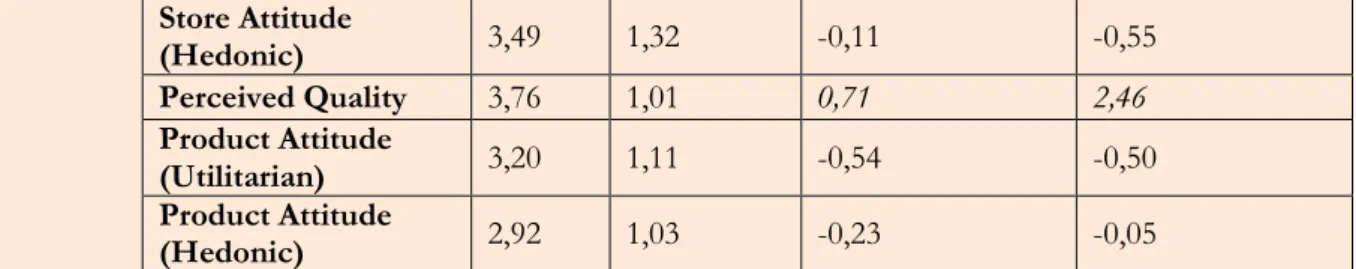
The table below summarizes the data split by the groups. Three variables have skewness values higher than two standard errors of skewness (± 0,68 - 0,7) and are considered significantly skewed (Brown, 1997). One variable has a kurtosis value higher than two standard errors of kurtosis (1,38) and is considered to differ from mesokurtic to a significant degree (Brown, 1997). The skewness and kurtosis values imply that there is not a normal distribution for all measurements which might cause implications for the hypotheses testing.
Group Variable Description Mean Std. Deviation Skewness Kurtosis
SB PPL N = 46 Store Image 4,04 1,14 0,14 -0,69 Store Attitude (Utilitarian) 4,51 1,37 -0,25 -0,36 Store Attitude (Hedonic) 3,37 1,24 0,40 -0,19 Perceived Quality 5,07 1,05 -0,09 -0,57 Product Attitude (Utilitarian) 4,07 1,06 -0,01 0,81 Product Attitude (Hedonic) 4,63 1,10 -0,27 -0,43 SAB PPL N =46 Store Image 4,12 1,03 -0,37 0,18 Store Attitude (Utilitarian) 4,46 1,30 -0,55 -0,49 Store Attitude (Hedonic) 3,74 1,31 -0,07 -0,36 Perceived Quality 5,04 1,21 -0,74 -0,19 Product Attitude (Utilitarian) 3,85 1,30 -0,24 -0,97 Product Attitude (Hedonic) 4,80 1,29 -1,09 1,02 SB PL N = 49 Store Image 3,93 1,16 0,27 -0,51 Store Attitude (Utilitarian) 4,17 1,22 -0,26 -0,48 Store Attitude (Hedonic) 3,55 1,28 0,16 -0,76 Perceived Quality 3,88 0,96 -0,06 -0,19 Product Attitude (Utilitarian) 3,50 1,14 0,28 -0,97 Product Attitude (Hedonic) 3,21 1,18 0,38 -0,41 SAB PL N =46 Store Image 3,93 1,01 0,07 -0,10 Store Attitude (Utilitarian) 3,89 1,45 -0,31 -0,69
Store Attitude (Hedonic) 3,49 1,32 -0,11 -0,55 Perceived Quality 3,76 1,01 0,71 2,46 Product Attitude (Utilitarian) 3,20 1,11 -0,54 -0,50 Product Attitude (Hedonic) 2,92 1,03 -0,23 -0,05
Table 8 – Overview of Variables by Group – almost all variables are considered normally distributed
4.1.4 Manipulation Check
Before the hypotheses testing, a manipulation check verified that the packaging of the premium PL was perceived significantly different than the packaging of the standard PL. The respondents were asked to indicate their level of agreement with the statements: “The packaging of the product is unique,” and “I consider the packaging to be premium.” These two questions were picked because the level of uniqueness and level of premium-perception are the two characteristics that separate the packaging of standard PLs from premium PLs (Kumar & Steenkamp, 2007).
Two independent samples t-test were conducted to compare the respondents’ agreement with the statements above for the premium PL and the standard PL. The results show that there is a significant difference in the scores for the premium PL (M=4,82, SD=1,54) and the standard PL (M=2,53, SD=1,00) conditions; t(185)= -12,17, p = 0,000 for the statement “The packaging of the product is unique”. Additionally, there is a significant difference in the scores for the premium PL (M=5,03, SD=1,49) and the standard PL (M=2,68, SD=1,18) conditions; t(173)= -11,95, p = 0,000 for the statement “I consider the packaging to be premium”. The results suggest that the manipulation was successful and that the packaging of the premium PL was considered both more unique and premium than the packaging of the standard PL.
4.1.5 Hypotheses Testing
The following section tests the proposed hypotheses. First, the research examines the relationship between store image and perceived quality to make sure it is appropriate to include
store image as a covariate. Secondly, to see if there are differences in the means of the IVs: PL type and branding type on perceived quality, two independent samples t-test were run. Third, a 2-way ANCOVA was conducted with PL type and branding type as IVs and perceived quality as DV as well as store image as a covariate. Based on the results of the tests, H1, H2, and H3 are either accepted or rejected.
Afterward, multiple regressions tested the relationship between store attitudes and product attitudes to make sure it was appropriate to include store attitudes as a covariate. Then, to see if there were differences in the means of the IVs: PL type and branding type on product attitudes, two one-way MANOVAs were run. Finally, the section concludes with a 2-way MANCOVA with PL type and branding type as IVs and product attitudes as DVs, as well as store attitudes as a covariate. Based on the results of the tests, H4, H5, and H6 are either accepted or rejected.
Store Image and Perceived Quality
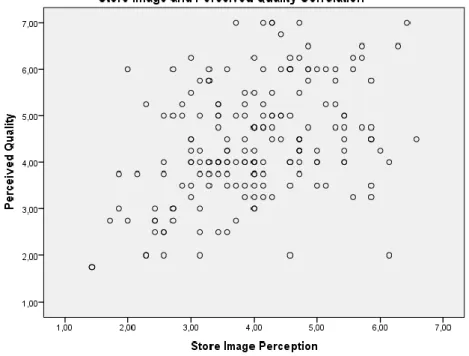
A Pearson’s r examined the relationship between store image and perceived quality to evaluate the appropriateness of using store image as a covariate (see Appendix 3). It is an appropriate statistical test to assess the relationship between two metric variables (Malhotra & Birks, 2003). The results show that there is a positive correlation between the two variables [r = 0,389, n = 187, p = 0,000]. The scatterplot below summarizes the results. Overall, there is a moderate, positive correlation between store image and perceived quality. Increases in store image correlate with increases in perceived quality. The results suggest that store image explains variation in the DV and that the study can include store image as a covariate.
Perceived Quality by PL Type
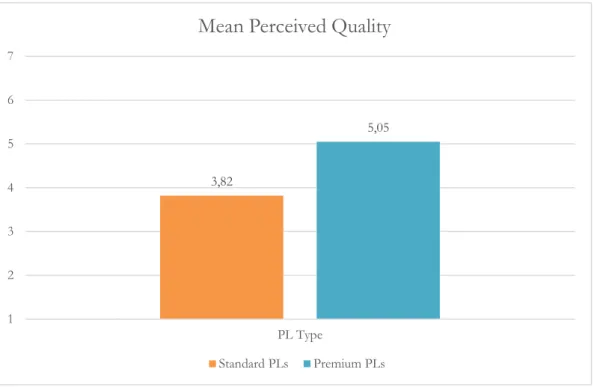
To examine if there were differences in the mean of the IV: PL type, an independent samples t-test compared perceived quality for the PL types (see Appendix 4). It is the appropriate statistical test to assess if differences exist on a continuous DV by a dichotomous IV (Malhotra & Birks, 2003). The results show that there is a significant difference in the scores for the premium PL (M=5,05, SD=1,13) and the standard PL (M=3,82, SD=0,98) conditions; t(185)= -7,99, p = 0,000. These results suggest that the premium PL is perceived higher in quality than the standard PL. The table and figure below summarize the results
Perceived Quality by PL Type
DV PL Type N Mean Std. Deviation
Perceived Quality Standard PLs 95 3,82 0,98
Premium PLs 92 5,05 1,13
Notes: Tests for Assumptions in Appendix 4.
Table 9 – Perceived Quality by PL Type
Figure 2 - Store Image and Perceived Quality Correlation – there is a significant and moderate correlation between the two variables
Figure 3 - Perceived Quality by PL Type - Premium PL is significantly higher than standard PL
Perceived Quality by Branding Type
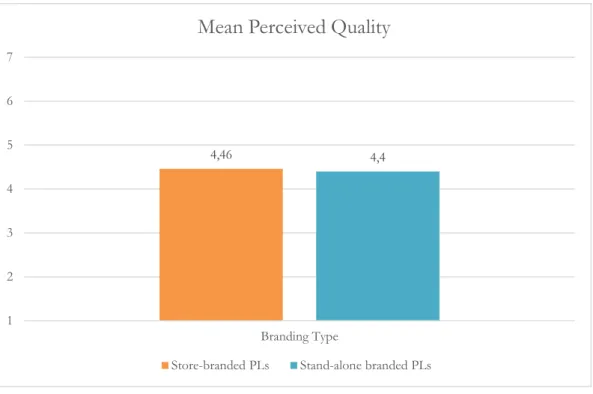
To examine if there are differences in the mean of the IV: branding type, an independent samples t-test compared perceived quality by branding type (see Appendix 5). The results show that there is no significant difference in the scores between store-branding (M=4,46, SD=1,16) and stand-alone branding (M=4,40, SD=1,28) conditions; t(185)= -0,297, p = 0,769. These results suggest that store-branding is not perceived higher in quality than stand-alone branding. The table and figure below summarize the results.
Perceived Quality by Branding Type
DV Branding Type N Mean Std. Deviation
Perceived Quality Store-branded PL 95 4,46 1,16 Stand-alone branded PL 92 4,40 1,28 Notes: Tests for Assumptions in Appendix 5.
Table 10 – Perceived Quality by Branding Type
3,82 5,05 1 2 3 4 5 6 7 PL Type
Mean Perceived Quality
Figure 4 – Mean Perceived Quality by Branding Type – there is no significant difference between the two branding strategies
Perceived Quality by PL Type and Branding Type
A 2-way factorial ANCOVA examined the effect of PL type and branding type on perceived quality while controlling for the effect of store image perception (see Appendix 6). The purpose of the test was to verify the results of the previous tests by statistically controlling for the effects of store image perceptions as well as checking to see if there were an interaction effect between the two IV variables. ANCOVA is an appropriate test for examining means between groups while controlling for the effect of a covariate (Malhotra & Birks, 2003). The design produced two main effects, one for PL type and one for branding type, as well as an interaction effect between the two.
The results show that there is an insignificant interaction between the effects of PL type and branding type, F (1, 182) = 0,048, p = 0,827 and an insignificant main effect of branding type,
F (1, 182) = 0,371, p = 0,543. However, the results show that there is a significant main effect
of PL type, F (1, 182) = 67,84, p = 0,000. The covariate store image is also significant, F (1,
4,46 4,4 1 2 3 4 5 6 7 Branding Type
Mean Perceived Quality
182) = 36,95, p = 0,000. An ANOVA was conducted afterward for result verification purposes and show similar results (see Appendix 6).
The results suggest that there are differences in perceptions of quality for consumers across the type of PL but not across the type of branding when controlling for store image perception. It appears that store-branding does not influence the respondents’ perceived quality any differently than stand-alone branding does for either of the PL types. The group means along with the adjusted mean are summarized in the table and figure below.
Perceived Quality by PL Type and Branding Type
PL Type Branding Type N Mean Adj. Mean* Std. Deviation
Standard PL SAB 46 3,76 3,79 1,01
SB 49 3,88 3,91 0,96
Premium PL SAB 46 5,04 5,00 1,21
SB 46 5,06 5,05 1,05
Notes: Tests for Assumptions in Appendix 6 * Covariate evaluated at: store image = 4,00
Table 11 – Perceived Quality by PL type and Branding Type
Figure 5 - Adj. Mean Perceived Quality by PL Type and Branding Type, *Covariate evaluated at store image = 4,00
3,79 3,91 5 5,05 3 3,5 4 4,5 5 5,5 SAB SB SAB SB Standard PL Premium PL