Redefining the Organization of the Public Water Supply Sector
Ana Cristina Veloso Gonçalves 881
A Project carried out on the CEMS MIM Business Project, under the supervision of: Constança Casquinho
Abstract
Redefining the Organization of the Public Water Supply Sector
Balancing affordable prices for consumers with operators’ financial sustainability is the primary regulatory pillar of the water supply sector. Because many retailers in Portugal remain municipality-managed, there may be political incentives to understate costs, thus sustaining lower tariffs. Therefore, it becomes imperative for the regulator to optimize the tariff-setting procedure. The project encompassed three main steps: grouping comparable operators; selecting the best practice within each group; and developing a financial model to be used as the starting point for decision-making. Finally, recent developments in the industry are noteworthy, as private investors are increasingly interested in infrastructure, providing there is an enabling regulatory environment and innovative atmosphere.
Keywords: Water supply, wastewater management, benchmarking, cost analysis,
Table of Contents
1 Context ... 4
1.1 Client ... 4
1.2 Market Overview of Water Supply and Wastewater Management ... 4
1.3 Current Client Situation ... 6
1.4 The Business Project Challenge ... 6
2 Reflection on the work done ... 8
2.1 Problem Definition ... 8
2.2 Methodology ... 8
2.3 Recommendations to the Company ... 19
2.4 Limitations ... 20
2.5 Individual Contribution ... 20
3 Academic discussion ... 22
3.1 Private and Public Goods ... 22
3.2 From Public to Private Funding in Infrastructure ... 22
3.3 Investment Rationale and Empirical Studies ... 23
3.4 Implications for the Future of Water Infrastructure ... 25
4 Personal reflection ... 27
4.1 Strengths & Weaknesses ... 27
4.2 Plan to develop your areas of improvement ... 28
4.3 What added most value? What should have been done differently? ... 28
Bibliography ... 29
1
Context
1.1 Client
Entidade Reguladora dos Serviços de Águas e Resíduos (ERSAR) is the Portuguese
regulator for water and waste services, which include (a) drinking water supply, (b) wastewater management and (c) solid waste management. It is a public entity with financial and administrative autonomy, under the supervision of the Ministry of Environment and Urban Planning.
These services are vital for public health and economic growth but the high fixed costs associated with the complex infrastructure constitute natural monopolies. Monopolists have weakened incentives towards efficiency and often disregard consumer needs, therefore there is need for regulation. Accordingly, ERSAR’s most important role pertains economic regulation: to assure affordable prices for consumers while securing operators’ financial sustainability. The second most important pillar concerns service and water quality.
1.2 Market Overview of Water Supply and Wastewater Management
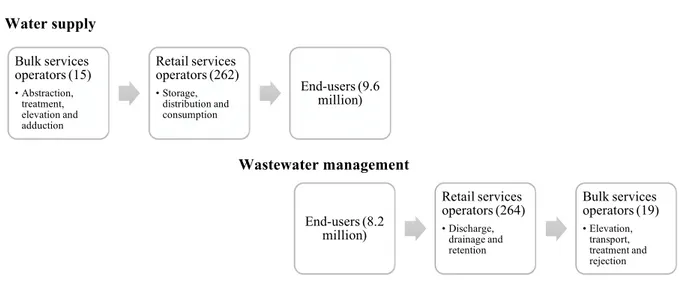
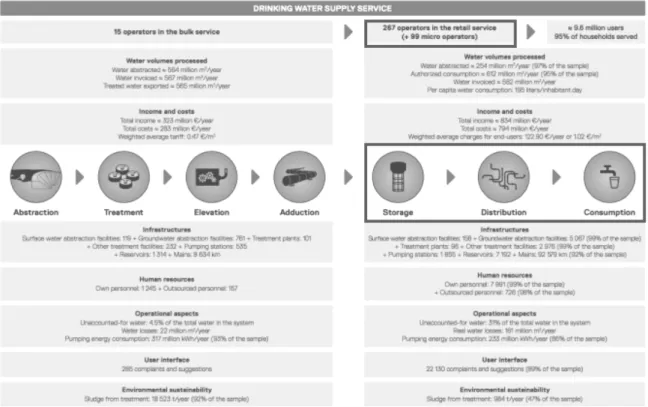
The drinking water supply service encompasses a process of seven steps: abstraction, treatment, elevation, adduction, storage, distribution and consumption. The first four steps are under the bulk operators’ umbrella (15 operators, in total), while the last three are performed by retail operators (262 operators, in total). Most retail operators purchase the water needed from external bulk operators but some have activities in both businesses, in which case they are vertically-integrated. Approximately 9.6 million end-users are served (ERSAR, 2015).
After being used, the wastewater needs to be managed through the following process: discharge, drainage, retention, elevation, transport, treatment and rejection. Around 8.2 million end-users have drainage services, and the first three steps are performed by retail operators (264 operators). These are not necessarily the same as those who supplied the water, as the two services can be provided separately.
Water supply
Wastewater management
Figure 1 - Players and process of drinking water supply and wastewater management services
In Portugal, the State is responsible for the bulk services (often multi-municipal) while municipalities are responsible for the retail services. The management can then be performed by the municipalities themselves (direct management) or delegated to other public or private entities (delegation), and can aggregate more than one municipality. SIMAS Oeiras e Amadora is an example of a retailer managed by the municipalities, in which the two regions are aggregated, and which is responsible for both the water supply and wastewater management services.
In 2015, approximately 548 million m3 of drinking water was invoiced to consumers, down from 582 million m3 in 2012. The average charges for end-users increased from 1.02€/m3 to 1.05€/m3. In both years, approximately 30% of the water in the systems was not invoiced, either because of water losses (e.g. damages in the pipelines), illegal extractions or ineffective invoicing collection. Looking at the second stage of the supply chain, the wastewater invoiced totaled 412 million m3 in 2015, up from 389 million m3 in 2012. In this case, the average charges for end-users increased from 0.68€/m3 to 0.73€/m3 in 2015.
Bulk services operators (15) • Abstraction, treatment, elevation and adduction Retail services operators (262) • Storage, distribution and consumption End-users (9.6 million) End-users (8.2 million) Retail services operators (264) • Discharge, drainage and retention Bulk services operators (19) • Elevation, transport, treatment and rejection
1.3 Current Client Situation
Guaranteeing the financial sustainability of each player in the supply chain is key, on the one hand, for operators to have incentives towards improving service quality and, on the other hand, for ERSAR to have room to set regulatory measures regarding price and quality that benefit consumers.
One of the metrics for the tariff-setting is the cost-coverage ratio, which is the ratio of tariffs (revenue for the retailers) to costs. In a traditional business-setting, retailers would be expected to seek higher tariffs, therefore maximizing revenues and profit. Nevertheless, because clean water and sanitation are public goods and most retailers are managed by municipalities, strong political interests are at stake and higher tariffs would actually threaten the mayors’ re-election. As a result, ERSAR has reasons to believe that some retailers may be inflating the cost-coverage ratio by understating costs, with the purpose of having arguments to support decreasing tariffs, therefore pleasing the local population and prolonging their power position.
1.4 The Business Project Challenge
Through a cost analysis and by taking into account relevant criteria such as scale, the Business Project team was asked to identify and study best practices and their cost advantage, to be used as internal benchmark. This analysis is of utmost importance to assess the accuracy of the cost-coverage ratios reported and to set adequate regulatory measures that fulfil ERSAR’s goals.
Because of the nature of the business challenge, the project scope was limited to the water supply and wastewater services at the retailers’ level, therefore not focusing on the bulk operators’ cost structure. However, the fact that some players operate in both retail and bulk services will not be disregarded, as their cost drivers may vary.
As advisors of ERSAR, the team must (a) study the water services industry and understand its functioning; (b) define relevant criteria to cluster operators with similar characteristics and cost structure, by considering factors such as total client base; (c) identify and analyze best practices from a managing and financial perspective; (d) perform a cost analysis and identify benchmark values for cost drivers; (e) conduct national and international comparisons across retailers.
As final product, the team proposed to deliver a financial model in Excel applicable to different clusters of operators based on criteria such as population density, area, client base groups and pipeline network. The final output would be a proforma P&L evidencing the benchmark cost items per m3 of activity, depending on each cluster.
2 Reflection on the work done
2.1 Problem Definition
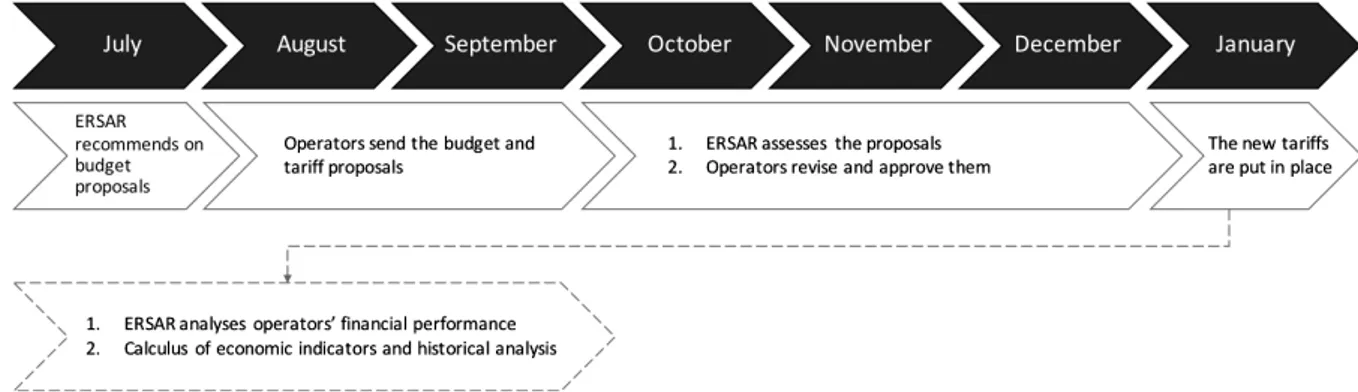
One of ERSAR’s regulatory pillars concerns price-setting, having influence on the tariffs set at the operators’ level and charged to customers. The process starts in July and the revised tariffs are valid from January onwards. However, even though ERSAR recommends on the tariffs and oversees them by analyzing financial indicators and history, operators have a final word. Not only do operators have room to pressure tariffs downwards, but also they have political incentives to do so. Because low revenues threaten their financial sustainability, and hence service quality and availability, and because of the government budget constraints in the aftermath of the recent financial crisis in Portugal, it is of utmost importance for ERSAR to optimize the tariff-setting procedure.
Currently, the tariffs are set based on a cost ratio that may be inaccurately reported by each operator. This is particularly relevant under management models that remain tied to the municipalities (i.e. Câmaras Municipais), rather than delegated to an external public or private entity, which would likely be less biased by a political agenda. The challenge then becomes:
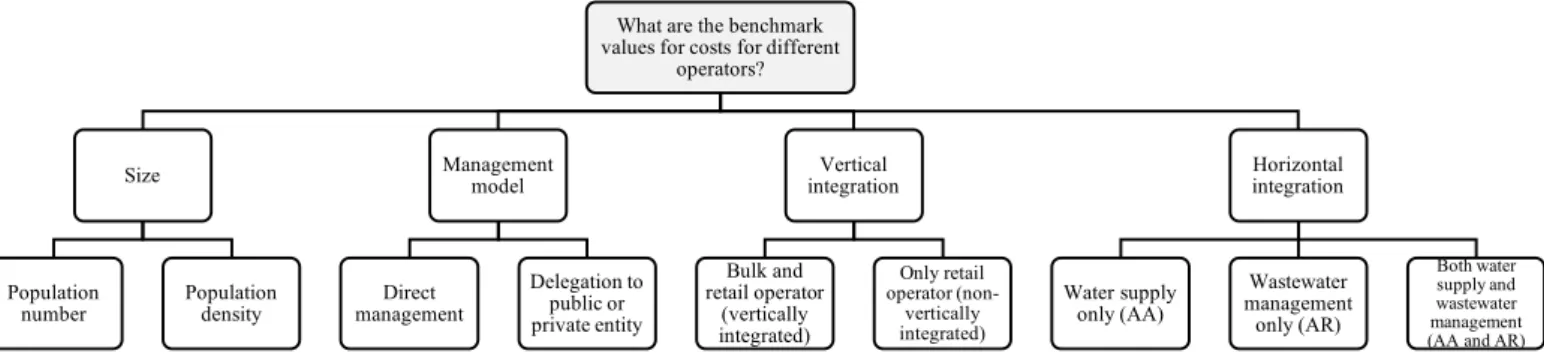
What are the benchmark values for costs for different operators, and how do these impact the way tariffs should be set?
2.2 Methodology Hypothesis
Each operator has its own specificities, such as the geographic region of operations, the technology available, the efficiency and efficacy of internal processes and the activities in which they are involved. The initial hypothesis is that some of these factors influence costs, there being need to control for the differences when comparing different operators. The factors that were hypothesized as impactful towards costs were:
a. Size: the more populous a city is, the larger is the volume of water consumed, which would explain larger costs deriving from infrastructure (e.g. more extensive pipeline network), maintenance and amount of customer requests. b. Management model: municipalities that directly manage the water supply
services were expected to be less efficient than other public or private entities to whom the services had been delegated. This stems from the fact that municipalities oversee disperse activities which possibly leads to lack of focus, and are often slower decision-makers due to bureaucracy.
c. Vertical integration: when operators are vertically-integrated only a small percentage of water sold is acquired from external bulk operators, in which case the unit cost of water sold was hypothesized to be smaller due to transfer pricing below market prices.
d. Horizontal integration: water supply and wastewater management are distinct activities with different cost drivers (e.g. while cost of goods sold is the core in water supply, water treatment costs was expected to be wastewater’s most relevant item). In addition, operators involved in both activities may benefit from synergies such as fuel and transportation, personnel, communications with customers and customer relationship.
Figure 2 - Problem tree
What are the benchmark values for costs for different
operators?
Size
Population
number Population density
Management model Direct management Delegation to public or private entity Vertical integration Bulk and retail operator (vertically integrated) Only retail operator (non-vertically integrated) Horizontal integration Water supply only (AA) Wastewater management only (AR) Both water supply and wastewater management (AA and AR)
Methodology
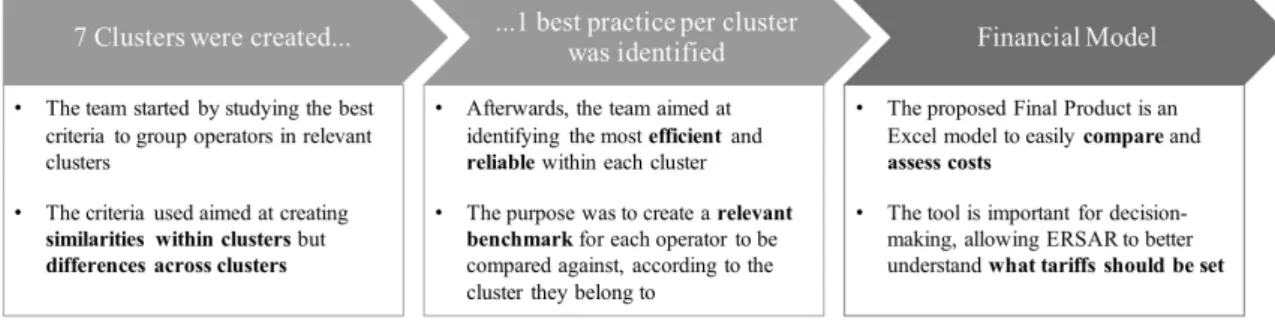
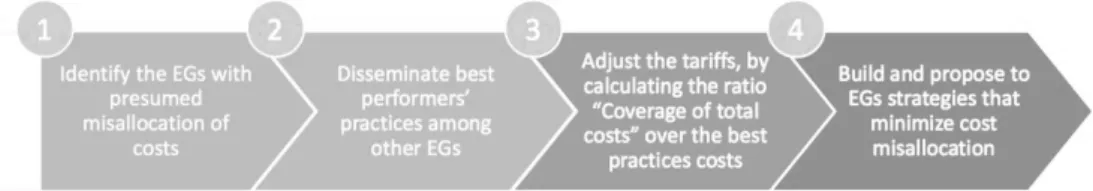
Step 1 – Clustering. The first step was to identify which factors would be relevant to
take into account when comparing costs based on the hypotheses previously drawn, with the purpose of grouping operators into different clusters, such that they were similar within the same cluster, but different across. Only players belonging to the same cluster could be meaningfully compared.
Studying the industry’s functioning in depth was crucial to proceed with this classification, therefore the client organized field-trips to SIMAS Oeiras e Amadora, a retailer managed by the municipalities of Oeiras and Amadora that was regarded by ERSAR as a good practice – technologically advanced, organized, efficient and with favorable quality indicators. A total of six full-days were spent at its premises, where meetings with several departments were held: human resources, communication and customer service, information technology, telemanagement and equipment, losses and mapping, infrastructure, accounting, and legal and auditing. The meetings were similarly structured, having started with an overview of the department and its scope followed by a Q&A session with the directors.
Further, the team was given access to ERSAR’s databases through the internal portal, having proceeded to a more detailed analysis of the profit and loss accounts of SIMAS Oeiras
e Amadora, in a first instance, and of the remaining operators. The annual report and other
internal documents were also thoroughly analyzed. After the broader understanding of the industry the team had acquainted, it could now identify and compare major similarities and differences and define relevant criteria for clustering.
Step 2 – Ranking. Once the clusters had been defined, the team proceeded to identify
the benchmark costs within each. In other words, which operator could be seen as a best practice? The data available consisted of financial reports and numerous indicators aimed at assessing not only performance, but also quality of service and infrastructure facilities.
Examples include percentage of answered customer requests, coverage of total population, social accessibility of service (i.e. water billed over disposable income), human resources efficiency, number of leakages, maintenance CAPEX and coverage of total costs. For each indicator there was a range indicating good, medium or bad score, which was revised by ERSAR. In addition, and because the data based on which the indicators were computed might not be reliable, ERSAR had also developed a metric that assessed how reliable the data each operator reports was (e.g. how likely it was that the reported percentage of answered customer requests represented reality). Finally, auditing reports conducted by PwC for 87 municipalities concluded on their financial accounting accuracy.
Equally as important as looking at these indicators would be to gather ERSAR’s expertise. To this end, the team developed multiple strategies to cluster and rank operators, and kept contact with two engineering and accounting representatives. Through a joint collaboration with the client, it was possible to conclude on the most relevant and credible clustering and ranking strategy.
Step 3 – Creating the Model. Simultaneously to the developments of the clustering and
ranking criteria, the Excel model started to be structured. This step included (a) an overview of the cost data available in ERSAR’s database and since when was it dated; (b) deciding on the final output regarding content and layout (e.g. units, graphs, conditional formatting); (c) understanding the optimal degree of flexibility for the user (e.g. possibility of changing the year, ranking criteria, scale variables on which unit costs are computed).
The Excel model was edited along the way as the team regularly asked for the client’s feedback, with the purpose of fine-tuning ERSAR’s needs. Only when the client himself navigated through the model, could the team better understand its limitations and potential.
Step 4 – Auxiliary tool. Comparing the costs of different operators against an
appropriate benchmark was imperative to detect inaccurate reporting and adjust tariffs accordingly, which was the primary goal of the Business Project. Multiple meetings with the client, however, evidenced another important concern for ERSAR: to study economies of scale and determine whether it would be efficient to group smaller operators. Given that the main model was being built such that each operator could only be compared against its corresponding benchmark, the team decided to develop an extra model on the side. The latter would allow for the comparison between any operators chosen freely, with graphs facilitating interpretation. Not only would this additional tool be broader and extendable to other analysis, but it would also prove to be very useful to detect reporting discrepancies.
Step 5 – Performance analysis and international benchmark. Combined with the cost
analysis, the model allowed for the comparison between service quality indicators, both against the cluster benchmark and an international benchmark. The goal was to provide the client with a more comprehensive overview of the operator selected, both considering efficiency and quality, even if ERSAR was aware that some indicators might not be reliable. The study of the industry outside Portugal started with concrete examples such as Vivaqua in Brussels, which would provide a deeper understanding of how developed the industry was and what strategies had other companies adopted to promote efficiency. The primary sources of information were their annual reports and documents published by the European Benchmark Co-operation, a benchmarking program accessible to all types of water utilities in seventeen different countries.
Analysis
Step 1 – Clustering. In order to define the clusters and test the initial hypotheses based
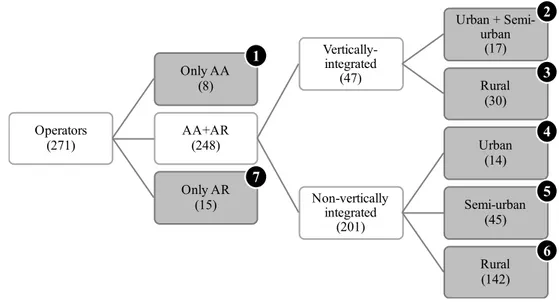
on the information from ERSAR, the field trips to SIMAS Oeiras e Amadora, and the analysis of financial data and annual reports, two aspects were taken into consideration. First, ERSAR’s inputs on the relevant criteria to group different operators; second, further elements chosen based on statistical evidence. The client’s representative from the engineering department highlighted the importance of splitting operators based on their activities: water supply (AA) or wastewater management (AR), therefore corroborating the initial hypothesis regarding horizontal integration. As a result, the first criteria for clustering was Only AA (8 obs.), Only
AR (15 obs.) and AA+AR (248 obs.). Furthermore, vertical integration also triggered significant
differences in business models and cost structure. Given the small size of the Only AA and Only
AR clusters, solely the AA+AR cluster was further split into Vertically-integrated (46 obs.) and Non-vertically integrated (202 obs.).
After this initial grouping, two factors remained to be considered: management model and scale. Given that Vertically-integrated and Non-vertically integrated were the two largest clusters at this stage, only these were intended to be branched further. Running an independent samples t-test1 led to the conclusion that different management models such as direct management or concessions did not impact average total costs with statistical significance. As a result, contrarily to the initial hypothesis, this factor was relaxed as a criterion for clustering. Finally, to assess the impact of scale on average total costs, a variable that considers a weighted combination of population density and total population was used, classifying operators according to the area where they intervene as Urban, Semi-urban or Rural2. Independent
1 A statistical test that compares the means between two unrelated groups on the same
continuous, dependent variable.
2 In ERSAR’s database, this indicator is named typology of area of intervention. It is
sample t-tests were conducted among every combination of typology. In line with the initial hypothesis, scale was found to be a relevant criterion for clustering (see Appendix B – Statistical Analysis for Clustering):
a. Amongst the Vertically-integrated operators, there were significant differences in average total costs between Urban and Rural, and between Semi-urban and
Rural at 5% significance level, but no significant difference between Urban and Semi-urban. As a result, the latter were merged into one single group and, after
running an additional test between this newly created group (i.e. Urban +
Semi-urban) and Rural, relevant differences in average total costs were found.
b. Amongst the Non-vertically integrated operators, all three groups contributed to significant differences in the variable under analysis at 5% significance. After the analysis and ERSAR’s approval, seven clusters were created, as depicted in Figure 4 below. Their number and size was favorable for the steps that followed – ranking and comparison – and broke down operators so that they were different across each group but similar within.
Figure 4 - Clusters created and number of operators within each (between brackets)
Operators (271) Only AA (8) AA+AR (248) Vertically-integrated (47) Urban + Semi-urban (17) Rural (30) Non-vertically integrated (201) Urban (14) Semi-urban (45) Rural (142) Only AR (15) 2 1 3 4 5 6 7
Step 2 – Ranking. Which was the best strategy to identify which operator could be seen
as the best practice of each cluster? Because expenses could be misallocated or wrongly reported, simply choosing the operator with lower average costs (i.e. the most efficient) would be insufficient, as it would also be misleading to compute a simple average. Fortunately, ERSAR’s database was very broad and comprised qualitative data regarding service quality and infrastructure, as well as external auditing reports evaluating the accounting accuracy of some operators. Thoroughly analyzing these indicators led to several alternatives to rank operators within clusters, either by considering only a few or by computing a weighted average, using relevance to determine the weights.
The strategy followed was not to consider average costs, as this was the ultimate goal of the model itself, but instead (a) ERSAR’s revised score on each indicator (i.e. 3-good, 2-medium or 1-bad); (b) each indicator’s reliability score; and (c) PwC’s accounting ranking, applicable to only some operators. Regarding the first element, after excluding the indicators with missing data, a simple average of the scores from 1 to 3 was computed for each operator. A similar approach was followed for the second and third elements, having the scores been converted into a scale from 1 to 3 whenever needed3. As a result, each operator was attributed a rating for each of the three variables considered.
The final rating was computed as a weighted average: for the non-audited operators, the weights were split evenly between ERSAR’s revised score and reliability (50 percent for each); for the audited, the weights were evenly divided between the three elements. These percentages could be changed in the final model, thus leading to different ratings. Afterwards, operators were ranked from highest to lowest within each cluster, having the highest performer been selected as the best practice – therefore being the benchmark (see Table 1).
3 Each indicator’s reliability score was converted as follows: *Very reliable (3),
Table 1 - Best practices of each cluster and corresponding rating Cluster Best practice Rating (/3)
1 Indaqua Fafe 2.7 2 Águas da Figueira 2.5 3 Águas de Carrazeda 2.5 4 Indaqua Matosinhos 2.8 5 SMAS de Tomar 2.6 6 CM de Bragança 2.6
7 SMAES de Santo Tirso 2.4
Step 3 – The Model. The model was constructed such that the user can select one
operator from the database as well as the year under analysis through a drop-down menu. Automatically, the operator is allocated to a cluster, according to its characteristics. CM de
Albufeira would be in cluster 5, as it operates is both water supply and wastewater management,
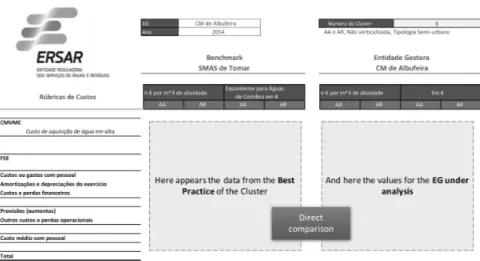
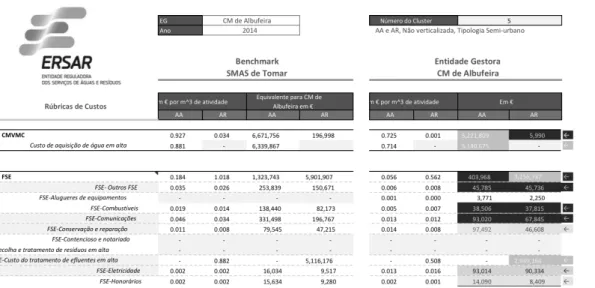
it is not vertically-integrated, and it is in a semi-urban area, for instance. The model also shows the cluster’s best practice automatically, displaying the benchmark on the left-hand side and the operator on the right-hand side of the output table. The benchmark for CM de Albufeira would be SMAS de Tomar.
In addition to the main cost items available in ERSAR’s database, miscellaneous costs were also broken down, as these are very significant across retailers and may be at the root of inaccurate allocation. For the operator itself, costs are shown per m3 of activity and in total euros. On the benchmark side, costs are shown per m3 of activity, as well as the hypothetical total costs that the selected operator would have, were it to be as efficient as the benchmark (i.e. the operator’s m3 of activity multiplied by the benchmark’s unit cost). Finally, the water supply and wastewater management activities were split, given their different drivers.
To facilitate interpretation, a color scale highlights which miscellaneous costs represent a larger percentage of total, as well as the most significant upwards or downwards deviations from the benchmark (see Figure 6 below and Appendix C – Model).
Simultaneously, the team was careful in allowing for the model to remain flexible. To this purpose, the benchmark (i.e. best practice) of each cluster can be manually changed in a drop-down menu. Also, the percentage figures defining the ranges of the color scale can be altered, allowing for ERSAR to be more or less strict when comparing performance. Lastly, the model’s database can be easily updated every year, as it kept the same format as ERSAR’s.
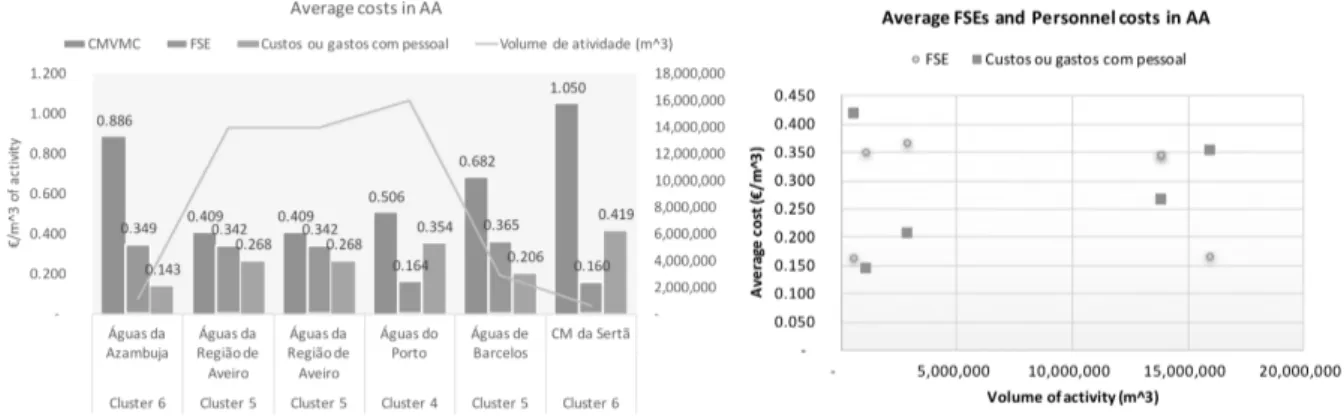
Step 4 - Auxiliary tool. The second tool developed allows for a direct comparison
between any six operators, independently of their cluster. Two different chart types allow for a quick analysis of the main cost items, scale, and how unit costs vary depending on scale (see Figure 7). It should be noted that the scale variable can be manually chosen amongst m3 of activity or total number of clients. This will facilitate the future study of economies of scale.
Figure 7 - Two different chart types from the auxiliary tool
Step 5 – Performance analysis and international benchmark. The performance
analysis is the last element of the model, allowing for the comparison of performance indicators between the operator and both the cluster and international benchmark, separating the water supply and wastewater management activities. This will give the user a broader overview of the operator, not only concerning its efficiency, but also service quality. The performance indicators selected from the European Benchmark Co-operation reports include coverage, water quality, reliability of the pipeline network, service quality (i.e. number of complaints), social sustainability (i.e. affordability of services), economic sustainability (i.e. investments), and finance and efficiency. Similarly to the previous tools, a color scale facilitates the analysis (see Appendix E – Performance Analysis).
2.3 Recommendations to the Company
The main goal of the financial model is to compare operators against a relevant benchmark. The client is hence able to identify which operators report lower costs than the best practice of their corresponding cluster. Second, after the identification phase, ERSAR should study their operations in detail, so as to gauge if they are indeed more efficient or whether they are inaccurately reporting costs. When comparing CM de Albufeira against SMAS de Tomar in Figure 6, for instance, total miscellaneous costs in water supply were at least 50 percent lower than those of the benchmark in 2014, which should draw ERSAR’s attention and ignite a more thorough analysis. With this in mind, the regulator can closely analyze the performance indicators, in an attempt to understand why are there cost differences. Moreover, in order to discuss major deviations, meetings with the retailer should be scheduled.
Subsequently, whenever an operator is identified as not being compliant with good reporting practices, ERSAR should use the benchmark costs instead of the reported ones to calculate the cost-coverage ratio, therefore computing the tariffs based on this higher figure. So as to avoid dispute, the financial model should be used to build solid arguments for the change, and dialog with retailers should be incentivized. Moreover, the model should be made available internally, therefore increasing transparency. Alternatively, if operators are considered to be more efficient than the benchmark, ERSAR should disseminate their superior operations across all players.
2.4 Limitations
Some limitations arose throughout the course of the Business Project, most of them pertaining to the data used in the analysis: (a) availability: limited availability of data caused some operators to be excluded; (b) obsoleteness: the data used is from 2014 and may not reflect the current situation; (c) reliability: concerns over the reporting accuracy reduces the validity of the model; (d) mis-clustering: because of inaccurate data, some vertically-integrated municipalities may have been allocated to the wrong cluster; and (e) operator-specific cost drivers: even though clustering aims at mitigating this shortcoming, the model does not consider all operators’ specific characteristics.
Regarding the international benchmark, because of despair unit measures, the comparison may not be direct. In addition, the international benchmark is constructed on the median value of a large and heterogeneous sample of water suppliers, therefore not matching each operators’ specific size as clustering could not be depicted.
To overcome the above-mentioned shortcomings, ERSAR should create incentives for operators to provide all data, whilst ensuring its accuracy; create a mechanism to automatically extract the relevant and updated data; and standardize the unit measures across operators, using the international benchmark measuring system. Finally, it should be noted that the model must be interpreted with care, taking into account the local specificities of each operator for decision-making and, when identifying possible inaccuracies in reporting, ERSAR should ponder the reasons before taking action.
2.5 Individual Contribution
At the start of the project, defining the problem was key to align all team members towards reaching the same goal, having I contributed for a clear problem definition and breakdown of several hypotheses. Further, I ensured it had been communicated clearly to all team members, as well as it was line with the client’s and business advisor’s expectations.
The project’s workload was very well-balanced, having the group members worked complementarily and cohesively. To this end, tasks were attributed according to each member’s strengths and interests, and regular meetings were scheduled to ensure that everyone’s feedback was taken into account. My important organizational role is noteworthy, which involved the creation of a shared document highlighting the tasks, responsible person, deadline and status; and the constant coordination of communication within the team, and with the business and academic advisors.
Thirdly, my main contribution towards the Business Project pertains the Excel model: defining the inputs and outputs, the layout, and how the information should be presented in a clear and visual way (i.e. conditional formatting, charts), which meant an ongoing focus on the final objective of the project. Moreover, very large databases are the brain of the model, which involved carefully thinking about relevant and complex formulas, so that it was both user-friendly and flexible.
Building the model also meant articulating the developments of the clustering and ranking phases – considering that these were decisive for its functioning – as well as acquainting a deep understanding of ERSAR’s databases. Correspondingly, I was strongly involved in the studying of relevant variables for clustering and in concluding on the final clusters. Frequent contact with the client at every stage was also my initiative.
Lastly, I was involved in the development of the additional financial tool, building on the structure of the main model – learning curve effect. This involved thinking about how to study economies of scale in the future: which cost variables to consider, which operators to analyze and what scale to use.
3 Academic discussion
3.1 Private and Public Goods
Public goods, as opposed to private goods, are non-excludable (do not need to be purchased in order to be used, being readily available for free) and non-rival in consumption (it is possible for several individuals to benefit from them at the same time, being the marginal cost of supplying them zero). Because public goods are non-excludable, no private firm would be willing to provide them; and because they are non-rival in consumption, it would be inefficient to charge for their consumption (Krugman & Wells, 2009). Roads, water supply, sewers, electrical grids and telecommunication infrastructure are examples of public goods that serve all society and are of utmost importance for the economy to function, therefore these are traditionally funded by the public sector – a nonmarket method.
The size of the infrastructure deficit is very large across the world, and an investment of at least $57 trillion until 2030 is needed to accompany the anticipated economic growth. On an annual basis, this is estimated to represent an increase from $2.6 trillion in 2013 to $4 trillion in 2030 (Dobbs, et al., 2013).
3.2 From Public to Private Funding in Infrastructure
Following the recent global financial crisis, governments’ indebtedness poses challenges on their ability to fund the maintenance of existing infrastructure and the pursuit of new projects. As a result, they have supplied these assets through initial public offerings (IPOs), public sales or public-private partnerships (PPPs). Between 1980 and 2008, in particular, European governments have privatized 640 transportation, utility and telecommunication firms (Rothballer & Kaserer, 2012). The private sector is hence increasingly attracted to invest in infrastructure. Since the 1980s, private financing of infrastructure was mainly funded by banks, construction companies, pension funds and
insurance firms. More recently, dedicated infrastructure funds are emerging, the so-called
Infra-funds.
In 2015, 661 infrastructure deals were completed worldwide, with an estimated aggregated deal value of $349 billion. The overall deal value decreased from $444 billion in 2014 and the number of transactions from 914, as the increased demand for infrastructure has driven prices up, hence becoming more difficult for investors to find attractive opportunities and causing average deal values to increase. Average deal values increased unevenly across the industry, where transactions in developed markets and brownfield projects4 were more common. Unlisted funds alone secured a total value of $36 billion in 2015, having these an average size of $858 million. The unlisted fund market is more crowded than ever before, with around 180 funds targeting $120 billion in fundraising, thus putting pressure on strategies to market their offerings (Preqin, 2016).
Even tough more established alternative asset classes such as private equity and real estate are larger, the infrastructure market is growing. Recent studies suggest that around three-quarters of investors are satisfied with their funds’ performance, the majority of them being below their allocation target to this asset class (Preqin, 2016).
3.3 Investment Rationale and Empirical Studies
What characteristics of large infrastructure projects make them so appealing? The key benefits for investors appear to be (a) stable returns and low volatility, (b) low correlation with other asset classes, (c) inflation hedge and (d) long maturity (Gatti, 2012).
Recent studies, however, challenge conventional wisdom. Listed stocks across all infrastructure sectors present lower total risk than comparable equities in the MSCI All Country World Index, controlling for factors that may be correlated with infrastructure and also
4 Brownfield projects are those in which the construction phase is concluded, there
influence risk (e.g., firm size, growth, financial leverage, payout ratio), but the difference is negligible (Rothballer & Kaserer, 2012). On the other hand, the same study shows that infrastructure stocks are significantly less correlated with the market, and that different sectors have different risk profiles, being transportation and utility those with lower betas. Further research analyzing unlisted infrastructure portfolios in Australia also found evidence of lower correlation with specific asset classes such as stocks, bonds and real estate (Newell, Peng, & Francesco, 2011). It can hence be concluded that, although market risk is lower, idiosyncratic risk is higher, which stems from higher operating leverage, construction risk and exposure to regulatory changes.
In order to face the significant exposure to idiosyncratic risk, risk-sharing clauses become imperative, with infrastructure investors often asking governments for guarantees. Further, financial intermediaries play a crucial role in transforming share sizes and redistributing risk, as the bidding consortia is limited to a few sponsors that bear all the risk. This helps explaining the recent emergence of infrastructure funds (Gatti, 2012).
Infrastructure projects have real assets with somewhat predictable cash flows, such as the regulated water tariffs or toll payments. The underlying reason is that hardly can people escape from paying drinkable water or taking the highway. As a result, and because of operators’ monopolistic positions, revenues are believed to be both stable and indexed to inflation, growing in line with the consumer price index (CPI) (Page, Ankner, Jones, & Fetterman, 2008). Notwithstanding, the inflation-hedging properties of listed infrastructure are only true for high pricing power infrastructure, such as highways (limited competition from deteriorated regional roads), gas or water (usually regional monopolies). Moreover, their outperformance regarding inflation is not statistically significant, and can only be capitalized on in stable inflation environments (Rodel & Rothballer, 2012).
3.4 Implications for the Future of Water Infrastructure
Water infrastructure is key to delivering good-quality water in the long-term, which means there should be ongoing investments in storage, efficient resources use and management, strengthened governance and better information. However, there is a global shortage of investing and financing in this sector, which remains predominantly publicly-owned and managed. To face this challenge, how can governments rethink water infrastructure so that it becomes more appealing to investors? Equivalently, what do investors consider when deciding to invest in infrastructure?
First, because of the long-term perspective of these projects, it is important to assure that policy responses are coherent, regulatory frameworks are well-designed, decision-making is driven by relevant information, and that there is transparency and monitoring. Unexpected changes in regulation contribute to unstable environments that translate into higher risk for investors, and hence higher returns required.
Second, there is often absence of competition in this industry, which damages service quality and efficiency. As a result, adequate incentives to encourage innovation becomes of utmost importance. Setting tariffs according to cost-coverage ratios, for instance, would indeed spur operators to find cost-efficient strategies – providing that their costs are correctly reported. Also, abstraction and pollution charges are key to foster innovation. On the other hand, subsidies frequently have an adverse impact, encouraging waste and unnecessary use of water. Efficiency improvements can arise from either technical and operational changes, such as reducing water leakages in the pipeline network or optimizing energy usage; or from improvements at the project design’s stage, including enhanced project management or competitive procurement. Significant progress at this level would improve cash-flows, allowing for higher returns.
Policy makers should therefore be able to create an enabling regulatory environment and an innovative business environment, which would bring not only technical and managerial skills from the sponsors’ side, but also financial resources key to economic growth.
4 Personal reflection
4.1 Strengths & Weaknesses
During the project, I had a very important role in what concerns organizational and operational components. The main strengths observed include:
a. Proactivity in communicating with the academic advisor and the client, making the bridge between their needs and expectations, and the team’s developments. b. Appropriate, professional and calm manner of communicating with the client. c. Focus the team on the project’s goal, thus ensuring that all members were
working towards the same direction.
d. Coordinating clear and complementary tasks, and accompanying each member’s developments.
e. Fostering a good working environment, keeping a positive thinking about the outcome and bringing humor into the table.
In a nutshell, personal values of teamwork, trust, fairness, leadership, autonomy and achievement were constant.
In hindsight, however, there is room for improvement in some areas:
a. Because I am very practical-oriented, there were moments of impatience with colleagues not working as straightforwardly nor quickly.
b. Taking long to acknowledge each one’s strengths and weaknesses led me to occasionally be overly demanding regarding work quality (e.g. colleagues not familiarized with PowerPoint will naturally be less savvy designing slides).
4.2 Plan to develop your areas of improvement
The invaluable learnings from the Business Project dynamics will allow me to become a better team member in the future. Some strategies to develop the areas of improvement and to put in place in subsequent projects include:
a. Getting to know the team members in advance in a more informal setting. A first meeting should be organized at a pleasant park or café, for instance, not to discuss the project but rather to talk about ourselves, our interests and background.
b. Understanding each one’s strengths and weaknesses from the beginning, and regularly asking for their concerns. This is particularly relevant when collaborating with introverts. As a result, I aim at becoming more flexible and helpful.
c. Rethinking communication strategies and improving listening skills. An effective strategy would be to establish specific meetings for brainstorming and others for tasks discussion, thus avoiding dispersion and assuring every person’s opinion is pondered in due time.
4.3 What added most value? What should have been done differently?
I strongly believe that the very cohesive team and excellent working environment was what added most value to the project. In addition to interpersonal compatibility, each member had different backgrounds ranging from finance to management, thus translating into complementary approaches to business problems, which proved to be invaluable for a resourceful analysis. On the other hand, had we defined the business problem and understood the industry more rapidly, we would have been able to give the client support from an earlier stage. Overall, the Business Project was a very enriching experience that allowed me realize how much I am passionate about consulting and how much I value teamwork.
Bibliography
Dobbs, R., Pohl, H., Lin, D.-Y., Hexter, J., Matzinger, S., Palter, R., . . . Garemo, N. (2013, January). Infrastructure productivity: How to save $1 trillion a year. McKinsey Global Institute (MGI).
ERSAR. (2015). Relatório Anual dos Serviços de Águas e Resíduos em Portugal (RASARP). Lisbon: ERSAR.
Gatti, S. (2012). Project Finance in Theory and Practice. Academic Press-Elsevier.
Jones, G., & Babaya, G. (2015, September 17). Investment opportunities in infrastructure.
Finweek, p. 30.
Krugman, P., & Wells, R. (2009). Public Goods and Common Resources. In P. Krugman, & R. Wells, Economics (2nd Edition ed., pp. 459-475). New York: Worth Publishers. Newell, G., Peng, H. W., & Francesco, A. (2011, March). The performance of unlisted
infrastructure in investment portfolios. Journal of Property Research, 28(1), 59-74. Page, S., Ankner, W., Jones, C., & Fetterman, R. (2008). The Risks and Rewards of Private
Equity in Infrastructure. Public Works Management & Policy, 13(2), 100-113. Preqin. (2016). The 2016 Preqin Global Infrastructure Report. Preqin.
Rodel, M., & Rothballer, C. (2012, Summer). Infrastructure as hedge against inflation - Fact or fantasy? The Journal of Structured Finance, 110-123.
Rothballer, C., & Kaserer, C. (2012, Summer). The risk profile of infrastructure investments: Challenging conventional wisdom. The Journal of Structured Finance, 95-109.
Appendix
Appendix A – Client and Industry
Figure 9 - ERSAR's regulatory framework
Figure 10 - Economic regulation process - tariff-setting
Figure 12 - Business Project Scope: retailers (i.e. baixa)
34
Appendix C – Model
Figure 14 - Final Model output table
Figure 15 – Explanation of conditional formatting and color scale
EG Ano 150% 110% 90% 50% AA AR AA AR AA AR AA AR CMVMC 0.927 0.034 6,671,756 196,998 0.725 0.001 5,221,809 5,990 ← 0 1 Custo de aquisição de água em alta 0.881 - 6,339,867 0.714 - 5,140,675 - ← 0 FSE 0.184 1.018 1,323,743 5,901,907 0.056 0.562 403,968 3,256,737 ← 1 0 FSE- Outros FSE 0.035 0.026 253,839 150,671 0.006 0.008 45,785 45,736 ← FSE-Alugueres de equipamentos - - - - 0.001 0.000 3,771 2,250 ← FSE-Combustíveis 0.019 0.014 138,440 82,173 0.005 0.007 38,506 37,815 ← FSE-Comunicações 0.046 0.034 331,498 196,767 0.013 0.012 93,020 67,845 ← FSE-Conservação e reparação 0.011 0.008 79,545 47,215 0.014 0.008 97,492 46,608 ← FSE-Contencioso e notariado - - - - - - - - ← FSE-Custo da recolha e tratamento de resíduos em alta - - - - - - - - ← FSE-Custo do tratamento de efluentes em alta - 0.882 - 5,116,176 - 0.508 - 2,949,164 ← FSE-Eletricidade 0.002 0.002 16,034 9,517 0.013 0.016 93,014 90,334 ← FSE-Honorários 0.002 0.002 15,634 9,280 0.002 0.001 14,090 8,409 ← FSE-Limpeza, higiene e conforto 0.001 0.001 5,898 3,501 0.000 0.000 136 81 ← FSE-Material de escritório 0.004 0.003 27,260 16,181 0.001 0.001 5,494 3,123 ← FSE-Outros subcontratos - - - - - - - - ← FSE-Publicidade e propaganda 0.002 0.001 13,115 7,784 0.000 0.000 1,251 746 ← FSE-Rendas de edifícios 0.003 0.002 20,948 12,434 - - - - ← FSE-Seguros 0.002 0.002 15,810 9,385 0.001 0.001 3,822 3,461 ← FSE-Trabalhos especializados 0.056 0.042 405,722 240,823 0.001 0.000 7,588 1,164 ← FSE-Transporte de mercadorias - - - - - - - - ← Custos ou gastos com pessoal 0.366 0.270 2,637,372 1,565,457 0.151 0.151 1,089,037 878,442 ← 1 0 Amortizações e depreciações do exercício 0.327 0.241 2,351,668 1,395,873 0.089 0.078 644,395 454,329 ← 1 1 Custos e perdas financeiros 0.001 0.001 6,030 3,579 0.015 0.012 111,276 70,804 ← 0 0 Provisões (aumentos) 0.009 0.007 65,537 38,901 0.047 0.037 341,072 215,533 ← 0 0 Outros custos e perdas operacionais - - - - - - - - ← Custo médio com pessoal 18,142 5,729 15,168 12,235 ← 0 0 Total 1.968 1.684 ########## 9,765,721 1.337 1.037 9,626,977 6,016,672 ← 0 0 2014 CM de Albufeira CM de Albufeira Benchmark SMAS de Tomar Número do Cluster 5 AA e AR, Não verticalizada, Tipologia Semi-urbano Entidade Gestora Rúbricas de Custos Em € por m^3 de atividade Equivalente para CM de
Albufeira em € Em € por m^3 de atividade Em €
AA AR AA AR AA AR AA AR CMVMC 0.707 0.008 ######## 69,619 0.852 0.009 8,351,354 82,953 ← Custo de aquisição de água em alta 0.666 - ######## 0.843 - 8,261,322 - ← FSE 0.278 0.723 ######## ######## 0.134 0.662 1,316,516 6089508.8 ← FSE- Outros FSE 0.087 0.053 ######## ######## 0.011 0.006 104,458 59,606 ← FSE-Alugueres de equipamentos 0.001 0.000 9,136 979 0.001 0.001 6,432 5,263 ← FSE-Combustíveis 0.013 0.017 ######## ######## 0.008 0.010 77,160 94,233 ← FSE-Comunicações 0.056 0.000 ######## 1,447 0.040 0.031 394,399 288,920 ← FSE-Conservação e reparação 0.021 0.018 ######## ######## 0.024 0.020 236,831 181,511 ← FSE-Contencioso e notariado - - - - 0.001 0.001 6,782 5,516 ← FSE-Custo da recolha e tratamento de resíduos em alta - - - - - - ← FSE-Custo do tratamento de efluentes em alta - 0.588 - ######## - 0.559 - ########## ← FSE-Eletricidade 0.041 0.028 ######## ######## 0.014 0.007 140,687 67,899 ← FSE-Honorários 0.008 - 76,088 - 0.000 0.000 3,218 2,633 ← Rúbricas de Custos Em € por m^3 de atividade Equivalente para Águas de Coimbra em € Em € por m^3 de atividade Em €
EG Ano AA AR AA AR AA AR AA AR CMVMC 0.707 0.008 ######## 74,159 0.852 0.009 ######## 82,953 Custo de aquisição de água em alta 0.666 - 0.843 - ######## - FSE 0.278 0.723 ######## ######## 0.134 0.662 ######## ######## FSE- Outros FSE 0.087 0.053 ######## ######## 0.011 0.006 ######## 59,606 FSE-Alugueres de equipamentos 0.001 0.000 9,136 979 0.001 0.001 6,432 5,263 FSE-Combustíveis 0.013 0.017 ######## ######## 0.008 0.010 77,160 94,233 FSE-Comunicações 0.056 0.000 ######## 1,447 0.040 0.031 ######## ######## FSE-Conservação e reparação 0.021 0.018 ######## ######## 0.024 0.020 ######## ######## FSE-Contencioso e notariado - - - - 0.001 0.001 6,782 5,516 FSE-Custo da recolha e tratamento de resíduos em alta - - - - FSE-Custo do tratamento de efluentes em alta - 0.588 - ######## - 0.559 - ######## FSE-Eletricidade 0.041 0.028 ######## ######## 0.014 0.007 ######## 67,899 FSE-Honorários 0.008 - 76,088 - 0.000 0.000 3,218 2,633 FSE-Limpeza, higiene e conforto 0.002 0.001 23,927 10,572 0.000 0.000 2,665 2,181 FSE-Material de escritório 0.002 - 17,047 - 0.000 0.000 2,587 2,264 FSE-Outros subcontratos 0.010 0.003 94,770 23,548 - - - - FSE-Publicidade e propaganda 0.002 - 19,007 - 0.001 0.001 8,310 6,799 FSE-Rendas de edifícios - 0.004 - 39,174 - - - - FSE-Seguros 0.013 0.008 ######## 74,431 0.004 0.004 43,489 39,495 FSE-Trabalhos especializados 0.023 0.002 ######## 22,045 0.030 0.021 ######## ######## FSE-Transporte de mercadorias - - - - Custos ou gastos com pessoal 0.338 0.131 ######## ######## 0.308 0.265 ######## ######## Amortizações e depreciações do exercício 0.330 0.396 ######## ######## 0.178 0.357 ######## ######## Custos e perdas financeiros 0.119 0.231 ######## ######## 0.001 0.001 9,141 7,479 Provisões (aumentos) - - - - 0.018 0.019 ######## ######## Outros custos e perdas operacionais 0.014 0.008 ######## 78,542 0.012 0.012 ######## ######## 2014 Águas de Coimbra Águas de Coimbra Benchmark Águas de Mafra Número do Cluster 5 AA e AR, Não verticalizada, Tipologia Semi-urbano Entidade Gestora Rúbricas de Custos Em € por m^3 de atividade Equivalente para Águas
de Coimbra em € Em € por m^3 de atividade Em €
150% 110% 90% 50% • A colour scheme highlights the most significant deviations from the benchmark • Considers both upwards and downwards deviations • Separates AA and AR activities • Green indicates the EG’s cost item is between 90% and 110% that of the benchmark • Dark red indicates it is 50% or below – undercosting • These 4 percentage intervals can be changed manually
Figure 16 - Changing the clusters' benchmark operator – flexibility of the model
Appendix D – Auxiliary Model
Figure 17 - Choosing of the scale variable to study economies of scale
Cluster Benchmark EG 1 Luságua Alcanena - Gestão de Águas Ano 2 Águas da Figueira 3 INOVA 4 Indaqua Matosinhos 5 Águas de Mafra 6 Taviraverde AA AR AA AR AA AR AA AR 2014 Águas de Coimbra Águas de Coimbra Benchmark Águas de Mafra Número do Cluster 5 AA e AR, Não verticalizada, Tipologia Semi-urbano Entidade Gestora
Rúbricas de Custos Em € por m^3 de atividade Equivalente para Águas de Coimbra em € Em € por m^3 de atividade Em €
• These are the best practices the team assigned to each cluster, based on the clustering and raking criteria • Can be easily changed by selecting from the menu or typing the name of the EG ! If typed, the name must exactly match the one in ERSAR’s database, and the EG has to be placed in the corresponding cluster 150% 110% 90% 50% EG Ano 2014 CM de Albufeira CM de Albufeira Benchmark SMAS de Tomar Número do Cluster 5 AA e AR, Não verticalizada, Tipologia Semi-urbano Entidade Gestora • The scale variable can be selected in cell B46 • The graphs will change accordingly
Appendix E – Performance Analysis
Figure 18 - Indicators assessing performance in water supply
Figure 20 - Performance indicators output table
Figure 21 - Conditional formatting for performance indicators
3
EG Valor Unidades Cluster
benchmark Unidades International benchmark Unidades Coverage Acessibilidade física do serviço 99,00 % 93 % 99,40 % Water quality Cumprimento dos parâmetros de descarga 100,00 % 99 % 99,70 % Reliability
Ocorrência de colapsos estruturais em coletores 0,00 /(100 km.ano) 1,7 /(100 km.ano) 40,90 /(100 km.ano) Ocorrência de inundações 0,92 /(1000 ramais.ano) 1,63 /(1000 ramais.ano) 0,30 /100 km esgoto
Service quality Reclamações e sugestões 3,98 reclamações/1000 propriedades 1,34 reclamações/1000 propriedades 0,90 reclamações/1000 propriedades Social sustainability Acessibilidade económica do serviço 0,29 % NA % 0,55 % Economic sustainability
Reabilitação de coletores 0,30 %/ano 0,4 %/ano 0,30 %/ano
Cobertura dos gastos totais (-) NA (-) 1,01 (-)
Finance & Efficiency
Encargo médio com o serviço de águas residuais 103,92 €/ano 141,54 €/ano 172,00 €/ano Adequação dos recursos humanos 12,40 /(100 km.ano) 11,6 /(100 km.ano) 0,64 /1000 propriedades
Qualidade e desempenho
AGERE
Wastewater activities (AR)
Entidade Gestora Cluster Best Practice International benchmark
Águas da Figueira • A color scheme highlights the most significant deviations from the benchmark • 2 Types of indicators: • Performance indicators: The more/less the better • Economic indicators: The ideal value varies around the value of the best practice of the cluster. èConsiders both upwards and downwards deviations • These different percentage intervals can be changed manually Coverage In absolute terms (%) Acessibilidade física do serviço - 95,00 98,00 100,00 Water quality In absolute terms (%) Água segura - 95,00 98,00 100,00 Reliability % of the cluster benchmark Ocorrência de avarias em condutas + 150,00 125,00 - -Perdas reais de água + 200,00 150,00 - -Service quality % of the cluster benchmark Reclamações e sugestões 50,00 80,00 120,00 150,00 + Social sustainability % of the cluster benchmark Acessibilidade económica do serviço 50,00 90,00 110,00 150,00 + Environmental sustainability % of the cluster benchmark Eficiência energética de instalações elevatórias + 150,00 125,00 - -Economic sustainability % of the cluster benchmark Reabilitação de condutas 50,00 80,00 + + + Cobertura dos gastos totais 50,00 80,00 120,00 150,00 + Finance & Efficiency % of the cluster benchmark Encargo médio com o serviço de abastecimento de água 50,00 80,00 120,00 150,00 + Adequação dos recursos humanos + 150,00 125,00 - -Color range