Overview of Recent ATLAS Physics Results
1Patricia Conde Mu´ı˜no on behalf of the ATLAS Collaboration
LIP, Elias Garcia 14, 1000-149 Lisbon, PT E-mail: [email protected]
Abstract. The ATLAS experiment is situated at the Large Hadron Collider at CERN (Geneva). It was designed to cover a wide range of physics topics, such as precision measurements of Standard Model physics, the determination of the Electroweak Symmetry Breaking mechanism through the search for the Higgs boson, and searches for new physics beyond the Standard Model, like super-symmetric particles. ATLAS started operation at the LHC at the end of 2009, collecting poton-proton collisions at 7 and 8 TeV centre of mass energies. In this paper a summary of some of the most interesting recent physics ATLAS results will be presented.
1. Introduction
ATLAS [1] is one of the four Large Hadron Collider (LHC) experiments at CERN. It is also the result of more than 20 years of continuous work executed by more than 3000 physicists from about 40 different countries around the world. ATLAS aims at exploring the unprecedented high energy proton-proton (pp) collisions delivered by the LHC, with focus on precise measurements of Standard Model predictions, search for the Higgs boson, search for super-symmetry (SUSY) and any other expected or unexpected new physics process that may appear.
ATLAS started operation in 2009, when the LHC delivered the first pp collisions. Since then it has collected a total integrated luminosity of about 5 fb−1 of 7 TeV pp collisions and about 21 fb−1of 8 TeV pp collisions. In addition, over 150 µb−1of lead-lead collisions were collected at 2.76 TeV centre of mass energy per nucleon, for a dedicated heavy ion physics program2. The ATLAS detector operated with very high efficiency, with above 99% of the detector channels working. From the delivered luminosity, 93.7% was collected and had good quality for physics analysis. These data have been used to study many different physics processes. In this proceedings some of the most relevant ATLAS recent results will be reviewed.
2. Jet production cross section
Jet production is the most abundant high transverse momentum (pT) process at the LHC,
constituting an important tool to understand the strong interaction, to determine the proton structure and to search for physics beyond the SM. ATLAS has measured the jet production cross section in 7 TeV pp collisions using 37 pb−1 of integrated luminosity [2], covering a wide range in rapidity3, up to |y| < 4.4.
1 Copyright 2013 CERN for the benefit of the ATLAS Collaboration. CC-BY-3.0 license. 2
Not covered in this paper.
3 The ATLAS coordinate system is a right-handed system with the x axis pointing towards the centre of the
Jets are defined using the anti-kt[3] algorithm, as implemented in the FASTJET [4] package,
with two different radius parameters R=0.4 and R=0.6. The resulting jets are corrected by all detector and reconstruction effects. Truth jets in the Monte Carlo (MC) simulation are identified using the anti-ktalgorithm and are built from stable particles, which are defined as those with a
proper lifetime longer than 10 ps. This definition includes muons and neutrinos from decaying hadrons.
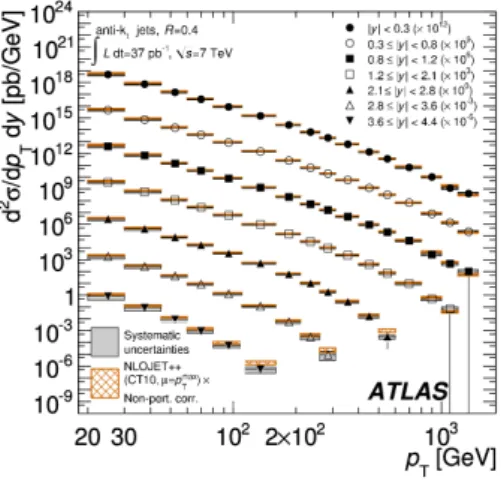
Figure 1. Inclusive jet double differential cross section as a function of the jet pT and in bins
of rapidity for jets identified with the anti-kt
algorithm with radius R=0.4 [2].
The inclusive jet production cross section as a function of pT and in bins of rapidity, for
jet pT > 20 GeV and for a jet radius of R = 0.4 is shown in figure 1. The term inclusive
means that all the jets in the event have been considered. This measurement extends up to a jet pT of 1.5 TeV, the highest ever measured, and spans over ten orders of magnitude in
cross section. The error bars, which are usually not visible, represent the statistical uncertainty. The total systematic uncertainty, dominated by the jet energy scale systematic uncertainty, is shown with shaded area. There is an additional 3.4% systematic uncertainty due to the luminosity that is not shown. Data is compared to the NLO perturbative QCD calculations using NLOJET++ [5] to which non-perturbative corrections have been applied. The CT10 NLO parton density function (PDF) set [6] has been used. The data to MC ratios are shown in figure 2. The results are also compared with predictions obtained using the MSTW 2008 [7], NNPDF 2.1 [8, 9] and HERAPDF 1.5 [10] PDF sets. There is an overall agreement between the MC predictions and the data. However, the data shows slightly smaller cross section values that become worse for the most forward bins in rapidity. This difference is of the same order of the total systematic uncertainty on the measurement, including both experimental and theoretical uncertainties, providing some sensitivity to test the theoretical predictions.
These results constitute a comprehensive test of perturbative QCD in a large kinematic regime and may be used to constrain the parton distribution functions at large x and high momentum transfer.
3. Search for di-jet mass resonances at the LHC
Several extensions beyond the SM predict new heavy particles, accessible at LHC energies, that can decay into two energetic partons, such as excited quarks q∗ that would be the result of quark compositeness [11–13], axigluons predicted by the chiral colour models [14, 15] or technicolor particles. ATLAS has performed a model independent search for di-jet mass resonances, using
φ is measured from the positive x axis and the polar angle θ is measured from the positive z axis. When dealing with massive jets and particles, the rapidity y = 12ln(E+pz
E−pz) is used, where E is the jet energy and pz is the
Figure 2. Ratios of inclusive jet double-differential cross section to the theoretical prediction obtained using NLOJET++ with the CT10 PDF set [2]. The ratios are shown as a function of jet pT in different regions of rapidity.
13 fb−1 of pp collisions at 8 TeV centre of mass energy [16]. This study used as a benchmark the excited quark model, that predicts accessible cross sections at the LHC, imposing limits on the acceptance times cross section (σ × A) for resonant states with intrinsic widths narrower than the experimental resolution. The analysis technique consists of searching for a peak in a continuous falling background. New di-jet resonances would be visible as a significant excess over the fitted background.
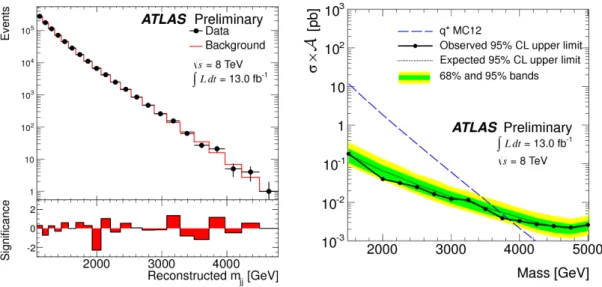
Figure 3. Left: di-jet invariant mass distribution for 13 fb−1 of 8 TeV pp collisions. The background fitting function is shown with a solid line [16]. Right: The 95% CL upper limit on the production cross section times acceptance of a new di-jet mass resonance as a function of di-jet invariant mass (black filled circles). The blue dashed curve represents the excited-quark cross section times acceptance prediction [16].
The di-jet mass spectrum is shown in figure 3 (left) for 13 fb−1 of pp collisions at 8 TeV. The background fitted function is shown with a solid line. The BumpHunter algorithm [17, 18] is used to test the presence of resonances in the dijet mass spectrum, assuming Poisson statistics and taking proper account of the look-elsewhere effect [19]. No significant excess was observed and, in the absence of a signal, a Bayesian method is applied to calculate the 95% Confidence Level (CL) limits on the cross section times acceptance of new resonances [16]. The resulting limits are shown in figure 3 (right). The observed (expected) lower limit on the mass of excited quarks is 3.84 TeV (3.70 TeV).
4. Top quark physics
With a top quark pair production cross section twenty times larger than the Tevatron, the LHC is a top quark factory, providing ideal conditions to measure precisely the top quark properties. The top quark is the heaviest of all the quarks, with a mass similar to an atom of gold. Its Yukawa coupling to the Higgs is close to unity, which frequently leads to speculation that it may play a special role in the Electroweak Symmetry Breaking mechanism. Due to its very short lifetime, it decays before hadronization, preserving the properties of the bare quark, like the spin information that can be visible through the angle correlation of the decay products.
The top quark plays also a special role in Beyond the Standard Model scenarios, where new particles may decay to top quark pairs, be produced in its decay or modify its properties. Therefore, precise measurements of the properties of the top quark are very important to verify the SM prediction and search for new physics beyond it.
The top quark decays almost always to a W boson and a b quark in the SM. Depending on the decay of the W boson the final states will contain leptons and missing transverse energy due to the escaping neutrino, b-jets and/or additional jets.
4.1. t¯t production cross section
ATLAS has measured the t¯t production cross section in 7 TeV pp collisions with a precision of about 7% [20] using the semileptonic channel (only one of the W bosons decays to a lepton4 and a neutrino), the dilepton channel (both W decay semileptonically) and the all hadronic channel (both W decay hadronically). The result of this combination is a value σt¯t = 177 ± 3 (stat) +8−7 (syst) ±7 (lumi) pb that exceeds the theoretical prediction of σt¯t= 167+17−18 pb [21] by about 6%, being still compatible with it within one sigma.
A new measurement has recently been performed [21] in the one-lepton plus jets channel in which one of the leptons contains a soft muon from the b-quark decay. This measurement can be sensitive to processes of cascade decays of non-SM bottom-flavoured objects, such as b → ˜bX → µcX0 in SUSY, that would enhance the cross section value and might modify the kinematic and charge distribution of the soft muons. The measured cross section value is σt¯t= 165±2 (stat) ±17 (syst) ±3 (lumi) pb, in good agreement with the theoretical expectation.
The t¯t production cross section has also been measured with 5.8 fb−1 [22] of pp collisions at 8 TeV centre of mass energy, using the semileptonic channel. The event selection requires a good quality isolated lepton (electron or muon), at least 3 jets and at least one of the jets b-tagged. A multivariate likelihood technique is used to enhance the signal to background ratio. The number of t¯t events is determined from a fit to the likelihood discriminant variable. The resulting cross section is σt¯t= 241 ± 2 (stat) ±31 (syst.) ±9 (lumi) pb, in good agreement with the theoretical expectation of 238+22−24 pb [22].
Figure 4. Jet multiplicities in t¯t events for two different jet pT thresholds: 25 GeV (left) and
80 GeV (right) [23].
4.2. Jet multiplicities in t¯t events
The measurement of the t¯t production with additional jets as a function of the jet transverse momentum can constrain initial and final state radiation (ISR/FSR) models and tests perturbative QCD at the LHC energies. The jet multiplicity has been measured in t¯t events for different jet pT thresholds, in the single-lepton channel, within the kinematic range accessible
at ATLAS [23]. The multiplicities, fully corrected for the effects of the detector efficiencies, resolution and biases, are shown in figure 4 for two different jet pT thresholds (25 and 80 GeV).
Data is compared to the prediction obtained by different MC simulations (ALPGEN [24] with HERWIG [25] or PYTHIA to simulate the showering and fragmentation , MC@NLO [26] with HERWIG and POWHEG [27] with PYTHIA). The data points are shown with error bars that correspond to the statistical uncertainty, while the total uncertainty (systematic plus statistics) is shown as a shaded area. In the MC, the jets are defined using the same algorithm as in data (anti-kt with radius parameter R = 0.4) running on all the stable particles except muons and
neutrinos. Particles from the underlying event were included in this definition, whereas particles from overlaid inelastic events were not. For the lower pT thresholds, all the MC generators
describe the data multiplicities within the uncertainties, while MC@NLO underestimates the data for multiplicities higher than 5 jets. For the higher pTthreshold, MC@NLO underestimates
the data almost for all the bins, suggesting that the jet pT spectrum it generates is too soft.
All the other predictions are in agreement with the data within the uncertainties, for both jet pT thresholds. The present measurement is limited by systematic uncertainties, dominated by
the background modelling at lower jet multiplicities and by the jet energy scale at higher jet multiplicities.
4.3. Top quark polarization in t¯t events
According to the SM, top quarks are expected to be produced unpolarized at the LHC, due to QCD parity conservation and to the unpolarized initial state. New physics models might result
in a sizeable polarization, measurable at the LHC. The top quark polarization is preserved in its decay and can be extracted from the W decay products by studying the polar angle of the lepton in the rest frame of its parent top quark. In order to do so, the full reconstruction of the t¯t system kinematics is necessary. A likelihood fit is used to determine the neutrino momentum and the assignment of final state jets to the top and antitop quark decays [28]. The polar angle distribution, cos θl, is fitted using templates obtained from the MC simulation of signal events
with positive and negative polarization. The fraction of positively polarized top quarks f = 1
2+
N (cos θl> 0) − N (cos θl< 0)
N (cos θl> 0) + N (cos θl< 0)
(1) is obtained from the fit.
The fraction f has been measured using 4.66 fb−1 of 7 TeV pp collisions recorded in 2011, using t¯t events in the semileptonic decay channel. The result of the template fit is a fraction of positively polarized top quarks of f = 0.470 ± 0.009 (stat) +0.023−0.032 (syst) in agreement with the SM prediction of fSM = 0.5. This result is dominated by the systematic uncertainty, which
mainly comes from the determination of the jet energy scale and the effect of the top quark mass on the signal modelling.
4.4. Top quark spin correlations
At the LHC, t¯t pairs are produced mainly through gluon-gluon fusion, which is dominated at low invariant mass of the t¯t pair by the fusion of like-helicity gluon pairs. This produces top quarks in the left-left or right-right helicity configurations [29]. New physics models may change the t¯t spin correlations while keeping the total cross section unchanged. When the t and ¯t decay, if both W bosons decay semileptonically, the spin correlations can be observed in the correlation of the azimuthal angle of both leptons in the laboratory frame, ∆φ. In this case, it is not necessary to reconstruct the full kinematics of the t¯t pair.
The degree of correlation, A, is defined as the fractional difference between the number of events where the top and antitop quark spin orientations are aligned and those where they have opposite alignment
A =N (↑↑) + N (↓↓) − N (↑↓) − N (↓↑)
N (↑↑) + N (↓↓) + N (↑↓) + N (↓↑) (2)
where the arrows denote the spin of the top/antitop quarks with respect to the quantization axis.
The ∆φ distribution is fitted to templates obtained with the MC simulation to determine the fraction A. Two different bases are used: the helicity basis, using the direction of flight of the top quark in the t¯t rest frame and the maximal basis, which is optimized for t¯t production from gg fusion [30]. The SM predictions for A, obtained with MC@NLO MC at matrix element level, are the following: ASMhelicity= 0.31 and ASMmaximal= 0.44.
The measured asymmetry values, obtained with 2 fb−1of pp collisions at 7 TeV in the centre of mass, are: Ahelicity= 0.40±0.04 (stat) +0.08−0.07 (syst) and Amaximal= 0.57±0.06 (stat)+0.12−0.20(syst).
MC pseudo-experiments are used to calculate the probability that the observed degree of correlation or larger is measured, assuming no spin correlation. The spin zero hypothesis is excluded with a significance of 5.1 standard deviations (expected value 4.2).
5. Diboson production
The SM predicts Triple Gauge boson Couplings (TGC) fully constrained by the Electroweak symmetry, with some vertices that are allowed (like W W γ and W W Z) and others that are forbidden (ZZγ, ZZZ). The inclusive and differential di-boson production rates are sensitive
to the TGC, that could be modified by new physics models introducing anomalous TGC, new particle decays or a composite structure of the Z and W bosons.
5.1. WW production cross section
Figure 5. Left: normalized differential WW fiducial cross section as a function of the leading lepton pT [31]. Right: limits on the anomalous W W Z and W W γ anomalous triple gauge boson
couplings ∆kZ, λZ and ∆g1Z [31].
The W W Standard Model production cross section in pp collisions at 7 TeV centre of mass energy is predicted to be 44.7+2.1−1.9 pb [32]. A 126 GeV Higgs boson decaying into W W∗ would increase this value by approximately 3%. The measured value of the W W production cross section for 4.6 fb−1of data is σW W = 51.9 ± 2.0 (stat)±3.9 (syst) ±2.0 (lumi) pb [31]. It exceeds
the theoretical prediction by more than one standard deviation.
The leading lepton pT distribution is sensitive to anomalous TGC that would manifest as an
increase in the high pTtail of the distribution. The Lorentz invariant Lagrangian describing the
W W Z and W W γ interactions has fourteen independent coupling parameters [33]. Assuming electromagnetic gauge invariance and C and P conservations, the number of independent parameters reduces to five: g1 , kZ, kγ , λZ and λγ. In the SM, these parameters have the
values: g1 = kZ = kγ = 1 and λZ = λγ = 0. Form factors that vanish at high parton centre of
mass energy are introduced to ensure unitarity at high energies. These form factors depend on a cutoff parameter Λ.
The measured leading lepton pTdistribution is shown in figure 5 (left). The data distribution
is compared to the SM prediction and to the distributions that would be obtained in the case of anomalous triple gauge boson couplings. The leading lepton pT distribution is corrected by the
experimental effects due to the detector acceptance, resolution and reconstruction efficiency. A test likelihood function that considers the observed number of candidate events, the expected signal as a function of the anomalous TGC and the estimated number of background events in each pT bin is defined and used to estimate the anomalous TGC. With the assumption that the
W W Z and W W γ couplings are equal, the 95% CL limits on the deviations of the parameters from their SM value, ∆kZand λZ, are [−0.061, 0.093] and [−0.062, 0.065] respectively, for a cutoff
scale Λ = 6 TeV, which is the largest value preserving unitarity. These limits are compared to the CMS [34], CDF [35], D0 [36] and LEP [37–40] results in figure 5 (right). They are better than the limits obtained at Tevatron due to the higher production cross section at the LHC and they are approaching the precision obtained by the combined LEP results.
5.2. W γ and Zγ production cross section
The W γ and Zγ (called collectively V γ) production cross sections have been measured for 1.02 fb−1 of pp collisions at 7 TeV centre of mass energy, as a function of the photon transverse energy [41]. Two different cross sections have been studied: inclusive, where there is no requirement on additional jets, and exclusive, where there is no hard jet in the event. In the inclusive V γ cross section there is a significant contribution from final state radiated photons from the fragmentation process, while in the exclusive production the photons come primarily from the initial state radiation or from triple gauge boson vertices of the type W W γ in the W γ events.
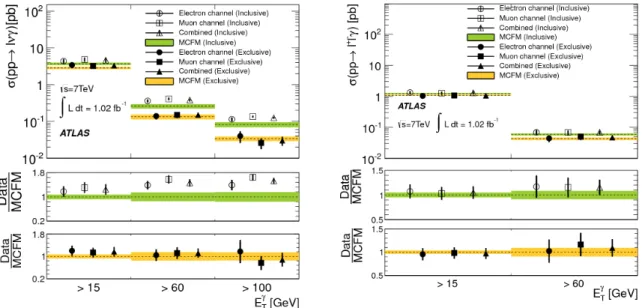
Figure 6 shows the inclusive and exclusive production cross sections for W γ (left) and Zγ (right) as a function of the photon transverse energy. The data values are compared to the SM predictions obtained with the MCFM [42] MC generator. The data to MC ratios are also shown. There is a good agreement of the measured exclusive cross sections with the MCFM predictions. The inclusive production cross sections differ from the MCFM prediction at high photon transverse energy. This is probably due to the fact that MCFM only includes real parton emission up to one radiated quark or gluon and therefore it misses higher order QCD corrections, resulting in an underestimation of the inclusive V γ cross sections.
Figure 6. Inclusive and exclusive production cross section of W γ (left) and Zγ pairs as a function of the photon transverse energy, in 7 TeV pp collisions [41].
Assuming C and P conservation separately, the anomalous TGC are normally parameterized as ∆kγ= kγ− 1 and λγ for the W W γ vertex and hV3 and hV4 for the ZV γ vertices (see [41] and
references therein). The measurement of exclusive V γ production for high photon transverse energy has been used to search for anomalous TGC. No evidence of new physics beyond the SM has been observed, and therefore limits on anomalous triple gauge boson couplings were derived. These limits, shown in figure 7, are compatible with the ones obtained at LEP and Tevatron. 5.3. ZZ production cross section
The ZZ production cross section has been measured by ATLAS for 4.6 fb−1 of 7 TeV pp collision [43] and for 5.8 fb−1 of 8 TeV pp collisions [44] using the channels ZZ → llll and ZZ → llνν for the 7 TeV analysis and the four lepton channel for the 8 TeV analysis.
Figure 7. Limits on the anomalous TGC ∆kγ, λγ, hW3 , hZ3, hW4 , hZ4, f γ
4, f4Z, f γ
5 and f5Z in
comparison to the values obtained by D0, CDF and the LEP experiments (see [41, 43] and references therein).
The non resonant ZZ pairs are produced in the SM mainly through the t-channel and s-channel quark-antiquark annihilation process, with a small contribution from gluon-gluon fusion. No TGC ZZγ and ZZZ are allowed in the SM. The predicted SM cross sections for 7 and 8 TeV pp collisions are 5.89+0.22−0.18 pb and 7.4 ± 0.4 pb, respectively, when the two Z bosons are on shell. The contribution of a 126 GeV Higgs boson would be of the order of 3% (not included before). The measured cross sections are: σZZ = 6.7 ± 0.7 (stat) +0.4−0.3 (stat) ±0.3 (lumi) pb and
σZZ = 9.3+1.1−1.0 (stat)+0−4−0.3 (syst) ±0.3 (lumi) pb for 7 and 8 TeV pp collisions, respectively. Both
results are consistent within errors with the SM expectation.
Neutral TGC can be parameterized in terms of two CP violating (f4γ and fZ
4 ) and two CP
conserving (f5γ and f5Z) complex parameters (see [43] and references therein). A form factor that depends on a cutoff parameter Λ is introduced to ensure unitarity at high energies, in the same way as before.
The leading Z boson pT distribution is used to impose limits on anomalous neutral triple
gauge boson couplings using a maximum profile likelihood ratio [43]. The resulting 95% confidence limits are shown in figure 7 (bottom right), in comparison with previous results. The ATLAS limits improve the limits obtained at LEP and at Tevatron by about a factor five.
6. Higgs searches
In July 2012, the ATLAS and CMS collaborations announced the discovery of a new boson observed in the Higgs searches at the LHC [45]. The ATLAS result was based on three search channels: H → W W → lνlν, H → ZZ → llll and H → γγ that used 5.8-5.9 fb−1 of 8 TeV pp collisions and 4.6-4.8 fb−1 of 7 TeV pp collisions. In the same analysis, any other SM Higgs-boson was excluded with 95% CL in a large mass range, from 111-122 and 131-559 GeV. Since this discovery, the focus of the ATLAS collaboration has been the measurement of this new boson’s properties, in order to understand if it is indeed the SM Higgs boson, and in particular its detection in all the possible decay and production modes.
In what follows, an overview of new ATLAS results obtained from July till December 2012, using 13 fb−1of 8 TeV pp collisions, will be presented. They refer to three different searches: an update of the H → W W results, the search for the Higgs decay to b-quark pairs and to τ lepton pairs. In all the cases a blind analysis was performed, i.e., the analysis strategy was fixed based on the MC simulation and data control regions before looking at the signal region in data.
In the SM the Higgs boson is produced mainly through gluon-gluon fusion, with a cross section of the order of a few pb for the low mass range. The second most important production mechanism, with a cross section about an order of magnitude smaller, is the vector boson fusion process (VBF), that can be identified using the signature of the two forward/backward jets. The associated production of a vector boson (W or Z) and a Higgs, has an even smaller cross section, but the clear signatures provided by the leptonic decays of the W or Z boson can be used to reject background in complicated decay channels such as the H → bb. Finally, the associated production mode of a Higgs boson with a t¯t pair has the smallest cross section, with reduced sensitivity for the current integrated luminosities [46].
In the low mass range where the new boson was observed, the dominant decay branching ratio is to b-quark pairs, followed by W W pairs. The branching ratios to ZZ or γγ are one or two orders of magnitude smaller but the clean experimental signatures, together with the very good mass resolution, mean that these channels could still provide the greatest sensitivity. The H → bb and H → τ τ are both affected by very large backgrounds, providing the smallest sensitivity.
6.1. H → W W
Events with two isolated, high pT leptons of different flavour (eµ or µe) and large missing
transverse energy were selected for this analysis [47]. The event selection was further optimized to reduce the main backgrounds: W +jets, top quark production, di-boson production and Z/Drell-Yan. Where possible, data driven techniques were considered to estimate the background yield (top, W W and W +jets). Different analysis categories that are sensitive to different production mechanisms and affected by different background compositions were considered. The categories were selected requiring in addition zero or one jet with pT above 25 GeV.
In figure 8 (left) the transverse mass, mT, distribution of the selected events with a leading
electron is shown. A broad excess of events, compatible with being produced by a 125 GeV Higgs boson, is visible.
The mT distributions for 0- and 1-jet categories are combined in a profile likelihood fit to
estimate the signal strength5 µ, to measure the probability that a background fluctuation is equal or larger than the data observation (i.e., the p0 value) and the 95% confidence exclusion
limits. The minimum p0 value, 3 × 10⁻³, is obtained for a mass of 111 GeV and corresponds
to 2.8 standard deviations. Due to the limited mass resolution of the H → W W analysis, the minimum of the p0 distribution is very broad, so its value at 125 GeV is still 4 × 10⁻³,
corresponding to 2.6 standard deviations.
Figure 8. Left: invariant mass distribution of events with a leading electron [47]. Right: p0
value obtained in the H → W W analysis [47].
The fitted signal strength, µ, at 125 GeV is µ = 1.48+0.35−0.33 (stat)+0.41−0.36 (syst theor)+0.28−0.27 (syst exp) ±0.05 (lumi). It is compatible with the SM hypothesis within the uncertainty, which is dominated by the theoretical uncertainty on the normalization of the W W background.
6.2. H → b¯b
Due to the overwhelming QCD background of b-quark pairs, the search for the H → b¯b is performed in the associated production channel of a vector boson and a Higgs [48]. Three different channels are considered: W H → lνb¯b, ZH → llb¯b and ZH → ννb¯b. The event topologies are characterized by high pT isolated leptons, large missing transverse energy, ETmiss
(in the case of the W H and ZH → llb¯b) and exactly two b-tagged jets. Different categories, based on the pT of the vector boson or ETmiss, are considered. The invariant mass distribution
for the most sensitive category is shown in figure 9.
The different analysis categories are combined in a profile likelihood ratio to calculate the exclusion limits and the p0 value. The limits are exercised by searching for the di-boson
signal W Z and ZZ when one of the Z bosons decays to a b¯b pair and the other vector boson decays leptonically. This di-boson signal has a cross section that is about 5 times larger than the Higgs, with softer pZT spectrum and peaking at a lower di-b-jet invariant mass. The result of the fit in the search for the di-boson signal yielded a strength parameter µdi−boson= 1.09 ± 0.20 (stat) ±0.22 (syst), in good agreement with the SM expectations.
The 95% CL obtained in the fit to search for the SM Higgs boson in the associated production with a vector boson and decaying to a b¯b pair is shown in figure 10 (left). The expected sensitivity at 125 GeV is around 1.9 standard deviations, while the observed limit is 1.8σ, corresponding to a p0 value of 0.64.
6.3. H → τ τ
The search for the Higgs boson decay to τ -lepton pairs is done dividing the analysis in different channels, depending if the τ τ pair is accompanied by zero, one or two jets with pT above
25 GeV [49]. The zero-jet category is more sensitive to the gluon-gluon production mechanism, while the 2-jet final state is more sensitive to the VBF mechanism.
τ -leptons decay about 55% of the time to a narrow jet made of one or three charged pions plus several neutral pions. A multivariate analysis technique is used to select the hadronically decaying τ -leptons. Approximately 36% of the time, taus decay to another lepton and a neutrino. In that case, the invariant mass of the τ is reconstructed using the missing mass calculator, that
Figure 9. Invariant mass distribution of the di-b-jet pair in the search for H → b¯b in the associated production mode with a vector boson [48]. The distributions show the most sensitive categories in each of the channels considered (zero, one and two leptons in the final state).
Figure 10. 95% combined CL exclusion limits as a function of the mass of the Higgs, obtained in the Higgs search in the associated production with a vector boson when the Higgs decays to b¯b pairs [48](left) and in the H → τ τ search [49](right).
constrains the neutrino momentum using the tau decay kinematics [50]. In this analysis, all the possible final state τ -lepton topologies are considered [49].
backgrounds affecting the hadronic signatures and the limited mass resolution, this channel has limited sensitivity, similar to the H → b¯b channel.
The combined 95% confidence level exclusion limits in the H → τ τ channel are shown in figure 10 (right). The combined expected limits vary between 1.2 and 3.4 times the predicted SM cross-section times branching ratio for the mass range 100-150 GeV, while the observed values vary between 1.3 and 3.3 times the predicted value. The expected (observed) limit at 125 GeV is 1.2 (1.9) times the SM cross section times branching ratio. For this mass, the local significance is 1.7 standard deviations and the best fitted signal strength is µ = 0.7 ± 0.7. 6.4. Combination
A combined fit on all the available ATLAS results has been performed in [51]. The best fit signal strength parameter obtained was: µ = 1.3 ± 0.3 for 126 GeV Higgs boson signal. The compatibility of the different results is at the 36% level, while the compatibility with the SM hypothesis is 23%. The excess with respect to the SM expectation is driven by the H → γγ results [45] (not presented here).
7. Summary and conclusions
A wide range of physics processes has been measured by the ATLAS Collaboration with the data collected so far, comprising precision measurements of Standard Model processes and searches for physics beyond it. Overall, the results are consistent with the SM, with no clear evidence of new physics.
The search for the Standard Model Higgs boson, responsible for the Electroweak Symmetry breaking mechanism, lead to the discovery in July 2012 of a new boson with a mass of 126 GeV. The focus of the ATLAS collaboration goes now into understanding the nature of this particle and measuring its properties. Three decay channels were updated in between July and December 2012 and have been presented in this paper. The results show that, within the limited statistics available for the moment, the new boson is still compatible with the SM hypothesis.
Acknowledgments
The author acknowledges the support by FCT co-financed by QREN/COMPETE of European Union ERDF fund, Portugal.
References
[1] ATLAS Collaboration 2008 JINST 3 S08003 [2] ATLAS Collaboration 2012 Phys. Rev. D 86 014022 [3] Cacciar M, Salam G P and Soyez G 2008 JHEP 0804:063
[4] Cacciar M, Salam G P and Soyez G 2011 CERN CERN-PH-TH/2011-297 [5] Nagy Z 2003 Phys. Rev. D68 094002
[6] Lai H-L et al. 2010 Phys. Rev. D82 074024
[7] Martin A, Stirling W, Thorne R and Watt G 2009 Eur. Phys. J. C63 189 [8] Ball R D et al. 2010 Nucl. Phys. B838 136
[9] Forte S, Laenen E, Nason P and Rojo J 2010 Nucl. Phys. B834 116
[10] H1 and ZEUS Collaborations Herapdf 1.5 h1prelim-10-142, ZEUS-prel-10-018 [11] Eichten E, Lane K D and Peskin M E 1983 Phys. Rev. Lett. 50 811
[12] Baur U, Hinchliffe I and Zeppenfeld D 1987 Int. J. Mod. Phys. A2 1285 [13] Baur U, Spira M and Zerwas P M 1990 Phys. Rev. D42 815
[14] Frampton P H and Glashow S L 1987 Phys. Lett. B190 157 [15] Bagger J, Schmidt C and King S 1988 Phys. Rev. D 37 1188
[16] ATLAS Collaboration 2012 Search for new phenomena in the dijet mass distribution updated using 13/fb of pp collisions at √s = 8 TeV collected by the ATLAS detector ATLAS-CONF-2012-148 (https://cds.cern.ch/record/1493487)
[17] CDF Collaboration 2009 Phys. Rev. D79 011101
[19] Lyons L 2008 Ann. Appl. Stat. 2 887
[20] ATLAS Collaboration 2012 Statistical combination of top quark pair production cross-section measurements using dilepton, single-lepton, and all-hadronic final states at √s = 7 TeV with the ATLAS detector ATLAS-CONF-2012-024 (https://cds.cern.ch/record/1430733?ln=es)
[21] ATLAS Collaboration 2012 Measurement of the top quark pair production cross section with ATLAS in pp collisions at√s = 7 TeV in the single-lepton channel using semileptonic b decays ATLAS-CONF-2012-131 (https://cds.cern.ch/record/1478370)
[22] ATLAS Collaboration 2012 Measurement of the top quark pair production cross section in the single-lepton channel with ATLAS in proton-proton collisions at 8 TeV using kinematic fits with b-tagging ATLAS-CONF-2012-149 (http://cdsweb.cern.ch/record/1493488)
[23] ATLAS Collaboration 2012 Measurement of the jet multiplicity in top-anti-top final states pro-duced in 7 TeV protonproton collisions with the ATLAS detector ATLAS-CONF-2012-155 (http://cdsweb.cern.ch/record/1493494)
[24] Mangano M L et al. 2003 JHEP 0307 001 [25] Corcella G et al. 2001 JHEP 0101 010
[26] Frixione S and Webber B R 2002 JHEP 0206 029
[27] Alioli S, Nason P, Oliari C and Re E 2010 JHEP 1006 043
[28] ATLAS Collaboration 2012 Measurement of top quark polarisation in tt events with the ATLAS detector in proton-proton collisions at√s = 7 TeV ATLAS-CONF-2012-133 (http://cdsweb.cern.ch/record/1478373) [29] Mahlon G and Parke S 2010 Phys. Rev. D81 074024
[30] ATLAS Collaboration 2012 Phys. Rev. Lett. 108 212001
[31] ATLAS Collaboration 2012 Measurement of W W production in pp collisions at p(s) = 7 TeV with the ATLAS detector and limits on anomalous W W Z and W W γ couplings arXiv:1203.6232, submitted to Phys. Rev. D (http://arxiv.org/abs/1210.2979)
[32] Campbell J M et al. 2009 Phys. Rev. D80 054023
[33] Hagiwara K, Peccei R D, Zeppenfeld D and Hikasa K 1987 Nucl. Phys. B282 253 [34] CMS Collaboration 2011 Phys. Lett. B699 25
[35] CDF Collaboration 2010 Phys. Rev. Lett. 104 201801 [36] D0 Collaboration 2009 Phys. Rev. Lett. 103 191801 [37] DELPHI Collaboration 2008 Eur. Phys. J. C54 345 [38] L3 Collaboration 2004 Phys. Lett. B586 151 [39] OPAL Collaboration 2004 Eur. Phys. J. C33 463 [40] ALEPH Collaboration 2005 Phys. Lett. B614 7 [41] ATLAS Collaboration 2012 Phys. Lett. B717 49
[42] Campbell J M and Ellis R 2010 Nuclear Physics B - Proceedings Supplements 205 10
[43] ATLAS Collaboration 2012 Measurement of ZZ production in pp collisions at p(s) = 7 TeV with the ATLAS detector and limits on anomalous ZZZ and ZZγ couplings arXiv:1211.6096, submitted to JHEP (http://arxiv.org/abs/1211.6096)
[44] ATLAS Collaboration 2012 Measurement of the ZZ production cross section in the four-lepton channel using 5.8 fb−1 of ATLAS data at p(s) = 8 TeV ATLAS-CONF-2012-090 (http://cdsweb.cern.ch/record/1460409)
[45] ATLAS Collaboration 2012 Phys. Lett. B716 1
[46] ATLAS Collaboration 2012 Search for the standard model Higgs boson produced in association with top quarks in proton-proton collisions at √s = 7 TeV using the ATLAS detector ATLAS-CONF-2012-135 (http://cdsweb.cern.ch/record/1478423)
[47] ATLAS Collaboration 2012 Update of the H → W W(∗) → eνµν analysis with 13.0 fb1 of√s = 8 TeV data
collected with the ATLAS detector ATLAS-CONF-2012-158 (http://cdsweb.cern.ch/record/1493601) [48] ATLAS Collaboration 2012 Search for the standard model Higgs boson produced in association with
a vector boson and decaying to bottom quarks with the ATLAS detector ATLAS-CONF-2012-161 (http://cdsweb.cern.ch/record/1493625)
[49] ATLAS Collaboration 2012 Search for the standard model Higgs boson in H → τ+τ−decays in proton-proton collisions with the ATLAS detector ATLAS-CONF-2012-160 (http://cdsweb.cern.ch/record/1493624) [50] Elagin A, Murat P, Pranko A and Safonov A 2011 Nucl. Instrum. Meth. A654 481
[51] ATLAS Collaboration 2012 Updated ATLAS results on the signal strength of the Higgs-like boson for decays into WW and heavy fermion final states ATLAS-CONF-2012-162 (http://cdsweb.cern.ch/record/1494183)
![Figure 4. Jet multiplicities in t ¯ t events for two different jet p T thresholds: 25 GeV (left) and 80 GeV (right) [23].](https://thumb-eu.123doks.com/thumbv2/123dok_br/15816668.1081180/5.892.106.717.170.513/figure-jet-multiplicities-events-different-thresholds-gev-right.webp)
![Figure 5. Left: normalized differential WW fiducial cross section as a function of the leading lepton p T [31]](https://thumb-eu.123doks.com/thumbv2/123dok_br/15816668.1081180/7.892.127.739.277.520/figure-normalized-differential-fiducial-section-function-leading-lepton.webp)
![Figure 7. Limits on the anomalous TGC ∆k γ , λ γ , h W 3 , h Z 3 , h W 4 , h Z 4 , f 4 γ , f 4 Z , f 5 γ and f 5 Z in comparison to the values obtained by D0, CDF and the LEP experiments (see [41, 43] and references therein).](https://thumb-eu.123doks.com/thumbv2/123dok_br/15816668.1081180/9.892.125.755.162.738/figure-limits-anomalous-comparison-values-obtained-experiments-references.webp)
![Figure 8. Left: invariant mass distribution of events with a leading electron [47]. Right: p 0](https://thumb-eu.123doks.com/thumbv2/123dok_br/15816668.1081180/11.892.114.766.171.409/figure-left-invariant-distribution-events-leading-electron-right.webp)
 and in the H → τ τ search [49](right).](https://thumb-eu.123doks.com/thumbv2/123dok_br/15816668.1081180/12.892.114.412.174.598/figure-combined-exclusion-limits-function-obtained-associated-production.webp)
